Femtosecond laser fabrication of fiber based optofluidic platform for
flow cytometry applications
Murat Serhatlioglu
a,b, Caglar Elbuken
a,b, Bulend Ortac
a,b, Mehmet E. Solmaz*
ca
UNAM – National Nanotechnology Research Center, Bilkent University, 06800, Ankara, Turkey;
bInstitute of Materials Science and Nanotechnology, Bilkent University, 06800, Ankara, Turkey;
cDepartment of Electrical and Electronics Engineering, Izmir Katip Celebi University, 35620, Izmir,
Turkey
ABSTRACT
Miniaturized optofluidic platforms play an important role in bio-analysis, detection and diagnostic applications. The advantages of such miniaturized devices are extremely low sample requirement, low cost development and rapid analysis capabilities. Fused silica is advantageous for optofluidic systems due to properties such as being chemically inert, mechanically stable, and optically transparent to a wide spectrum of light. As a three dimensional manufacturing method, femtosecond laser scanning followed by chemical etching shows great potential to fabricate glass based optofluidic chips. In this study, we demonstrate fabrication of all-fiber based, optofluidic flow cytometer in fused silica glass by femtosecond laser machining. 3D particle focusing was achieved through a straightforward planar chip design with two separately fabricated fused silica glass slides thermally bonded together. Bioparticles in a fluid stream encounter with optical interrogation region specifically designed to allocate 405nm single mode fiber laser source and two multi-mode collection fibers for forward scattering (FSC) and side scattering (SSC) signals detection. Detected signal data collected with oscilloscope and post processed with MATLAB script file. We were able to count number of events over 4000events/sec, and achieve size distribution for 5.95µm monodisperse polystyrene beads using FSC and SSC signals. Our platform shows promise for optical and fluidic miniaturization of flow cytometry systems.
Keywords: Flow cytometry, femtosecond laser, machining, hydrodynamic focusing, all-fiber, optofluidic, fused silica,
microfluidics.
1. INTRODUCTION
Flow cytometers (FCs) firstly appeared in the literature around 1960s1. There are many successful industrial products
and research articles based on flow cytometers. It plays and important role in the diagnosis and monitoring of various diseases by inspecting, counting, and sorting particles and cells. Important physical and chemical parameters such as particle size and shape, granularity, DNA and protein content are extracted using the interaction of optical light beam while particles passing through flow medium. FCs are considered as an important clinical research tool for malignant epithelial cell immunophenotyping2 and CD4 T-lymphocyte counting in HIV detection3.
An FC consists four main parts: fluid delivery system, optic components, (laser diode, lenses, filters, photodiodes, fibers) electronic parts, (amplifier circuits, signal processing units, computer) and additionally, cell sorting system for specific applications. Fluid delivery system plays an important part since the particles in a FC system need to be aligned in 3D to the center of flow medium in order to avoid clogging and trans-off axial data acquisition. In a flow cytometer 3D focused particles are directed through a flow cell. During their passage from optical interrogation region, they scatter the incident excitation laser light to detectors which are specifically arranged for extracting different features.
*[email protected]; phone 90 232 329-3535; fax 90 232 329-3999; www.solmazresearchgroup.com
Optical Fibers and Sensors for Medical Diagnostics and Treatment Applications XVII, edited by Israel Gannot, Proc. of SPIE Vol. 10058, 100580I · © 2017 SPIE · CCC code: 1605-7422/17/$18 · doi: 10.1117/12.2252092
The oppositely placed front detector collects forward scattered light (FSC), which is related to cell size and cell surface area. The angled detector/s collect side scatter light (SSC) which is related to cell granularity and complexity. Also fluorescent signal detection from fluorescently labeled cells occurs at side scattering using band pass filters for specific emission wavelengths. State of the art FC systems use bulk optics which have alignment issues, require large sample volumes, are expensive to buy and maintain, and requires qualified user for utilization and maintenance. In the last two decades, there has been great interest in microfluidic lab-on-a-chip systems towards fast bio-analysis and examination while using vastly smaller sample volume. Microfluidic based FCs (MFC) have attracted a great deal of interest in microfluidic system because they are advantageous for aspects of miniaturization, low-cost fabrication and production, small amount of sample requirement, high throughput in the measurement, and operating without a need for qualified operator. It also enables integration of optical elements into one single chip, which is a great opportunity for optical miniaturization.
Microfluidic devices are commonly fabricated with polymers, silicon and glass. Polymers are cost effective and easy to fabricate but suffers from chemical stability for long duration or multiple use applications4. Silicon and glass shows
better chemical and mechanical stability. However, silicon is opaque to visible light it does not give desired performance for visualization and hence not preferred for optofluidic applications. On the other hand, glass surfaces are chemically inert, mechanically stable, and optically transparent to a wide spectrum of light. Glass-based microfluidic system fabrication with well-known cleanroom fabrication techniques are generally considered costly and time consuming compared to polymer based chip fabrication, Fortunately, femtosecond laser micromachining assisted hydrofluoric acid (HF) etching of transparent glass structures, opens the doors of cost and time reduced fabrication of complex structures in fused silica for microfluidic channels4–6, and monolithic integrated devices7–9.
Mao et al. implemented microfluidic drifting based 3D hydrodynamic focusing system and integrated optical fibers in a miniaturized PDMS based MFC10. Testa et al. showed self-aligned 3D hydrodynamic focusing in a fiber based MFC
system11 which constitutes the basis for our 3D hydrodynamic focusing flow cytometry chip. Watts et al. showed and
integrated lens system MFC architecture on in order to increase the detection efficiency at light interrogation zone12.
Jang et al. showed low cost electroosmotically driven flow cytometry chip for dual fluorescent detection although it is not enough for high throughput applications as it serves as a unique conceptual result13. Paie et al. implemented
femtosecond laser inscribed optical waveguides and femtosecond laser machined buried 3D complex 3D hydrodynamic focusing structure in fused silica which served as microfluidic cell counter device5. Recently Zhao et al. showed a PDMS
disposable focusing lens and fibers integrated MFC chip for red blood cell and platelet counting application14. The
common denominator for given and all other examples in the literature is achieving simple and low cost flow cytometry device.
Here we report, femtosecond laser machined, fiber-based fused silica microfluidic based flow cytometer platform supported with 3D hydrodynamic focusing using only one sheath and one sample fluid inlet. We used 5.95µm polystyrene beads in order to measure the performance of device. While hydrodynamically focused 5.95µm polystyrene beads passing through fiber interrogation line we excited with 5 mW optical power and 405 nm wavelength blue laser and we measured FSC signal with photodetector and SSC signal with PMT then calculated coefficient of variation (CV) values. Afterwards, we theoretically showed how focused particle location and particle size variation effects the calculated CV results.
2. EXPERIMENTAL METHODS
2.1 Fabrication
We have reported our femtosecond laser assisted carving (FLAC) fabrication method and detailed steps which provides faster scanning rate for mostly low repetition rate femtosecond laser machining requirements15. Also reported article
gives great deal of comparison with traditional glass micromachining techniques in terms of machining time, precision, surface roughness, feature size, repeatability, multi-processing capability. Traditional laser radiation techniques require to radiate all 3D shape and takes more time, dependent to volume of design while FLAC only requires side-walls and bottom surface radiation of the design and carving it out with assisted HF etching. In summary, fabrication of miniaturized optofluidic FC microchip starts with CAD design and follows by femtosecond laser irradiation step through high precision automated XYZ stage on a custom made femtosecond laser machining bench. Radiated samples were then
N
61 (4) ass Bending 650°C. Then, through fiber fixed with UV Figure 1. Illustrative dr process is giv two parts and width with sh with 3mm di compared to center microp micropool (F Figure 2. etching, a The size com A–A cross se the same size in enlargeme channel desig, tubing for in r slots that are V curable poly
Illustrative draw
rawing of the ven in Fig. 2. d were carved heath flow arm
ameter in ord channels, it w pool as radia ig. 2(e)), and
(a) Fabricated M after (b) 0 min, ( mparison of sh ection in Fig. 2 e of sample ch ent on desired gn with regard
nlets and outle e designed to ymer. FLAC f
wing of the fem
e patterned fu 3D hydrodyn d on to both fa ms but with h der to achieve was partitioned ated (Fig. 2(b
the fiber groo
MFC design for (c) 15 minutes, heath arms and 2(d). Here the hannel. It is im d dimensions. d to total HF e et were bonde approximately fabrication ste mtosecond laser
used silica slid namic focusin
aces. Face 2 h half of the dep
perfect align d into smaller )), after 15 m oves and main
r both fused sili (d)-(g) 65 minu d sample fluid e width “w” an mportant to no Hence the g etching time.
ed. Finally, the y be the same eps are illustra
r machining of F
des (Face 1 an ng arms and sa has the fiber g pth. Alignmen nment for bon r pieces for fa minutes of HF
channel prior
ica slides. Time utes.
dic channels a nd height “h” ote that HF als given dimensi e excitation an e size as 125u ated in Fig. 1. FC fabrication p nd Face 2) an ample fluid su grooves and s nt holes at eac ding of both aster FLAC pr F (Fig. 2(d)) r to the bondin e-lapse microsc are given in F is ~140 µm a so etches bare
ions were car
nd collection um diameter f process. nd the micros urrounding mi sample fluid c ch corner were faces. Since m rocess. Face 2 and after 65 ng step (Figs.
cope images for Fig. 3, which i and the fiber g fused silica a refully planne
optical fibers fibers. The fib
scope images icro-pool wer channel which e drilled using micropool has 2 images give minutes of H 2(d)–2(g)). r face 2 during H is an illustrati grooves were d at a slower rat ed and compe were inserted bers were then
during FLAC re divided into h has the same g femtosecond s a bigger size the details of HF for center HF ive drawing o designed to be te16 and results ensated in the d n C o e d e f, r f e s e
fSC-PG SSC- FM-Figure 3. and horizo 2.2 Optical m An optical im As shown in three detectio has a center w inserted perp three detectio detected FSC while we use distance from blocks the las and ~800µm SSC signal de the MFC chip fiber optical w Figure 4. femtoseco 2.3 Sample P We used 1X Inc. at 0.12µm blue colored particles/µl an
A-A cross secti ontal directions
methods
mage was take illustrative dr on fibers. The wavelength of endicularly to on fibers are C, SSC, and FL ed Hamamatsu m the center po ser light when to FL fiber w etection. Besi p capable of f wavelength di
(a) Assembled ond laser fabric
Preparation
phosphate bu m standard de food dye (fil nd sonicated f
ion (in Fig. 2(d s. en of the integ rawing Fig. 4 input fiber us f 405nm, num o interrogation arranged at s L signals. FSC u H7827-011 oint of focuse n particles pas which was posi ide, we were n fluorescent sig ivision multip and ready to us ated MFC. uffered saline eviation (SD) ltered using 0 for 15 min in o d)) of the bonded grated, assemb (b), the fiber-sed was a sing merical apertur n zone to guid specific angle C signal was d photomultipl ed sample stre ssing through itioned at 120° not able to dem gnal detection lexing filters b se MFC chip; (b (PBS) as she used in the sa 0.2µm pore sy order to avoid d FC chip. Sam
bled, and ready -based FC chi gle mode (SM re (NA) of 0.1 de the excitati es across the detected with ier tube (PMT eam is ~10µm , ~500µm to S ° angle to the monstrate the n with two dif before PMTs
b) The illustrati
eath fluid and ample stream yringe filter) d aggregation mple channel 3D y to use 60x2 ip includes fou M) pigtailed bl 12, mode field on light to the flow channel Thorlabs-FD T) for collecti m to laser excit SSC fiber, po excitation fib measurement fferent colors as shown in F
ive figure for in
d 5.95µm poly . The particle
for better vis during experi D hydrodynamic 0x2mm3 flow ur optical fibe ue fiber laser d diameter (M e focused sam l and are able S625 Graded ing the SSC s tation fiber, ~ ositioned at 14 ber. We did no t for fluoresce (535 and 710 Fig. 4(b).
nput and output
ystyrene micr s were diluted sualization, to ments. c focused in bo w cytometry ch ers: the excita which is oper MFD) of 3.6 ± mple flow stre e to simultan Index pigtail signal. The ce ~300µm to FS 40° angle to e ot use any filte
ent detection, 0nm band pass fiber assignme robeads form d in a 1X PBS o a concentrat th vertical
hip (Fig. 4(a)) ation fiber and
rated at 3mW ±0.5µm, and is
am. The other eously collec ed photodiode enter to center SC fiber which xcitation fiber er for FSC and but fabricated s filters) using ents of the Polysciences S solution and tion of ~1000 ). d W, s r ct e r h r d d g s, d 0
3.1 Device p The 3D hydro in Fig. 5. PB same time 5. rates, 300, 16 (f), respective 5(a), 5(c) and rate. The app 5(c) and 5(e) resolution. Si at the center o Figure 5. The chang ~60mbar FSC and SSC and then anal 1ms (zoomed of recorded d Also the loca similar profil and provides Collected dat performance odynamic focu BS based sheat 95µm polysty 60, and 40µl/m ely. Figures 5( d 5(e) shows t proximated cu ), respectively ince sheath flo of channel and Self-aligned 3D ge in the diame (a)-(f). Sample C data were re lyzed with a w d view of 17th data) in Figs 6 ations of FSC e for FSC wit well-separate ta was post-pr
3
tests using perform th fluid was p yrene bead m min and sheath(b), 5(d) and 5 the change in ubic-diameter y. Since our ow arms were d provided gre D hydrodynami ter of 3D focus flow rates; (a)-ecorded simul written script – 18th millise 6(a), 6(b), and C and SSC sig th pulse and S ed events at t ocessed with
. RESULT
mance of the F pumped throu mixture of solu h to sample fl 5(f) shows how the diameter of the focused polystyrene p e fabricated sy eat stability to c focusing with sed sample strea -(b) 300µl/min; ltaneously usi in MATLAB conds of reco d 6(c) respect gnals match w SSC values. T the limits of MATLAB scrTS AND DI
FC chip was o ugh the sheathution was inje low rate ratios w sheath fluid of focused st d stream was particles are ymmetrically a o the performa h constant sheat am; (b), (d), (f) ; (c)-(d) 160µl/m ing a digital o B. Recorded s orded data) and
tively. Each d with each othe The time durat
our system a ript and we re
ISCUSSIO
observed at dif h inlet at a pre ected through s 3.5, 7.5 and d squeezes the tream in micro measured as in 5.95µm si and merged in ance of the devth flow rate but 3D squeezing c min; (e)-(f) 40µ oscilloscope, f ignals for FS d 20µs (zoom detected peak er. As shown tion of each p and would be esulted 846 ev
ON
fferent flow ra essure of 60m h the sample i 32.5 in Figs. e sample flow ochannel with ~35µm, ~17µ ize, ~7µm fo n one inlet, 3D vice. varying sample change in micro µl/min. for 200ms at a C and SSC ar med view of 17 is characteris in 20µs ampl eak despite th enough for h vents per 200mates and result mbar and hold inlet at three 5(a)-(b), 5(c) in micropool h varying sam µm and ~7µm cus diameter D focusing alw
e flow rate: (a), opool. Sheath p a sampling rat re shown in F 7.39th – 17.41s stic to size of lified graph, e heir height var
high throughp ms (~4200 eve ts were shown d stable, at the different flow -(d), and 5(e) whereas Figs mple fluid flow m in Figs. 5(a)
gives perfec ways was kep
, (c), (e) pressure is te of 0.5 MHz Fig. 6; 200ms st milliseconds f the particles each peak has riation is ~1µs put cytometry ents/sec). n e w -s. w ), ct pt z s, s s. s s y.
Figure 6. (zoomed d millisecon 3.2 Cytomet We compared 2D histogram commercial F counted even SSC have qu the aggregate upper region from the plot
Figure 7. gating for signal. Our FC chip calculated CV sample in com Recorded FSC data to 17th to 1 nds recorded da try results an
d our test resu m plots for bot FC in Table 1 nts amplify aro uite wide side
ed polystyrene of side-wing , we reached m FSC and SSC s r FSC signal; (b p has 37% CV V values redu mmercial BD and SSC signa 18th millisecond ata) nd compariso ults with BD A th FSC and S 1. Measured v ound 2V for b wings which e bead double gs and narrow more accurate
signal peak hist b) after 80% gat V for FSC si uce to 24% a Accuri FC, h ls prior to MAT ds recorded data n with a com Accuri D6 flow SC peak heig voltage signal both signals. E reach to 0V i ets and residu w down the ca e results and m
togram compari ting for FSC sig gnal and 22% and 13%, resp has 9% CV fo TLAB processin a); (c) 20µms ti mmercial flow w cytometer c ght values in F l varies from Even though in lower and ue particles in alculation in b much lower CV
ison for CV cal gnal; (c) prior to % CV for SS pectively. On or FSC signal ng step. (a) 200 me duration (zo w cytometry sy commercially Fig. 7 and cal 0 to 5V for b the counted e 3V and over n food dye. W between 1.4– V values. lculations of MA o gating for SSC C signal befo
the other han l and 37% CV 0ms time durati oomed data in 1 ystem available for lculated CV re both FSC and events amplify in upper parts When we apply 2.5V, to excl ATLAB post pr C signal; (d) aft ore gating. W nd, the calcul V for SSC sign on; (b) 1ms tim 17.39th to 17.41 research facil esults with a c d SSC, howev y around 2V, s. This can be y 80% gating lude distortiv rocessed data. ( fter 80% gating When we appl lated results w nal before gat
me duration st lities. We used comparison to ver number o both FSC and e explained by g to lower and ve false counts (a) Prior to for SSC ly 80% gating
with the same ting. After we d o f d y d s g e e
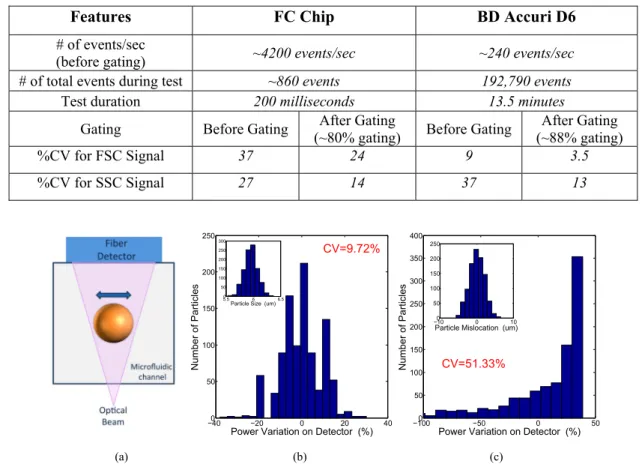
Experimental results show that the performance of commercial flow cytometer is better than the fabricated flow cytometry chip for FSC signal, and similar performance with gating for SSC values. A possible reason for worse performance could be very high sample flow rate and and low data sampling rate. Flow rate during experimental test of commercial flow cytometer was 20 times smaller than the flow rate for the fabricated MFC chip. Such high flow rate and low sampling rate can cause false data interpretation and signal variations for FSC values. Another reason could be due to the contribution of polystyrene bead size variation and imperfect alignment of particles in 3D hydrodynamic focusing. The beads used had a size variation of 5.95±0.12μm. We performed a Monte-Carlo simulation on the effect of standard deviation (0.12μm) to the power variation on the detector (Fig. 8(b)). If a bead with 5.95μm in diameter passes perfectly at the center of 11μm wide optical beam (which is calculated using Gaussian beam propagation), the power variation is 0%. However, assuming a Gaussian distribution for particle size, the light incident on the fiber also is a Gaussian distribution with a CV of 9.72%. Even a small particle size variation can cause up to 10% change in signal height. Furthermore, we assumed that the particles might also be passing slightly off axis (Fig. 8(a)) with a standard deviation of 2μm. Again, based on a Gaussian distribution of particle mislocation, the light on the detector gains a CV of 51.33% (Fig. 8(c)). According to the simulation results, particle off-axis passing and size distribution are major causes for obtaining FSC and SSC signals with a distribution.
Table 1. Comparison of CV values for fabricated MFC chip and commercial BD Accuri D6 flow cytometry instrument.
Features FC Chip BD Accuri D6
# of events/sec
(before gating) ~4200 events/sec ~240 events/sec
# of total events during test ~860 events 192,790 events
Test duration 200 milliseconds 13.5 minutes
Gating Before Gating (~80% gating) After Gating Before Gating (~88% gating) After Gating
%CV for FSC Signal 37 24 9 3.5
%CV for SSC Signal 27 14 37 13
(a) (b) (c)
Figure 8. (a) Bead passing through the optical beam and momentarily blocking it. Moving the bead left-right causes the optical power on fiber detector to deviate; (b) The effect of particle size distribution on detector power variation; (c) The effect of particle mislocation on detector power variation.
4. CONCLUSION
In this study, we presented the design, fabrication and FSC-SSC characterization of fused silica fiber-based on-chip optical detection flow cytometry platform. A very narrow single stream of particles was achieved by self-aligned 3D hydrodynamic focusing with only one sheath and one sample inlet. Stream size variation at a fixed sheath flow rate and variable sample flow rate was achieved between 7-35µm. We achieved over ~4000 events/sec throughput for detected events, at the limits of our system under present conditions. The CV values, flow rate, and number of counted events
−400 −20 0 20 40 50 100 150 200 250
Power Variation on Detector (%)
Numb e r of P a rti cle s CV=9.72% 5.50 6 6.5 50 100 150 200 250 300
Particle Size (um)
−1000 −50 0 50 50 100 150 200 250 300 350 400
Power Variation on Detector (%)
Numb e r of P a rti cle s −100 0 10 50 100 150 200 250
Particle Mislocation (um)
CV=9.72%
CV=51.33%
were compared to a commercial flow cytometer. We performed the test ~20 times faster than commercial flow cytometer at given conditions. Our platform gives relatively close results for SSC CV calculations while lacking the FSC CV calculations. We elaborated on the possible reasons of FSC CV difference in comparison. Applying further adjustments and changes to our fabricated chip could provide a higher throughput, low-cost microfluidic based flow cytometry platform for point-of-care use.
ACKNOWLEDGEMENT
This work is supported by The Scientific and Technological Research Council of Turkey (TUBITAK) under grant no. 113E321. Mehmet E. Solmaz acknowledges the EU COST action MP1205. Bulend Ortac acknowledges the TUBA-GEBIP program. Authors also would like to acknowledge, Ph.D. candidate Nuray Gunduz for her tremendous support during BD Biosciences Accuri D6 flow cytometer measurements and great discussions during the data analysis.
REFERENCES
[1] Fulwyler, M. J., “Electronic Separation of Biological Cells by Volume,” Science (80-. ). 150(3698), 910–911 (1965).
[2] Crow, M. J., Marinakos, S. M., Cook, J. M., Chilkoti, A.., Wax, A., “Plasmonic flow cytometry by immunolabeled nanorods,” Cytom. Part A 79(1), 57–65 (2011).
[3] Cheng, X., Irimia, D., Dixon, M., Sekine, K., Demirci, U., Zamir, L., Tompkins, R. G., Rodriguez, W.., Toner, M., “A microfluidic device for practical label-free CD4(+) T cell counting of HIV-infected subjects.,” Lab Chip
7(2), 170–178 (2007).
[4] Jagannadh, V. K., Mackenzie, M. D., Pal, P., Kar, A. K.., Gorthi, S. S., “Imaging flow cytometry with
femtosecond laser-micromachined glass microfluidic channels,” IEEE J. Sel. Top. Quantum Electron. 21(4), 1–6 (2015).
[5] Paiè, P., Bragheri, F., Vazquez, R. M.., Osellame, R., “Straightforward 3D hydrodynamic focusing in femtosecond laser fabricated microfluidic channels.,” Lab Chip 14(11), 1826–1833 (2014).
[6] He, S., Chen, F., Yang, Q., Liu, K., Shan, C., Bian, H., Liu, H., Meng, X., Si, J., et al., “Facile fabrication of true three-dimensional microcoils inside fused silica by a femtosecond laser,” J. Micromechanics Microengineering
22(10), 105017 (2012).
[7] Bellini, N., Vishnubhatla, K. C., Bragheri, F., Ferrara, L., Minzioni, P., Ramponi, R., Cristiani, I.., Osellame, R., “Femtosecond laser fabricated monolithic chip for optical trapping and stretching of single cells,” Opt. Express
18(5), 4679–4688 (2010).
[8] Yang, T.., Bellouard, Y., “Monolithic transparent 3D dielectrophoretic micro-actuator fabricated by femtosecond laser,” J. Micromechanics Microengineering 25(10), 105009, IOP Publishing (2015).
[9] Athanasiou, C. E.., Bellouard, Y., “A monolithic micro-tensile tester for investigating silicon dioxide polymorph micromechanics, fabricated and operated using a femtosecond laser,” Micromachines 6(9), 1365–1386 (2015). [10] Mao, X., Nawaz, A. A., Lin, S. C. S., Lapsley, M. I., Zhao, Y., McCoy, J. P., El-Deiry, W. S.., Huang, T. J., “An
integrated, multiparametric flow cytometry chip using ‘microfluidic drifting’ based three-dimensional hydrodynamic focusing,” Biomicrofluidics 6(2), 1–9 (2012).
[11] Testa, G., Persichetti, G.., Bernini, R., “Micro flow cytometer with self-aligned 3D hydrodynamic focusing.,” Biomed. Opt. Express 6(1), 54–62 (2015).
[12] Watts, B. R., Zhang, Z., Xu, C.-Q., Cao, X.., Lin, M., “Integration of optical components on-chip for scattering and fluorescence detection in an optofluidic device,” Biomed.Opt.Express 3(11), 2784–2793 (2012).
[13] Jiang, H., Weng, X.., Li, D., “Dual-wavelength fluorescent detection of particles on a novel microfluidic chip.,” Lab Chip 13(5), 843–850 (2013).
[14] Zhao, Y., Li, Q., Hu, X.., Lo, Y., “Microfluidic cytometers with integrated on-chip optical systems for red blood cell and platelet counting,” Biomicrofluidics 10(6), 64119 (2016).