INVESTIGATION OF THE ADSORPTION BEHAVIOR OF CESIUM, BARIUM AND PHENOL ONTO MODIFIED
HUMIC ACID AND IRON NANOPARTICLES
A THESIS
SUBMITTED TO THE DEPARTMENT OF CHEMISTRY AND THE INSTITUTE OF ENGINEERING AND SCIENCES
OF BILKENT UNIVERSITY
IN PARTIAL FULFILLMENT OF THE REQUIREMENTS FOR THE DEGREE OF
MASTER OF SCIENCE
By
OĞUZHAN ÇELEBİ May 2007
I certify that I have read this thesis and that in my opininon it is fully adequate, in scope and in quality, as a thesis of the degree of Master of Science
Prof. Dr. Hasan N. Erten (Advisor)
I certify that I have read this thesis and that in my opininon it is fully adequate, in scope and in quality, as a thesis of the degree of Master of Science
Prof. Dr. Ömer Dağ
I certify that I have read this thesis and that in my opininon it is fully adequate, in scope and in quality, as a thesis of the degree of Master of Science
Prof.Dr. Hale Göktürk
I certify that I have read this thesis and that in my opininon it is fully adequate, in scope and in quality, as a thesis of the degree of Master of Science
Assoc. Prof. Dr. Oğuz Gülseren I certify that I have read this thesis and that in my opininon it is fully adequate, in scope and in quality, as a thesis of the degree of Master of Science
Assist. Prof. Dr. Emrah Özensoy
Approved for the Institute of Engineering and Sciences
Prof.Dr. Mehmet Baray
ABSTRACT
INVESTIGATION OF THE ADSORPTION BEHAVIOR OF CESIUM, BARIUM AND PHENOL ONTO MODIFIED
HUMIC ACID AND IRON NANOPARTICLES
OĞUZHAN ÇELEBİ M.S. in Chemistry
Supervisor: Prof. Dr. Hasan N. Erten May 2007
There is an increasing effort for removing highly soluble
radiocontaminants from aqueous waste streams by fixing them onto solid waste forms that can be disposed of in a repository. In this way, the high-volume aqueous streams are transformed from a high-level radioactive waste into a low-level radioactive waste that is much cheaper to treat. However, the removal of this species may not only serve environmental initiatives, but it may also serve as a means of producing useful materials for use in science and industry. It is known, for example, that 137Cs is an excellent γ source for medical applications such as instrument disinfection and radiotherapy. Similarly, 137Cs has also proven to be useful as source for sterilization in the food industry. The radionuclide 137Cs is produced in high yield during the fission process and due to its long half-life (T1/2 =
30.17 y) and its high solubility in aqueous media, it is a principal radiocontaminant in radioactive wastes. Barium is an alkaline earth element (Z = 56), its radioactive isotope 140Ba (T1/2 = 12.79 d) is a fission product with a high yield (6.21%).
Wastewaters containing phenolic compounds present a serious environmental problem. Phenolic compounds are present in the wastewater generated from paint, solvent, petroleum (petrochemical), coal conversion etc. industries. Phenolic substances are known carcinogenic substances, doses over 1 g can be fatal for humans. Living organisms in aquatic environments are negatively effected by the uptake of phenolic subtances.
Humic acid , which is the most important organic component of soil, is a chemically and physically heterogeneous substance which is formed by chemical and biological degradation of organic residues in natural environment. Humic acid has many functions in soil chemistry such as adsorbing metal ions and organic substances, mineralization of plants and conversion of toxic substances biologically. Iron nanoparticle technology is increasingly being used in environmental remediation and hazardous waste treatment. One important advantage of nano-sized Fe0 used in conventional permeable reactive barriers is that nanoparticles may be delivered to deep contamination zones by injection.
This study was conducted to find an alternative and efficient way for removing radioactive and phenolic wastes from aquatic environments. Modified humic acids (sodium form of insolubilized humic acid (INaA) and surfactant modified insolubilized humic acid (SMIA) ) and iron nanoparticles were used as sorbent materials.
In this study, radioactive tracer method and UV-VIS spectroscopic technique were used to examine the sorption behavior of Cs+, Ba2+ ions and phenol onto modified humic acids and iron nanoparticles. Characterization studies of humic acid and its modified forms were carried out using FTIR, solid state 13C NMR spectroscopy techniques and adsorption sites (carboxylic and phenolic groups) of humic acid were quantitatively determined by potantiometric titration. SEM and PXRD techniques were used to characterize iron nanoparticle samples.
Sorption studies at different temperatures and kinetic studies were carried out to examine the effects of time, concentration, and temperature on the sorption of cations and phenol onto the various forms of humic acid and iron nanoparticles. All cation sorption processes are well described by both Freundlich and Dubinin-Radushkevich type isotherms. Phenol sorption data was well fitted to Freundlich and Tempkin isotherms when surfactant modified humic acid was used as a sorbent. The sorption order with cation sorbent pair is barium-INaA > cesium-INaA > barium- iron nanoparticles. Kinetic studies indicated that adsorption behaviors of both cations and phenol obey pseudo second order rate law. The rate constant values of the three sorption cases studied have an inverse relationship with sorption
affinity. The order for the rate of sorption with cation-sorbent pairs is as the following; barium-iron nanoparticles > cesium-INaA > barium-INaA. The equilibrium time for phenol sorption onto surfactant modified insolubilized humic acid was much longer than the equilibrium time for cations.
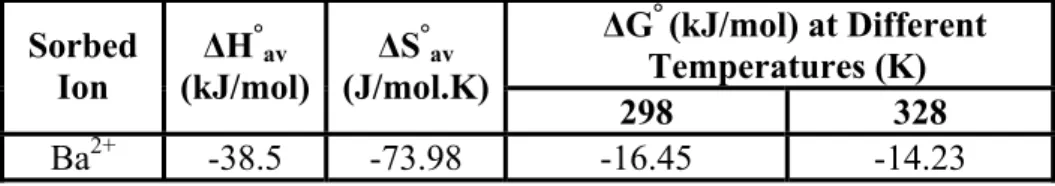
Thermodynamic parameters such as enthalpy change, ΔHº , entropy change, ΔSº and free energy of adsorption, ΔGº, were calculated from the sorption data of Cs+ and Ba2+ ions at different temperatures. The values obtained for ΔHº and ΔSº were -3.673 kJ/mol, 48.85 J/mol.K, 2.102 kJ/mol, 89.522 J/mol.K and -38.5 kJ/mol, -73.98 J/mol.K for cesium-INaA, barium-INaA and barium-iron nanoparticles ion-sorbent pairs, respectively. Temperature changes did not siginificanly affect the sorption affinity of Cs+ and Ba2+ ions onto INaA. Ba2+ ion sorption onto iron nanoparticles is an exothermic process which means that low temperatures are favored.
The calculated negative values of ΔGº obtained at different temperatures indicate the spontaneity of all adsorption processes studied. All adsorption mean free energy values are found to be within 8-16 kj/mol range which is the energy range of ion-exchange type processes.
Keywords: Adsorption, Isotherms, Modified Humic Acid, Thermodynamic Constants, Phenol, Kinetic Studies, Distribution Ratio, Radioactive Tracer Method, Cesium, Barium, Batch Method, Characterization, Iron Nanoparticles, UV-VIS spectroscopy.
ÖZET
SEZYUM, BARYUM VE FENOLÜN YAPISI DEĞ
i
ŞTi
Ri
LMi
Ş HÜMİK ASi
T VE DEMi
R NANOPARÇACIKLARÜZERİNE TUTUNMASININ
i
NCELENMESi
OĞUZHAN ÇELEBİ Kimya Bölümü Yüksek Lisans Tez Yöneticisi : Prof. Dr. Hasan N. Erten
Mayıs 2007
Yüksek çözünürlüğe sahip olan radyoaktif maddelerin sıvı ortamlardan katı ortamlara aktarılarak depolarda tutulması yönünde çok miktarda çalışma yapılmaktadır. Bu sayede yüksek hacme sahip sıvı ortamlardaki radyoaktif maddelerin katı ortama aktarılması amaçlanmaktadır. Bu tür maddelerin çevresel uygulamalarda kullanılmasının yanı sıra bilim ve sanayide yararlı maddelerin üretilmesinde kullanılabilir. 137Cs izotopunun dezenfeksiyon ve radyoterapi gibi medikal uygulamalarda γ kaynağı olarak kullanıldığı bilinmektedir. Benzer şekilde
137Cs izotopu gıda endüstrisinde sterilizasyon kaynağı olarak yararlı bir madde
olduğu kanıtlanmıştır. 137Cs radyoizotopu radyoaktif bölünme sonucu yüksek verimde üretilir, uzun bir yarılanma süresi (30.17 yıl) ve yüksek çözünürlüğe sahip olduğu için radyoaktif atıklarda bulunan başlıca maddedir. Baryum bir toprak alkali elementi olup radyoaktif izotopu olan 140Ba (T1/2 = 12.79 gün) yüksek oranda
(6.21%) açığa çıkan bir radyoaktif bölünme ürünüdür.
Fenolik maddeler içeren atık sular ciddi bir çevre problemi oluşturmaktadırlar. Fenolik maddeler boya, çözücü, petrokimya, kömür vb. sanayilerinden çevreye bırakılmaktadırlar ve kanserojen madde olarak bilinmektedirler. İnsanlar tarafından bir gramdan fazla alındığı durumlarda ölümcül etki yapmaktadırlar. Sıvı bölgelerde yaşayan organizmalar fenolik maddelere maruz kalmalarından ötürü olumsuz yönde etkilenmektedirler.
Toprağın en önemli organik maddesi olan hümik asit, doğal çevrede bulunan organik kalıntıların kimyasal ve fiziksel olarak parçalanmasıyla oluşturulan kimyasal ve fiziksel yönden heterojen bir maddedir. Hümik asitin toprak kimyasında metal iyonlarını ve organik maddeleri tutma, bitkilere mineral taşıma ve toksik maddeleri biyolojik olarak dönüştürmek gibi pek çok fonksiyonu vardır. Demir nanoparçacık teknolojisi artan bir hızla çevre ve zararlı atık uygulamalarında kullanılmaktadır. Önemli bir avantajı ise toprağın alt kısımlarında kalan kirli bölgeye enjeksiyon yöntemiyle rahatlıkla ulaştırılabilmesidir.
Bu çalışma radyoaktif ve fenolik atıkların sıvı ortam içeren çevrelerden uzaklaştırılması yönünde alternatif ve verimli bir yol bulmak için yapılmıştır. Yapısı değiştirilmiş hümik asitler ( çözünmez hale getirilmiş hümik asitin sodyum formu ve yüzey aktif maddelerle değiştirilmiş hümik asit ) ve demir nanoparçacıklar tutucu maddeler olarak kullanılmıştır. Radyoaktif izleme metodu ve UV-VIS spektroskopi tekniği kullanılarak sezyum, baryum iyonları ve fenolün değiştirilmiş hümik asitler ve demir nanoparçaklar üzerine tutunma davranışları incelenmiştir.
Hümik asit ve değiştirilmiş yapılarının karakterizasyonu FTIR, katı hal 13C NMR spektroskopi teknikleri kullanılarak yapılmıştır. Hümik asit üzerinde tutunmadan sorumlu olan karboksilik ve fenolik gruplar potansiyometrik titrasyon metodu kullanarak miktarsal olarak tayin edilmiştir. Demir nanoparçacık örneklerini karakterize etmek için SEM ve PXRD teknikleri kullanılmıştır.
Zaman, konsantrasyon ve sıcaklığın, katyonların ve fenolün hümik asitin değiştirilmiş yapıları ve demir nanoparçacıklar üzerine tutunması üzerine etkisini incelemek için, farklı sıcaklıklarda tutunma çalışmaları ve kinetik çalışmalar yapıldı. Sezyum ve baryum tutunma verilerinin Freundlich ve Dubinin-Radushkevich modellerine, fenol tutunma verilerinin ise Freundlich ve Tempkin modellerine en iyi uyduğu bulunmuştur. Katyon ve tutucu madde tutunma sırası baryum-çözünmez hale getirilmiş hümik asit > sezyum-çözünmez hale getirilmiş hümik asit > baryum-demir nanoparçacıklar şeklindedir. Kinetik çalışmalar her iki katyonun ve fenolün tutunma davranışlarının psödo ikinci derece hız yasasına uyduğunu göstermiştir. Hız sabiti değerleri tutunma sırasıyla ters orantılıdır. Katyon
hale getirilmiş hümik asit > baryum-çözünmez hale getirilmiş hümik asit sırasını takip etmektedir. Fenolün yüzey aktif maddelerle yapısı değiştirilmiş hümik asit üzerine tutunmasının dengeye ulaşma zamanının katyonların çözünmez hale getirilmiş hümik asit üzerine tutunmasının dengeye ulaşma zamanından çok daha fazla olduğu bulunmuştur.
Adsorpsiyon entalpi değişimi, ΔHº, entropi değişimi, ΔSº ve Gibbs serbest enerji değişimi, ΔGº gibi termodinamik değerler farklı sıcaklıklarda elde edilen tutunma verilerinden elde edilen sonuçlar kullanılarak hesaplanmıştır. ΔHº ve ΔSº için elde edilen değerler sezyum iyonlarının çözünmez hale getirilmiş hümik asit üzerine tutunması için 3.673 kJ/mol, 48.85 J/mol.K, baryum iyonlarının çözünmez hale getirilmiş hümik asit üzerine tutunması için 2.102 kJ/mol, 89.522 J/mol.K ve baryum iyonlarının demir nanoparçacıklar üzerine tutunması için 38.5 kJ/mol, -73.98 J/mol.K olarak bulunmuştur. Sıcaklık değişimlerinin, sezyum ve baryum iyonlarının çözünmez hale getirilmiş hümik asit üzerine tutunma eğiliminde çok fazla etki yapmadığı bulunmuştur. Baryum iyonlarının demir nanoparçacıklar üzerine tutunma davranışları ekzotermiktir ve düşük sıcaklıklarda daha fazla katyon tutulduğunu göstermektedir.
Farklı sıcaklıklarda yapılan çalışmalar sonucu elde edilen sonuçları kullanarak yapılan hesaplamalarda bulunan negatif Gibbs serbest enerji değişimi, ΔGº, değerleri bütün adsorpsiyon süreçlerinin kendiliğinden oluştuğunu göstermektedir. Hesaplanan ΔGº değerlerinin tümü, 8-16 kJ/mol değerleri arasında bulunmaktadır. Bu düzeydeki enerjiler, adsorpsiyonun daha çok iyon değişimi yoluyla meydana geldiğini göstermektedir.
Anahtar kelimeler: Adsorpsiyon, İzotermler, Modifiye Edilmiş Hümik asit, Termodinamik Sabitler, Fenol, Kinetik Çalışmalar, Dağılım Oranı, Radyoaktif İzleme Metodu, Sezyum, Baryum, Tekne Tekniği, Karakterizasyon, Demir Nanoparçacıklar, UV-VIS Spektroskopi.
ACKNOWLEDGEMENT
I would like to express my sincere gratitude to my advisor, Prof. Dr. Hasan Erten, for his encouragement and tremendous support throughout my graduate career. I appreciate his patience and confidence in me from the first day. I would like to thank my current committee members, Prof. Dr. Ömer Dağ, Prof. Dr. Hale Göktürk, and Assoc. Prof. Dr. Oğuz Gülseren, Assist. Prof. Dr. Emrah Özensoy, for their valuable time and guidance during my graduate studies at Bilkent University.
I would also like to thank Prof. Dr. Şefik Süzer for his help and guidance during my graduate studies. I would particularly like to thank my undergraduate supervisor Prof.Dr. Yaşar Dürüst for his initiative support and mentorship when I first stepped into the research world. I would like to send my gratitude to my professors at Abant Izzet Baysal and Bilkent Universities who always encouraged and supported me throughout my undergraduate and graduate studies.
I would like to thank my dear colleagues : Muharrem Akcan, Cevher Altuğ, Yaşar Akdoğan, A. Faik Demirörs, Anıl Ağıral, Ünsal Koldemir, Hacı Osman Güvenç, Cemal Albayrak, Yurdanur Türker, Olga Samarskaya, İlknur Tunç, Li Yan, Nesibe Cındır, Burak Tiftik, Hikmet Sezen, Mehtap Küyükoğlu, Korcan Demirok, İlknur Çayırtepe, M.Fatih Genişel, Bora İnci, Eda Özkaraoğlu, Engin Karabudak, Ümit Akbey, Alper Duru and Mehmet Göllü.
I can`t just thank my parents, Selami and Emine Çelebi, and my sister, Dilruba Çelebi, who have always trusted in me and supported me from the first day. I would not have been where I am today without my family.
Finally, my thanks especially go to my best friends, Gürkan Çakır and Haydar Türköz, and roommates, Erkan Okuyan and S. Tuncer Erdoğan, who have made life easier and more fun.
TABLE OF CONTENTS
1. INTRODUCTION
... 11.1- Hazardous Wastes... 1
1.1.1- Radioactive Wastes... 2
1.1.2- Phenolic Wastes ... 4
1.2- The Adsorption Process in Soil Organic Matter ... 5
1.3- Cation Exchange Capacity in Soils... 7
1.4- Radioactive Tracer Method... 9
1.5- The Batch Method... 9
1.6- Gamma Ray Spectroscopy... 10
1.7- UV-Visible Spectroscopy ... 10
1.8- The Present Study ... 11
1.8.1- Humic Acid and Modified Forms ... 11
1.8.2- Iron Nanoparticles... 14
1.8.3- Cations and Their Radioactive Isotopes ... 16
2. EXPERIMENTAL
... 172.1- Isolation, Insolubilization and Surfactant Modification of Humic Acid .... 17
2.2- Quantitative Determination of Adsorption Sites on Humic Acid... 17
2.3- Adsorption Experiments ... 18
2.3.1- Radioactive Tracer Method... 18
2.3.2- Kinetic Studies ... 18
2.3.3- Effect of Loading, Temperature and pH ... 19
2.4 Spectroscopic Characterization of Humic Acid, Its Modified Forms and Iron Nanoparticles and Analysis of Phenol Solutions... 20
2.4.1 Fourier Transform Infrared Spectroscopy... 20
2.4.2 13C CP/MAS Nuclear Magnetic Resonance Spectroscopy... 20
2.4.3 Powder X-Ray Diffraction ... 20
2.4.4 UV-Visible Spectrophotometer... 20
3. RESULTS AND DISCUSSIONS
... 223.1- Characterization of Sorbents... 22
3.1.1- Potantiometric Titration ... 22
3.1.2- Characterization of Humic acid and Its Modified Forms ... 24
3.1.3- Characterization of Iron Nanoparticles... 27
3.2- Radiochemical Sorption Studies ... 29
3.2.1- Kinetic Studies ... 29
3.2.2- Loading and Temperature Studies ... 37
3.2.2.1- Loading Curves... 37
3.2.2.2- Effect of pH... 42
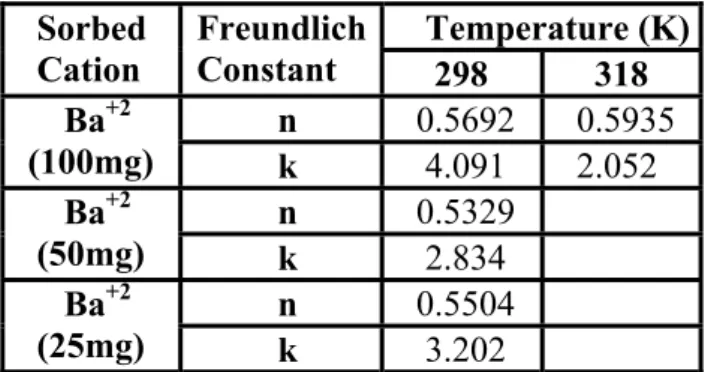
3.2.2.3- Freundlich Isotherm ... 43
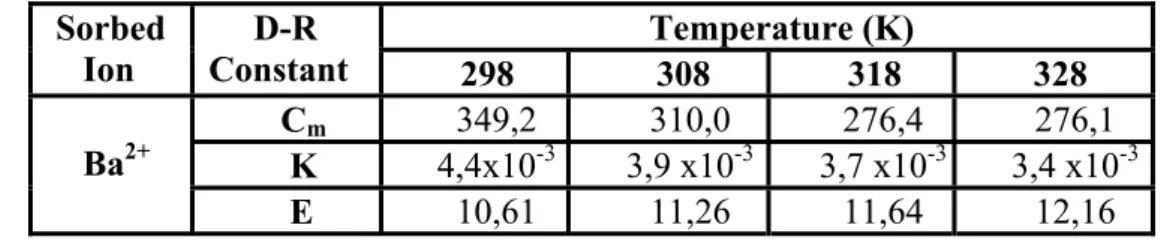
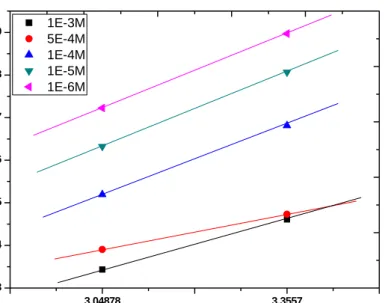
3.2.2.4- Dubinin-Radushkevich (D-R) Isotherms ... 48
3.2.2.5- Thermodynamic Results ... 53
3.2.3- Effect of surfactant modification upon phenol and cation sorption affinity ... 59
3.2.3.1- Sorption studies using UV-VIS spectroscopy... 59
3.2.3.1.1- Kinetic Studies ... 59
3.2.3.1.2- Freundlich and Tempkin isotherms for phenol sorption63 3.2.3.2- Sorption studies of cesium onto surfactant modified insolubilized humic acid... 67
4. CONCLUSION
... 70LIST OF FIGURES
1.1 Scheme of interactions of hazardous wastes in the environment... 1
1.2 Scheme of interactions of hazardous wastes in the anthrosphere ... 2
1.3 Scheme of interactions between nucleus and neutron... 3
1.4 Scheme of development of variable negative charges in a humic molecule by dissociation of protons from carboxyl groups at pH 3.0, and from phenolic-OH groups at pH 9.0. ... 6
1.5 Scheme of interactions between humic acid and a metal cation.. ... 6
1.6 Proposed structures of humic acid ... 12
1.7 Scheme of hydrophobic interactions in surfactant-humic acid system ... 14
1.8 TEM images of iron nanoparticles ... 16
3.1 Potantiometric titration curve of humic acid... 23
3.2 Linearized plot potantiometric titration curve of humic acid using Gran function... 23
3.3 FTIR spectra of humic acid and sodium form of insolubilized humic acid. 25 3.4 13C NMR spectra of humic acid and sodium form of insolubilized humic acid ... 26
3.5 FTIR spectra of sodium form of insolubilized humic acid and surfactant modified insolubilized humic acid ... 26
3.6 XRD Pattern for nano-Fe0 and its oxide form ... 27
3.7 SEM images of iron nanoparticles at different magnifications... 28
3.8 Variation of Rd Values with Shaking time for Cs+ sorption onto sodium form of insolubilized humic acid at 25°C ... 30
3.9 Variation of Rd Values with Shaking time for Ba2+ sorption onto sodium form of insolubilized humic acid at 25°C ... 31
3.10 Variation of Rd Values with Shaking time for Ba2+ sorption on iron nanoparticles at 25°C ... 31
3.11 Variation of t/q Values with Shaking time for Cs+ sorption on sodium form of insolubilized humic acid at 25°C ... 35
3.12 Variation of t/q Values with Shaking time for Ba2+ sorption on sodium form of insolubilized humic acid at 25°C ... 35 3.13 Variation of t/q Values with Shaking time for Ba2+ sorption on iron
nanoparticles at 25°C ... 36 3.14 The loading curves for sorption of Cs+ onto sodium form of insolubilized humic acid at different temperatures... 38 3.15 The loading curves for sorption of Ba2+ onto sodium form of insolubilized humic acid at different temperatures... 38 3.16 The loading curve for sorption of Ba2+ onto iron nanoparticles at 25°C .. 39 3.17 The loading curve for sorption of Ba2+ onto iron nanoparticles at 55°C .. 39 3.18 Effect of pH upon sorption of Ba2+ onto sodium form of insolubilized humic acid ... 42 3.19 Freundlich isotherm plots for the sorption of Cs+ onto sodium form of insolubilized humic acid at various temperatures ... 45 3.20 Freundlich isotherm plots for the sorption of Ba2+ onto sodium form of insolubilized humic acid at various temperatures ... 45 3.21 Freundlich isotherm plots for sorption of Ba2+ onto iron nanoparticles at 25˚C and 55˚C ... 46 3.22 Freundlich isotherm plots for sorption of Ba2+ onto iron nanoparticles at 25˚C with different weights 25mg, 50mg and 100mg ... 46 3.23 Dubinin-Radushkevich isotherm plots for sorption of Cs+ onto sodium form of insolubilized humic acid at various temperatures ... 50 3.24 Dubinin-Radushkevich isotherm plots for sorption of Ba2+ onto sodium form of insolubilized humic acid at various temperatures ... 50 3.25 Dubinin-Radushkevich isotherm plots for sorption of Ba2+ onto iron nanoparticles at 25˚C and 55˚C... 51 3.26 Dubinin-Raduskevich isotherm plots for sorption of Ba2+ onto iron
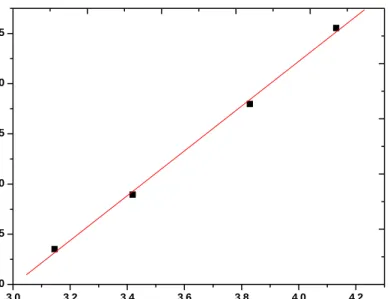
nanoparticles at 25˚C with different weights 25mg, 50mg and 100mg ... 51 3.27 Arrhenius plots for sorption of Cs+ onto sodium form of insolubilized humic acid ... 56 3.28 Arrhenius plots for sorption of Ba2+ onto sodium form of insolubilized humic acid ... 56 3.29 Arrhenius plots for Sorption of Ba2+ onto iron nanoparticles... 57
3.30 UV-Vis absorption spectra of phenol solutions remaining in solution after sorption at different shaking times ... 60 3.31 Variation of Rd values with shaking time for phenol sorption onto
surfactant modified insolubilized humic acid at 25°C ... 61 3.32 Variation of t/q Values with Shaking time for Ba2+ sorption onto
surfactant modified insolubilized humic acid at 25°C ... 61 3.33 Freundlich Isotherm plot for sorption of phenol onto surfactant modified insolubilized humic acid at 25˚C... 64 3.34 Tempkin isotherm plot for sorption of phenol onto surfactant modified insolubilized humic acid at 25˚C... 65 3.35 The loading curve for sorption of Cs+ onto surfactant modified
insolubilized humic acid at 25ºC... 67 3.36 Dubinin-Radushkevich isotherm plot for sorption of Cs+ onto surfactant modified insolubilized humic acid at 25˚C ... 68 3.37 Freundlich isotherm plots for sorption of Cs+ onto surfactant modified insolubilized humic acid at 25˚C... 69
LIST OF TABLES
1.1 Cation Exchange Capacities for a Number of Soil Colloids... 8 3.1 Acidic functional group contents obtained experimentally using potantiometric titration of humic acid ... 24 3.2 The sorption data for the kinetic behavior Cs+ ion on sodium form of
insolubilized humic acid... 32 3.3 The sorption data for the kinetic behavior Ba2+ ion on sodium form of
insolubilized humic acid... 32 3.4 The sorption data for the kinetic behavior Ba2+ ion on iron nanoparticles... 33 3.5 Amount of sorbed cation per gram of sorbent, pseudo second order rate
constants and correlation coefficient values for cesium and barium sorption . 36 3.6 The data of Cs+ sorption onto sodium form of insolubilized humic acid at different temperatures and initial concentrations ... 40 3.7 The data of Ba2+ sorption onto sodium form of insolubilized humic acid at different temperatures and initial concentrations ... 40 3.8 The data of Ba2+ sorption onto iron nanoparticles at different temperatures and initial concentrations ... 41 3.9 Freundlich constants , n and k , obtained from the least square fits of the sorption data of Cs+ onto sodium form of insolubilized humic acid... 47 3.10 Freundlich constants , n and k , obtained from the least square fits of the sorption data of Ba2+ onto sodium form of insolubilized humic acid... 47 3.11 Freundlich constants, n and k, obtained from the least square fits of the
sorption data of Ba2+ onto iron nanoparticles ... 47 3.12 The D-R Isotherm constants obtained from the least square fits for the
sorption data of Cs+ onto sodium form of insolubilized humic acid... 52 3.13 The D-R Isotherm constants obtained from the least square fits for the
sorption data of Ba2+ onto sodium form of insolubilized humic acid... 52 3.14 The D-R Isotherm constants obtained from the least square fits for the
3.15 The average values of the enthalpy change, entropy change and the calculated values of the Gibbs Free Energy change obtained at different temperatures for the sorption case of Cs+ onto sodium form of insolubilized humic acid 57 3.16 The average values of the enthalpy change, entropy change and the calculated values of the Gibbs Free Energy change obtained at different temperatures for the sorption case of Ba2+ onto sodium form of insolubilized humic acid... 58 3.17 The average values of the enthalpy change, entropy change and the calculated values of the Gibbs Free Energy change obtained at different temperatures for the sorption case of Ba2+ onto iron nanoparticles ... 58 3.18 The kinetic data of phenol sorption onto surfactant modified insolubilized humic acid at different times at 25ºC ... 62 3.19 Amount of sorbed phenol per gram of sorbent, pseudo second order rate constant and correlation coefficient value for phenol sorption ... 62 3.20 Freundlich constants , n and k , obtained from the least square fits of the sorption data of phenol onto surfactant modified insolubilized humic acid .. 64 3.21 Tempkin isotherm constants obtained from the least square fits of the
sorption data of phenol onto surfactant modified insolubilized humic acid. 65 3.22 The data of phenol sorption onto surfactant modified insolubilized humic acid at 25ºC and initial concentrations... 66 3.23 The D-R Isotherm constants obtained from the least square fits for the
sorption data of Cs+ onto surfactant modified insolubilized humic acid... 68 3.24 Freundlich constants , n and k , obtained from the least square fits of the sorption data of Cs+ onto surfactant modified insolubilized humic acid ... 69
1. INTRODUCTION
1.1- Hazardous Wastes
A hazardous substance is a material that may pose a danger to living organisms, materials, structures or environment. Hazardous waste is a hazardous substance that has been discarded, abandoned, neglected, released or designated as a waste material, or one that might interact with other substances to be hazardous.
Many specific chemicals in widespread use are hazardous because of their chemical reactivities, fire hazards, toxicities, and other properties. There are numerous kinds of hazardous substances, usually consisting of mixtures of specific chemicals. These include such things as explosives; flammable liquids and solids, oxidizing materials, corrosive materials, and radioactive materials.
Hazardous materials almost always originate in the anthrosphere – which is part of the environment that is made or modified by humans for use in human activities- are often discarded into the geosphere, and are frequently transported through the hydrosphere or the atmosphere. The greatest concern for their effects is usually on the biosphere, particularly human beings. Figures (1.1 and 1.2) summarize these relationships.1
Fig. 1.2: Scheme of interactions of hazardous wastes in the anthrosphere1
1.1.1- Radioactive Wastes
The massive production of radionuclides (radioactive isotopes) by weapons and nuclear reactors since World War II has been accompanied by increasing concern about the effects of radioactivity upon health and the environment. Radionuclides are produced as fission products of heavy nuclei of such elements as uranium or plutonium. They are also produced by the reaction of neutrons with stable nuclei. These phenomena are illustrated in Fig. 1.3. Radionuclides are formed in large quantities as waste products in nuclear power generation. Their ultimate disposal is a problem that has caused much controversy regarding the widespread use of nuclear power. Artificially produced radionuclides are also widely used in industrial and medical applications, particularly as “tracers.” With so many possible sources of radionuclides, it is impossible to entirely eliminate radioactive contamination of aquatic systems. Furthermore, radionuclides may enter aquatic systems from natural sources. Therefore, the transport, reactions, and biological concentration of radionuclides in aquatic ecosystems are of great importance to the environmental chemist.
Fig. 1.3: Scheme of interactions between nucleus and neutron
Radiation damages living organisms by initiating harmful chemical reactions in tissues. For example, bonds are broken in the macromolecules that carry out life processes. In cases of acute radiation poisoning, bone marrow that produces red blood cells is destroyed and the concentration of red blood cells is diminished. Radiation-induced genetic damage is of great concern. Such damage may not become apparent until many years after exposure. As humans have learned more about the effects of ionizing radiation, the dosage level considered to be safe has steadily diminished.
The study of the ecological and health effects of radionuclides involves consideration of many factors. Among these are the type and energy of radiation emitted and the half-life of the source. In addition, the degree to which the particular element is absorbed by living species and the chemical interactions and transport of the element in aquatic ecosystems are important factors. Radionuclides with intermediate half-lives are the most dangerous. They persist long enough to enter living systems while still retaining a high activity. Because they may be incorporated within living tissue, radionuclides of life elements are particularly dangerous.1
Many alternatives for radioactive waste treatment have been investigated and some of them have been applied successfully in the waste treatment plants.
However, no method is universally applicable and the adoption of any treatment technique for a given type of waste will depend on efficiency of the method, characteristics of the waste, availability of the material and economical consideration.2
There is an increasing effort for removing highly soluble radiocontaminants from high volume aqueous waste streams by fixing them onto solid waste forms that can be disposed of in a repository. In this way, the high-volume aqueous streams are transformed from a high-level radioactive waste into a low-level radioactive waste that is much cheaper to treat. However, the removal of this species may not only serve environmental initiatives, but it may also serve as a means of producing useful materials for use in science and industry. It is known, for example, that 137Cs is an excellent γ source for medical applications such as instrument disinfection and radiotherapy. Similarly, 137Cs has also proven to be useful as source for sterilization in the food industry.3 The overall objective of radioactive waste disposal is to dispose the wastes in a manner which ensures that there is no unacceptable detriment to man and to the biological environment, as a whole at present and in the future. Waste confinement by the disposal system should remain effective until the radionuclides have decayed to acceptable levels, and are no longer forming a potential hazard to the human environment.4
1.1.2- Phenolic Wastes
Wastewaters containing phenolic compounds present a serious environmental problem. Phenolic compounds are present in the wastewater generated from paint, solvent, petroleum (petrochemical), coal conversion, pharmaceutical, wood preserving chemicals- plastic, rubber-proofing, pesticide, iron-steel, phenol-production, paper and pulp industries. Phenolic substances are known carcinogenic substances and concentrations greater than 50 ppb are harmful to some aquatic species and ingestion of 1 g can be fatal in humans therefore phenol removal from waters is an important practical problem.
Current methods for removing phenols and their derivatives from wastewater include microbial degradation, adsorption on sorbents, biosorption, chemical oxidation, deep-well injection, incineration, solvent extraction and irradiation.5,6
1.2- The Adsorption Process in Soil Organic Matter
Adsorption is a general term that refers to the disappearance of solutes from solution with the presumption of adsorption on a solid phase. Adsorption is the accumulation at the solid-solution interface, and may result from either physical, electrostatic or chemical interactions with the surface. Physical and electrostatic types of adsorptions form relatively weak bonds to the surface whose characteristic energies are 4.2-8.4 kJ/mol and 8-16 kJ/mol, respectively, while chemical adsorption is a stronger interaction which involves ionic or covalent bonding whose characteristic energy is 100-500 kj/mol. Adsorption refers to attraction and bonding onto a surface, while absorption is a process in which the solute is taken up into a structure. In some cases the distinction is difficult and the generic term sorption has been used. Operationally, sorption is determined by the extent of solute removal from solution in either batch studies or in leaching studies with columns of adsorptive materials.7
Adsorption is dependent not only on the surface charge, but also on the surface area. The amount of material adsorbed is directly proportional to the specific surface. Adsorption is small if the surface area is small, and increases with increased surface areas. Small surface area, together with its low cation exchange capacity, are the reasons for a low adsorption capacity.
Soils have the capacity to adsorb gas, liquid and solid constituents. Cation exchange reactions, complex reactions between metal ions, and inorganic and organic colloids are additional implications of the electrochemical behavior of soil colloids. The physico-chemical properties of soils are attributed to soil constituents with highly reactive surfaces and large surface areas, e.g., soil organic and
inorganic colloids. Therefore, this colloidal fraction plays a dominant role in adsorption phenomena.
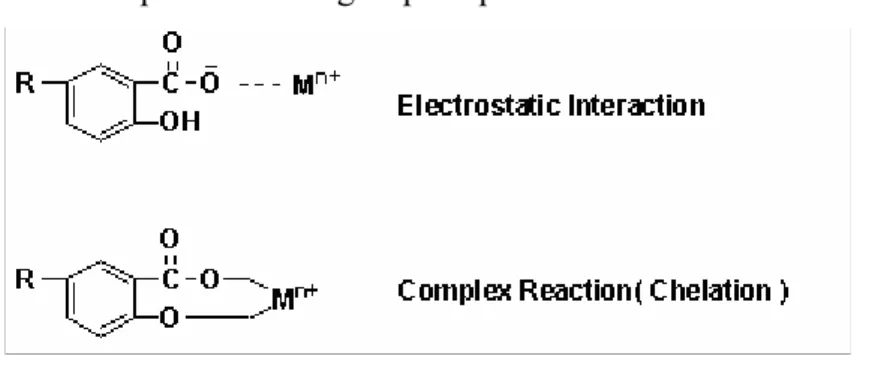
Adsorption reactions take place at the surfaces of soil colloids. In the case of the organic colloids, e.g., humic matter, adsorption is related to reactions with their functional groups, such as carboxyl groups, and phenolic hydroxyl groups. The carboxyl group starts to dissociate its proton around pH 3.0, and the humic molecule becomes electronegatively charged (Fig. 1.4). At pH < 3.0, the charge is very small, or even zero. At pH 9.0, the phenolic-OH group also starts to dissociate, and the molecule attains a high negative charge. Since the development of negative charges is pH dependent, this charge is called pH-dependent charge. A number of reactions or interactions can take place because of the presence of these charges. At low pH values, the humic molecule is capable of attracting cations, which leads to cation exchange reactions. At high pH values, when the phenolic -OH groups are also dissociated, complex reactions and chelation between metals and the humic molecule are of importance (Fig. 1.5).
Fig. 1.4: Development of variable negative charges in a humic molecule by dissociation of protons from carboxyl groups at pH 3.0, and from phenolic-OH groups at pH 9.0.8
Fig. 1.5 Scheme of interactions between humic acid and a metal cation. M n+ = cation with charge n+; R = remainder of humic acid molecule.8
The density of ion population is greatest at or near the surface. These cations are called adsorbed cations. Different rates and orders of adsorption are known among the cations, since the adsorption reaction depends on the surface potential, valence, and hydrated radius. As surface potential increases, more of the divalent ions will be adsorbed. Trivalent cations would even be more strongly concentrated on the surface exhibiting high surface potential values. When a mixture of monovalent and divalent ions are present in a soil solution, adsorption is usually shifted in favor of the divalent ions. Specific adsorption of cations is also affected by the hydrated radius. The crystalline radius, on the other hand, plays only a minor role. Generally, ions with smaller hydrated sizes are preferably adsorbed as compared to ions with larger hydrated sizes. The following is the decreasing order of preference for adsorption of monovalent cations by clays:
Cs+ > Rb+ > K+ > Na+ > Li+
The rate of adsorption for Cs is the highest, because Cs is the smallest in hydrated size. The ion has a thin hydration shell, which makes a close approach to the surface possible. Lithium, on the other hand, has the largest hydrated radius in this series. Its thick hydration shell increases the distance from the ion to the clay surface.8
1.3- Cation Exchange Capacity in Soils
The process in which cations from solutions are sorbed by mineral particles with the concurrent release of an equivalent amount of cations is termed as cation exchange process. Cation exchange capacity (CEC) of a soil is defined as the capacity of soils to adsorp and exchange cations. Scientifically, it is related to the surface area and surface charge. CEC is commonly determined by extraction of the cations from soils with a solution containing a known cation for exchange. The results, expressed in milliequivalents per 100 grams of soils are taken as the CEC of soils. The values for CEC may vary considerably, depending on the concept used of
CEC, methods of analysis, type of colloids, and amount of colloids. On the average the CEC of the major soil colloids is as follows:
The affinity of a certain cation, M+, for an exchange site is affected by several factors such as:
1- Concentration in solution: As [Mn+] increases, there is an increase in the fractional surface coverage.
2- Oxidation state: An increase in the oxidation state of an element favors its accumulation at the surface, the order of affinity being:
M
3+> M
2+> M
+3- Charge density of the hydrated cation: the greater the charge density, the greater is the affinity for an exchange site.
Table 1.1 Cation Exchange Capacities for a Number of Soil Colloids
Adsorption and cation exchange are of great practical significance in nutrient uptake by plants, soil fertility, nutrient retention, and fertilizer application. Its importance has increased considerably today by an increased awareness of its beneficial effect in environmental issues. It is realized now that cation exchange has the capacity in intercepting toxic metals and organic compounds reaching the groundwater and preventing pollution of streams and lakes.4, 8
Soil Colloids CEC (mEq/100g)
Humus (Humic matter) 200
Vermiculite 100-150 Smectite 70-95
Illite 10-40 Kaolinite 3-15
1.4- Radioactive Tracer Method
The radioactive tracer method is one of the most useful techniques in radiochemistry which finds applications in many of the branches of sciences such as biological, medical, geological and environmental studies. The fundamental principle of the radioactive tracers is that the chemical behavior of radioactive isotopes is identical with that of their stable isotopes in any chemical process. The effect of radiation emitted by the radioactive tracers on a chemical or biological system under study is also usually negligible. The amount of a radioactive tracer necessary for an experiment is normally so small that no detectable radiolysis occurs in the system.9
The tracer method consists of the introduction of a small amount of a radionuclide and the observation of its progress as time goes on during sorption study. The decrease in the radionuclide concentration in solution is attributed to its sorption by the sorbent.
1.5- The Batch Method
The batch method is one of the most used technique in sorption studies. In a batch operation, the adsorbent is contacted with the liquid phase in a container for a period of time. The adsorbent is separated from the liquid by centrifugation, filtration or settling. The time required to approach equilibrium condition depends on the concentration of solute, amount of solid, the particle size of adsorbent and the degree of shaking.
For batch operations, adsorbent is usually applied in powdered form to increase the surface area and reduce the diffusional resistance inside the pores. Agitation of the suspension improves contact of particles with liquid and decreases the mass transfer resistance at the surface4.
1.6- Gamma Ray Spectroscopy
Gamma spectroscopy is a radiochemical measurement method and a gamma spectrometer determine the energy and the count rate of gamma rays emitted by radioactive substances. In investigating a radioactive source, one generally finds gamma lines of various energies and intensities; the result is called a gamma energy spectrum. A detailed analysis of this spectrum is used to determine the identity and quantity of gamma emitters present in the source. The gamma spectrum is characteristic of the gamma emitting nuclides contained in the source, just as in optical spectroscopy, the optical spectrum is the characteristic of the atoms and molecules contained in the probe.
The equipment used in gamma spectroscopy includes an energy sensitive particle detector, a pulse sorter (multichannel analyzer), and associated amplifiers and data readout devices. The detector is often a sodium iodide (NaI) scintillation counter or a high purity germanium detector.10
1.7- UV-Visible Spectroscopy
Ultraviolet-visible spectroscopy uses light in the visible, adjacent near ultraviolet (UV) and near infrared ranges. In this region of energy space molecules undergo electronic transitions. UV-Visible spectroscopy is routinely used in the quantitative determination of solutions of transition metal ions and highly conjugated organic compounds.
The Beer-Lambert law states that the absorbance of a solution is due to the solution's concentration. Thus UV-Visible spectroscopy can be used to determine the concentration of a solution. It is necessary to know how quickly the absorbance changes with concentration. This can be taken from references (tables of molar extinction coefficients), or more accurately, determined from a calibration curve.
The method is most often used in a quantitative way to determine concentrations of an absorbing species in solution, using the Beer-Lambert law:
c . b . ) I / I ( log A=− 10 0 =ε
where A is the measured absorbance, I0 is the intensity of the incident light at a
given wavelength, I is the transmitted intensity, b the pathlength through the sample, and c the concentration of the absorbing species. For each species and wavelength, ε is a constant known as the molar absorptivity or extinction coefficient. This constant is a fundamental molecular property in a given solvent, at a particular temperature and pressure.11
1.8- The Present Study
In the present study, the adsorption behaviors of two important fission product radionuclides (137Cs and 133Ba) onto sodium form of insolubilized humic acid and iron nanoparticles were investigated as a function of time, cation concentration and temperature utilizing radioactive tracer method and a similar study was carried out for the adsorption behavior of phenol onto surfactant modified humic acid.
1.8.1- Humic Acid and Modified Forms
Humic substances are the most abundant reservoir of carbon on earth and perform various roles in soil chemistry. They act as soil stabilizers, nutrient and water reservoirs for plants, sorbents for toxic metal ions, radionuclides and organic pollutants, stimulate plant growth and biotransform toxic pollutants. When leached into surface waters, they also play a pivotal role in the aquatic environment. For example, they bind and transport metal ions.12
Early efforts to characterize this material resulted in the following fractionation scheme based on solubility under acidic or alkaline conditions: humin, the insoluble fraction of humic substances; humic acid, the fraction soluble under alkaline conditions but not acidic conditions (generally pH< 3); and fulvic acid, the fraction soluble under all pH conditions. Although chemical and physical differences do underlie these variations in solubility, the separation of humic
substances into three fractions is operational, and does not indicate, for example, the existence of three distinct types of organic molecule.
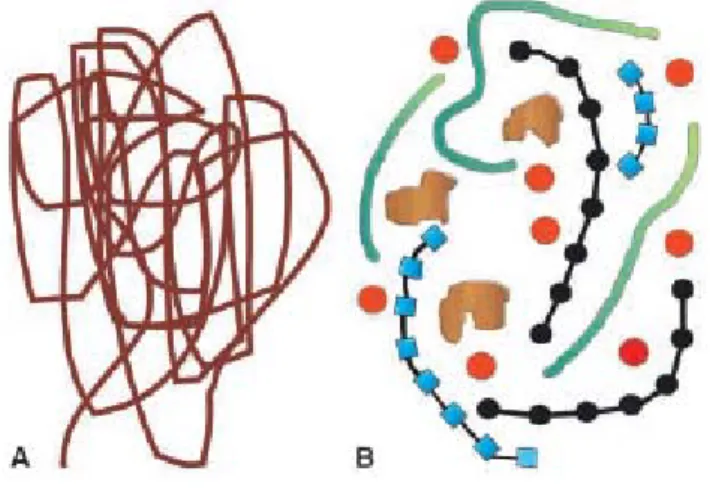
Early concepts, based on the developing field of polymer science assumed that humic substances comprised of randomly coiled macromolecules as shown in Fig. 1.6 that had elongated shapes in basic or low-ionic strength solutions, but became coils in acidic or high-ionic strength solutions.
However, recent information gathered using spectroscopic, microscopic, pyrolysis, and soft ionization techniques is not consistent with the “polymer model” of humic substances. A new concept of humic substances has thus emerged, that of the supramolecular association, in which many relatively small and chemically diverse organic molecules form clusters linked by hydrogen bonds and hydrophobic interactions (Fig. 1.6). A corollary to this model is the concept of micellar structure, i.e., an arrangement of organic molecules in aqueous solution to form hydrophilic exterior regions shielding hydrophobic interiors from contact with vicinal water molecules.13
Fig. 1.6: A Depiction of the traditional concept of humic substances as randomly coiled macromolecules. B A new concept that the major components found in soil humic substances are in fact of relatively low molecular weight (<2,000 Da) and associate in the presence of metals to form an aggregate. The red spheres represent generic metal cations, the black units polysaccharides, the blue units polypeptides, the green units aliphatic chains, and the brown units aromatic lignin fragments.14
It is important to note that humic materials are complex mixtures of many components, which vary in ratio and structure with sample origin and extraction procedure. Therefore this concept should only be considered as an example of a humic aggregate that is not definitive. While aggregates will likely be “held together” through a complex combination of hydrophobic associations, charge interactions, hydrogen bonds, and metal bridging.
Humic acid is known as the insoluble fraction below pH<3 in aqueous media. This makes humic acid an inappropriate sorbent for traditional operations such as adsorption and recovery of metal ions in aqueous media. The solubility of humic acid in aqueous media depends on the number of –COOH and –OH groups present on humic acid on a large scale and with increasing content of these groups solubility increases. These groups also give humic acid the ability to interact with metal ions through adsorption, ion-exchange, and complexation mechanisms. However, the high solubility of humic acid in aqueous media is a limiting problem for taking advantage of the interaction ability of humic acid (as a solid phase) with metal ions. Accordingly, it is not advisable to use untreated humic acid as a sorbent in aqueous media, so an appropriate treatment of humic acid is needed.15
The process developed by Seki and Suzuki16 is called “insolubilization of humic acid” and with this method humic acid can be converted to a form which is insoluble up to pH 10 in aqueous media.
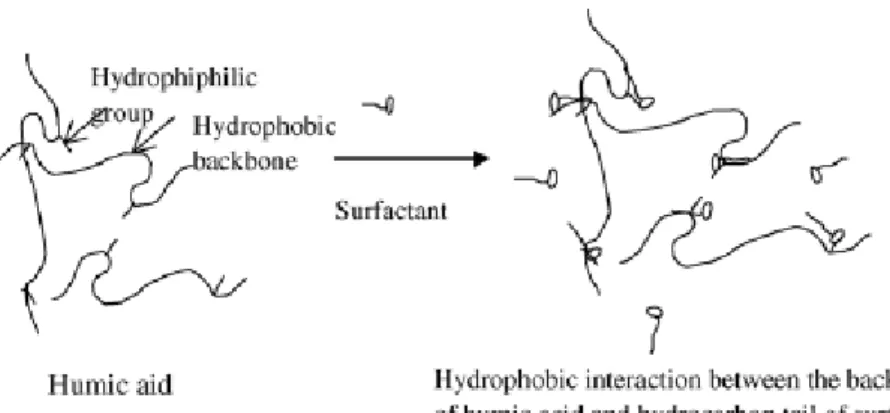
Insolubilized humic acid has a negatively charged surface, therefore it is not a good sorbent for polar organic contaminants. Therefore a treatment is required to adsorb these type of compounds onto humic acid. It has been well recognized that ionic surfactants are cooperatively bound to polyelectrolytes with opposite charges. Insolubilized humic acid as a polyelectrolyte make strong interactions with cationic surfactants.
The electrostatic interaction between cationic head group of surfactant and anionic sites of humic acid is not the only driving force in the binding of surfactant. It is proposed that there are additional hydrophobic interaction between
Fig. 1.7: Schematic representation of hydrophobic interactions in surfactant- humic acid system17
1.8.2- Iron Nanoparticles
Iron nanoparticle technology is increasingly being used in the environmental remediation and hazardous waste treatment. Nanoscale iron particles are effective for the transformation of a wide array of environmental contaminants such as chlorinated organic contaminants, organic dyes, and various inorganic compounds. Moreover, two potential advantages of nano-sized Fe° used in conventional permeable reactive barriers (PRBs) are that nanoparticles may be delivered to deep contamination zones by injection and that nano-sized Fe° may be more effective at degrading some contaminants than granular iron.
Reactivity of nano-Fe° suspensions can persist for at least 6-8 weeks. One reason that nano-sized Fe° particles might exhibit great rates of reaction with contaminants is simply that their large specific surface areas provide more sites on which reaction occurs. Other possible reasons why nano-Fe° might exhibit enhanced reactivity include higher density of reactive surface sites and greater intrinsic reactivity of surface sites.
Zerovalent iron (ZVI), due to its relatively low standard potential, is an inexpensive, efficient, and environmentally friendly electron donor:
Fe → Fe 2+ + 2e- E0ox= -0.41 V
Fe2+ → Fe 3+ + e- E0
ox= -0.771 V
Ferrous iron, Fe2+, can further donate an additional electron and be oxidized to ferric iron, Fe3+. Many environmental contaminants serve as the ultimate electron acceptors. The dechlorination of chlorinated organic solvents such as tetrachloro- ethenes serve as a good example:
RCl + H+ + 2e- → RH + Cl-
It is also known that, in water, iron reacts with water and forms a layer of oxyhydroxide:
Fe(s) + 2H2O(aq) → FeOOH(s) + 1.5H2(g)
Nanoparticles containing Fe° must be surrounded by some type of passivating layers such as a shell of oxides under environmental conditions (Fig. 1.8). Little work has been done to examine the sorption properties of zero valent iron. Specifically, the potential synergy of sorption and reduction has not been explored at all. The dual properties of sorption and reduction may yield new and unique applications of iron nanoparticles for contaminant separation and transformation.18,19
Fig 1.8: TEM images of iron nanoparticles19
1.8.3- Cations and Their Radioactive Isotopes
Barium is an alkaline earth element, radioactive isotope 140Ba (T
1/2 = 12.79d)
is a fission product with a high yield (6.21%). This radionuclide is a serious radiocontaminant, furthermore being a homologue of Ra, Ba2+ is a suitable cation
for the radiochemical study of Ra2+, which have several radioisotopes that are important in radioactive waste considerations. 133Ba2+ was chosen as a radiotracer in our studies because of its long half-life (T1/2 = 10.7 y) and a γ-ray at 356 keV
energy.20
The radionuclide 137Cs is produced in high yield (3-7% fission yield) during the fission process and due to its long half-life (T1/2 = 30.17 y) and its high solubility
in the aqueous media, it is a principal radiocontaminant in radioactive wastes.21 It is widely used in tracer studies and a well-known gamma ray source.
2. EXPERIMENTAL
2.1- Isolation, Insolubilization and Surfactant Modification of Humic Acid
Humic acid was isolated from soil sample taken from Niğde (Bor) region by the following procedure; The soil sample was stirred in 1% NaOH solution for 1h and subsequently centrifuged at 5000 rpm. The dissolved fraction was taken and adjusted to pH 2 with HCl, stirred for 4h and subsequently centrifuged at 5000 rpm. The resulting precipitate was taken and this procedure was repeated two more times. The precipitate was rinsed with deionized water many times to remove chloride ions. After dechlorination step, humic acid was dried at 95 °C for 4h.
Humic acid was insolubilized by heating in a temperature controlled oven at 330°C for 1.5h and insolubilized humic acid (IHA) was converted to its sodium form (INaA) by stirring IHA in a 1M NaNO3 solution for 2 days to exchange the
acidic hydrogens with sodium ions, the resulting solid phase was dried at 80°C. One hundred milliliters of concentrated cetyltrimethylammonium chloride solution was placed in a flask and 5 g of sodium form of insolubilized humic acid (INaA) added. The dispersions were shaken at room temperature by a mechanic shaker for 60 h, followed by washing with distilled water. The surfactant modified insolubilized humic acid (SMIA) was dried at 50 ˚C in an oven.
2.2- Quantitative Determination of Adsorption Sites on Humic Acid
Adsorption sites ( carboxylic and phenolic groups ) were determined quantitatively by using potantiometric titration method. Titration was carried out from pH 3.5 to 10.58 using 0.1M NaOH solution as titrant. Analyte was containing 50 ml suspension of humic acid (576 mg/l). This value was also used by other studies42. Nitrogen gas was passed through the solution until the end of titration in order to prevent CO2 interference. The resulting data was linearized by using the
appropriate Gran functions22. The total acidity value was taken to be the sum of carboxylic and phenolic acidities.
2.3- Adsorption Experiments 2.3.1- Radioactive Tracer Method
The batch method was applied throughout the study. The tracers used in sorption experiments were 137Cs (T1/2 = 30.17 y) and 133Ba (T1/2 = 10.7 y). 1 L of
stable isotope solutions were spiked with ˜ 400μL of the corresponding radionuclide solutions. The initial count rates were measured for 2.5 ml aliquots of cesium and barium solutions using the prominent γ rays of 662 and 361 keV, respectively. Initial acitivity was adjusted not to be lower than 10000 (cps)/ml.
A NaI(Tl) detector was used during radioactivity measurements of the samples. All the experiments were performed in duplicates. In order to check any loss in the activity originating from adsorption on the inside wall of tubes, blank experiments were performed using solutions without adsorbent. The results showed that adsorption onto the tube walls was negligible.
2.3.2- Kinetic Studies
Kinetic and equilibrium experiments were carried out using the batch equilibrium technique. To each of a set of 5 g sodium form of insolubilized humic acid (INaA) samples placed in tubes, 7.5 ml of cesium solution (prepared from CsCl salt) containing an appropriate amount of 137Cs radiotracer was added. The initial concentration of the solution was 1x10⁻⁴ M. The samples were shaken in a temperature-controlled shaking water bath at room temperature for periods ranging from 5 minutes to 48 hours at 200 rpm. They were centrifuged and 2.5 ml portions of the liquid phases were counted to determine their activities. The same procedure was applied for barium sorption studies using 10 mg INaA and 9 ml of Ba2+ solution ( prepared from BaCl2 salt ) having an appropriate amount of 133Ba
radiotracer. When iron nanoparticles were used as a sorbent, 100 mg of sorbent and 10 ml of Ba2+ solution with the same initial concentration were shaken at room temperature from 5 minutes to 24 hours. Resulting solutions were centrifuged and 4 ml portions of the liquid phases were counted.
During phenol sorption studies to surfactant modified insolubilized humic acid (SMIA), in order to evaluate kinetic data, separate tubes containing 50 mg SMIA and 8 ml of 20 mgL-1 phenol solution were prepared. The samples were shaken at room temperature for periods ranging from 1 hour to 72 hours. After centrifugation, absorbance measurements of liquid phases were carried out at 270 nm using UV-VIS spectrophotometer. Absorbance data were converted into concentration using calibration relations pre-determined at the wavelength of maximum absorbance for each phenol sample.
2.3.3- Effect of Loading, Temperature and pH
Loading experiments were carried out to investigate the effect of initial cation concentrations on sorption at four different temperatures; 15°C, 25°C, 35°C, 45°C and at the initial concetrations of 1x10⁻² ,5x10-4 ,1x10-4 ,1x10-5 ,5x10-6 (mmol/ml) for Cs+ sorption onto INaA. In the case of Ba2+ sorption onto INaA, the temperature range was between 25°C and 55°C. Concentrations used were 1x10⁻⁴, 1x10⁻⁵ ,5x10-6 ,1x10-6 (mmol/ml). For the study of Ba2+ sorption onto iron nanoparticles, the same procedure was applied as above with the initial concentrations of 1x10⁻³, 5x10⁻⁴, 1x10⁻⁴, 1x10⁻⁵, 1x10⁻⁶ (mmol/ml) at 25°C and 55°C. Samples were prepared as in the case of kinetic experiments, but all concentrations were used instead of only 1x10⁻⁴ M. The effect of pH upon sorption of Ba2+ onto INaA was investigated at a fixed concentration of 1x10⁻⁵ M and room temperature with varying pH values ranging from 1.5 to 8. The samples were shaken, centrifuged and portions of the liquid phase were counted. Shaking was done in a temperature controlled environment using a Nuve ST 402 water bath shaker equipped with microprocessor thermostat. The fluctuation in controlled temperature was ± 1°C.
In the case of phenol sorption onto SMIA, at 25°C adsorption isotherm experiment, the same amount of sorbent and sorbate (as given in the kinetic part) were used in the concentration range from 20mgL-1 to 80mgL-1. The solution and sorbent were separated by centrifugation and analyzed for determining the remaining concentration of phenol in solution using UV–Visible spectrophotometer at 270 nm.
To compare the sorption behavior of SMIA with INaA towards cations, sorption behavior of cesium onto SMIA was studied at the initial concetrations of 5x10⁻⁴, 1x10⁻⁴, 1x10⁻⁵, 5x10⁻⁶ (mmol/ml) at 25ºC.
2.4 Spectroscopic Characterization of Humic Acid, Its Modified Forms and Iron Nanoparticles and Analysis of Phenol Solutions
2.4.1 Fourier Transform Infrared Spectroscopy
FT-IR spectra were recorded using a Bruker Tensor 27 FTIR spectrometer with a standard high sensitivity DLATGS detector, with a resolution of 4 cm-1 and 64 scans, The KBr pellets were obtained by pressing a mixture of 1:100 ratio of humic acid samples and KBr, respectively.
2.4.2 13C CP/MAS Nuclear Magnetic Resonance Spectroscopy
Solid-state 13C NMR spectra were obtained at the 13C resonance frequency of 125.721 MHz on a Bruker Avance ASX 500 spectrometer, equipped with a double resonance HX probe.The samples were confined in a zirconium oxide rotor with an external diameter of 2.5 mm. The Cross-Polarization Magic Angle Spinning CPMAS technique was applied with a contact time of 1 ms, a spinning speed of 15 kHz MAS and a pulse delay of 2 s.
2.4.3 Powder X-Ray Diffraction
To examine the effect of barium solution on iron nanoparticle surface, XRD technique was used. The XRD patterns were obtained on a Rigaku Miniflex diffractometer using a high-power Cu Kά source operating at 30 kV/15 mA.
2.4.4 UV-Visible Spectrophotometer
UV-Vis spectra were recorded using a Varian Cary 5 double beam
spectrophotometer over a wavelength range between 300 and 200 nm in absorbance mode with 100 nm min-1 speed.
2.4.5 Scanning Electron Microscope
The iron nanoparticle samples were analyzed using a Philips XL-30S FEG type SEM/EDS instrument at different magnifications.
3. RESULTS AND DISCUSSIONS
3.1- Characterization of Sorbents
Fourier transform infrared (FTIR) and solid state 13C MAS-NMR and spectroscopic techniques were used to study the structural changes during humic acid (HA) modification. Potantiometric titration method was used to determine acidic functional groups of humic acid quantitatively. Iron nanoparticles were characterized using powder X-ray diffraction (PXRD) and scanning electron microscope (SEM) techniques.
3.1.1- Potantiometric Titration
To quantify the acidic functional ( carboxylic and phenolic ) groups, potantiometric titration method was used. It is usual to plot the differential curves, ΔpH
/
ΔV or ΔE/
ΔV against volume of titrant added, but when the titration curve is not symmetrical about the equivalence point, as in our case shown in Fig. 3.1, it is possible to obtain erroneous results. Therefore, G.Gran22 developed mathematical expressions to linearize various titration curves. In our data treatment, we chose the following equation, assuming humic acid as a polymeric acid and titration type as weak acid-strong base titration.Gran Function (G) =Vx10 pH−k (1)
Where V represents the amount of titrant used (ml) and k is an arbitrary constant with a value such that the Gran function value will fall in a suitable range such as 0 to 100-1000.
After conversion of the potantiometric titration data to linearized form using Gran functions, two associated lines were obtained as shown in Fig. 3.2. The intersection of the first line gives the amount of base needed to neutralize carboxylic acid groups and the second intersection point is the amount of total base
which is required to neutralize all acidic functional groups. The difference is the amount of base which is required to neutralize phenolic groups. The following quantitative acidic functional group and total acidity values obtained are given in Table 3.1. 0,0 0,5 1,0 1,5 2,0 2,5 3 4 5 6 7 8 9 10 11 PH Volume of NaOH (ml)
Fig. 3.1: Potantiometric titration curve of humic acid used in our experiment
0,0 0,5 1,0 1,5 2,0 2,5 0,0 0,2 0,4 0,6 0,8 1,0 1,2 1,4 1,6 Volume of NaOH(ml) Gran Function, G
Fig. 3.2: Linearized plot potantiometric titration curve of humic acid using Gran function.
Table 3.1. Acidic functional group contents obtained experimentally using potantiometric titration (meq/100g) of humic acid.
-COOH -C6H5OH Total Acidity 249.0 190.0 439.0
3.1.2- Characterization of Humic acid and Its Modified Forms
FTIR spectroscopic technique was used to examine the structural changes after insolubilization of humic acid.The peaks and corresponding functional groups in FTIR spectra shown in Fig.3.3 are as follows; a broad band at 3387 cm-1 primarily corresponds to O-H strectching and secondarily to N-H stretching, the peak at 3071 cm-1 represents stretching of aromatic C-H, absorption bands at 2928 and 2857 cm-1 are attributed to aliphatic C–H stretching in CH2 and CH3,
respectively, Broad bands at 2500 cm-1 is overtone from carboxylic groups stretching (2 x 1246 cm-1) and at 2000 cm-1 is overtone from C–O polysaccharides stretching mode (2 x 1060 cm-1), Strong absorption band at 1704 cm-1 is due to C=O stretching of carboxylic acid and ketone. Absorption bands at 1602 cm-1 and 1372 cm-1 are ascribed to stretching of carboxylate ion and the peak at 1602 cm-1 can also be attributed to structural vibrations of aromatic C=C bonds , the peak at 1222 cm-1 represents C-O stretching in phenols and O–H deformation of COOH. Absorptions from deformation of aliphatic C–H and, H-bonded C=O of conjugated ketones occurs at 1448 cm-1, the band at 1033 cm-1 represents C-O stretching of
polysaccharides23,24,25.
The 13C spectra of humic acid (HA) and insolubilized humic acid (INaA) shown in Fig. 3.4 include following peaks: alkyl carbons and O-alkyl carbons ( aminoacids and carbons adjacent to ester/ether/hydroxyl) (0-60ppm), because that peak was not well resolved we observe those two groups in a broad band; (110-145) ppm is assigned to aromatic carbon, the peak at (150-190) ppm include phenolic and carboxylic carbons26,27,28.
When we examine FTIR and 13C NMR spectra of HA and INaA, we observe that there is a decrease at the intensities of aliphatic alkyl groups, -COOH group and phenolic groups, the effect causing insolubilization is mainly due to loss in carboxyl groups, but as we see on spectrum, all of the adsorption sites are not lost during insolubilization. In the literature16, it was found by titration methods that the lost in percentage of acidic functional groups is nearly 25%. By this way, the ability of HA to make hydrogen bonding decreased and that caused the insolubilization of HA in water at high pH values. It is also clear from the 13C NMR spectra that aromatic part of HA is not affected during insolubilization process, because there is no intensity change.
Insolubilized humic acid showed no tendency to adsorb phenol molecules. Therefore, we modified sodium form of insolubilized humic acid with cationic surfactant (cetyltrimethylammoniumchloride) by making its surface nonpolar to ensure the adsorption of phenol. After modification, alkyl peaks appeared at 2928 and 2857 cm-1 on FTIR spectrum of surfactant modified insolubilized humic acid (SMIA) as shown in Fig. 3.5.
3500 3000 2500 2000 1500 1000 500 0,2 0,3 0,4 0,5 0,6 0,7 Aliphatic CH ; COO-polysaccharides Ketones COOH overtone polysaccharides CH Aromatic overtone COOH CH Aliphatic OH;NH T ransmittance wavenumber (cm-1) HA INaA Aromatic C=C C-O Phenol C-O
Fig. 3.3: FTIR spectra of humic acid and sodium form of insolubilized humic acid.
Fig. 3.4: 13C NMR spectra of humic acid and sodium form of insolubilized humic acid.
3500 3000 2500 2000 1500 1000 500 0,20 0,25 0,30 0,35 0,40 0,45 0,50 0,55 Tr ansmittanc e wavenumber (cm-1) INaA SMIA
Fig. 3.5: FTIR spectra of sodium form of insolubilized humic acid and surfactant modified insolubilized humic acid
3.1.3- Characterization of Iron Nanoparticles
Particle shape, size and composition are important properties that affect the chemical and physical properties of nanoparticles. To provide primary characterization of these properties, XRD pattern (Fig. 3.6) and SEM images at different magnifications (Fig. 3.7) were obtained for iron nanoparticles (nano-Fe0). XRD pattern for nano-Fe0 yielded a broad peak for α-Fe0 (ferrite-BCC crystal structure) with mean crystallite dimensions <1.5nm. This broadening of diffraction peak suggests a distribution of crystallite dimensions18. These small crystals are aggregated into spherical <100nm particles, and these particles are further aggregated into the chains as shown in Fig. 3.7. The size of particles and the observation of chain structure of iron nanoparticles are in agreement with previous studies29,30. After mixing nano-Fe0 with aqueous barium solution, some more peaks
appeared on XRD pattern, because nano-Fe0 are surrounded by an oxide shell which
are iron oxides with different crystal structures. The oxide layer is formed by the oxidation of Fe0 nanoparticles. 20 30 40 50 60 1000 2000 3000 4000 5000 6000 ο Inte nsity 2θ
*
Fe3O4 ο FeO(OH) Fe oxide Nano-Fe0*
α-Fe0*
Fig. 3.7 SEM images of iron nanoparticles at 1µm, 500nm and 200nm magnifications
3.2- Radiochemical Sorption Studies
3.2.1- Kinetic Studies
The experimental data in adsorption are expressed in terms of the ditribution ratio, Rd, defined as the ratio of adsorbate concentration on solid phase to its
concentration in liquid phase. The distribution ratio of adsorption is defined as :
l ] C [ ] C [ R s d = (2)
Where [C]s(mmol/g) and [C]l (mmol/ml) are the concentrations of species C
in the solid and liquid phases, respectively. At the beginning of the sorption step, V (ml) of solution with initial concentration [C]° (mmol/ml) is used and at the end of the sorption step V (ml) of solution with concentration [C]l are present, hence the
concentration of C in the solid phase after sorption can be expressed as: s s W ) ] C [ ] C [ ( V ] C [ = °− l (3)
In terms of radiactivity, [C]l can be written as:
° ° = [C] A A ] C [ l l (4)
From (2)-(4), the following equation is obtained: s W A VA VA Rd l l − ° = (5)
Where A° is the initial count rate of solution added for sorption (cps)/ml, Al
is the count rate of solution after sorption (cps)/ml, Ws is the weight of solid material (g)31.
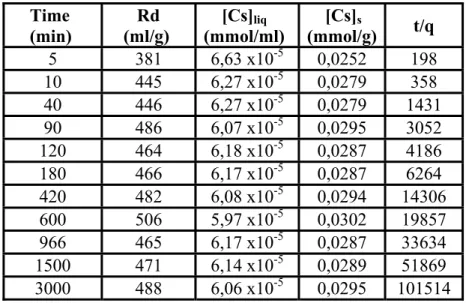
The sorption kinetics of Cs+ and Ba2+ ions on INaA (sodium form of insolubilized humic acid ) and Ba2+ ion on iron nanoparticles were examined by radioactive tracer method to determine the time required to reach equilibrium, rate constants and the nature of the kinetic model for each sorption process. The results of the variation of Rd as a function of time for Cs+ and Ba2+ ions on INaA and iron
nanoparticles are given in Fig. 3.8, 3.9, 3.10 and in Tables 3.2, 3.3 and 3.4.
It is apparent that, equlibrium is reached after several hours of contact in each process. Such a rapid process indicates that sorption is primarily a surface phenomenon where the humic acid and iron nanoparticle surfaces are readily accessible to ions in solution. On the basis of the obtained results an equilibrium period of 24 hours were selected as a fixed parameter for further experiments, where the effects of loading and temperature, were examined when INaA was used as a sorbent. In the case of iron nanoparticles as a sorbent, 5 hours were selected as an equilibrum time. 0 500 1000 1500 2000 2500 3000 350 400 450 500 550 Rd (m l/g) Time (min)
Fig. 3.8: Variation of Rd values with shaking time for Cs+
sorption onto sodium form of insolubilized humic acid at an initial concentration of 1x10⁻⁴M at 25°C