R E S E A R C H
Open Access
Usage and comparison of artificial
intelligence algorithms for determination of
growth and development by cervical
vertebrae stages in orthodontics
Hatice Kök
1*, Ayse Merve Acilar
2and Mehmet Said
İzgi
3Abstract
Background: Growth and development can be determined by cervical vertebrae stages that were defined on the cephalometric radiograph. Artificial intelligence has the ability to perform a variety of activities, such as prediction-classification in many areas of life, by using different algorithms, In this study, we aimed to determine cervical vertebrae stages (CVS) for growth and development periods by the frequently used seven artificial intelligence classifiers, and to compare the performance of these algorithms with each other.
Methods: Cephalometric radiographs, that were obtained from 300 individuals aged between 8 and 17 years were included in our study. Nineteen reference points were defined on second, third, and 4th cervical vertebrae, and 20 different linear measurements were taken. Seven algorithms of artificial intelligence that are frequently used in the field of classification were selected and compared. These algorithms are k-nearest neighbors (k-NN), Naive Bayes (NB), decision tree (Tree), artificial neural networks (ANN), support vector machine (SVM), random forest (RF), and logistic regression (Log.Regr.) algorithms.
Results: According to confusion matrices decision tree, CSV1 (97.1%)–CSV2 (90.5%), SVM: CVS3 (73.2%)–CVS4 (58.5%), and kNN: CVS 5 (60.9%)–CVS 6 (78.7%) were the algorithms with the highest accuracy in determining cervical vertebrae stages. The ANN algorithm was observed to have the second-highest accuracy values (93%, 89.7%, 68.8%, 55.6%, and 78%, respectively) in determining all stages except CVS5 (47.4% third highest accuracy value). According to the average rank of the algorithms in predicting the CSV classes, ANN was the most stable algorithm with its 2.17 average rank.
Conclusion: In our experimental study, kNN and Log.Regr. algorithms had the lowest accuracy values. SVM-RF-Tree and NB algorithms had varying accuracy values. ANN could be the preferred method for determining CVS.
Keywords: Artificial intelligence, Algorithms, Cervical vertebrae, Growth and development, Orthodontics Introduction
One of the basic elements of orthodontic treatment is tim-ing. Skeletal parameters are affected by growth and develop-ment, causing changes in the sagittal, transversal, and vertical planes in patients. For individuals with severe ortho-dontic anomalies, whose growth and development have
been completed, orthognathic surgery-assisted orthodontic treatment is recommended [1–3]. Determination of the ideal initiation time of orthodontic and/or dentofacial orthopedic treatment may be as crucial as the selection of the specific treatment regimen [4]. Given the treatment can be initiated in the patient’s optimal growth and development phase with a suitable protocol, the most positive response with the least potential morbidity can be expected [5].
Growth and development can be determined by chronological age, menarche, or changes in voice, an-thropometric indicators such as height increase and © The Author(s). 2019 Open Access This article is distributed under the terms of the Creative Commons Attribution 4.0
International License (http://creativecommons.org/licenses/by/4.0/), which permits unrestricted use, distribution, and reproduction in any medium, provided you give appropriate credit to the original author(s) and the source, provide a link to the Creative Commons license, and indicate if changes were made.
* Correspondence:[email protected]
1Faculty of Dentistry, Department of Orthodontics, Selçuk University [SÜ],
Alaeddin Keykubat Campus, Akademi Square, Yeniİstanbul Street 309, Selçuklu, Konya, Türkiye
skeletal maturation (bone age) [6,7]. Since chronological age alone is not sufficient to fully reflect the actual growth time, various skeletal maturation indicators have been developed [6]. In the determination of growth and development, skeletal maturation stages obtained from radiographic analyses are widely used in order to predict the time of pubertal development, to determine the growth rate, the peak period of growth and the remaining growth and development potential [8, 9]. Traditionally, the gold standard of determining the growth and development periods of individuals was achieved by hand-wrist radiographs. Skeletal maturation (bone age) also can be determined by the help of cervical vertebra maturation stages. In orthodontic practice, the use of cephalometric radiographs for the purposes of diagnosis and establishing treatment plans has gained wide acceptance [10, 11]. Lamparski first reported growth and development could be inferred from the cer-vical vertebrae. The reliability and validity of the cercer-vical vertebral method combined with the hand-wrist method and have been confirmed by studies conducted in differ-ent parts of the world [12, 13]. It is easy to record and interpret the growth and development determination from cephalometric radiographs, and this method also prevents the patient from receiving additional radiation [9].
Due to major advances in technology, computer pro-grams that assist in the diagnosis, treatment, and prog-nosis are routinely used in the field of orthodontic science. Currently, there are many studies utilizing artifi-cial intelligence and bioinformatics for the purposes of prediction, classification, and clustering of real-life prob-lems [14–17]. Genetic algorithms, expert systems, fuzzy logic, logistic regression, random forest, decision tree, k-nearest neighbors algorithm (k-NN), support vector ma-chine (SVM), Naive Bayes, and artificial neural networks are among the main artificial intelligence algorithms. To our knowledge, no computer-aided method has been de-veloped to determine growth, development, and bone age from cervical vertebrae, a gap in the field that has not been explored. In this study, we aimed to determine cervical vertebrae stages (CVS) for growth and develop-ment periods by the frequently used seven artificial intelligence classifiers and to compare the performance of these algorithms with each other.
Material and methods
Ethical approval for the study was obtained from Necmettin Erbakan University Ethics Committee on Research except for Pharmaceuticals and Medical De-vice. In our retrospective study, cephalometric radio-graphs obtained from 300 individuals aged between 8 and 17 years. A total of 10 groups with 30 individuals were included in the study.
Cephalometric radiographs of individuals were taken in the natural head position. All cephalometric radio-graphs included in this study are radioradio-graphs with ad-equate quality and in which second (C2), third (C3), and fourth (C4) cervical vertebrae are clearly observed. Our subject selection criteria for the study included individ-uals that were not subjected to trauma and/or operation in the head and neck region, did not undergo orthodon-tic treatment, did not have any disorder that could inter-fere with bone development, did not have any systemic disease and/or growth and development retardation, and did not have congenital and/or acquired malformations in the head and neck region.
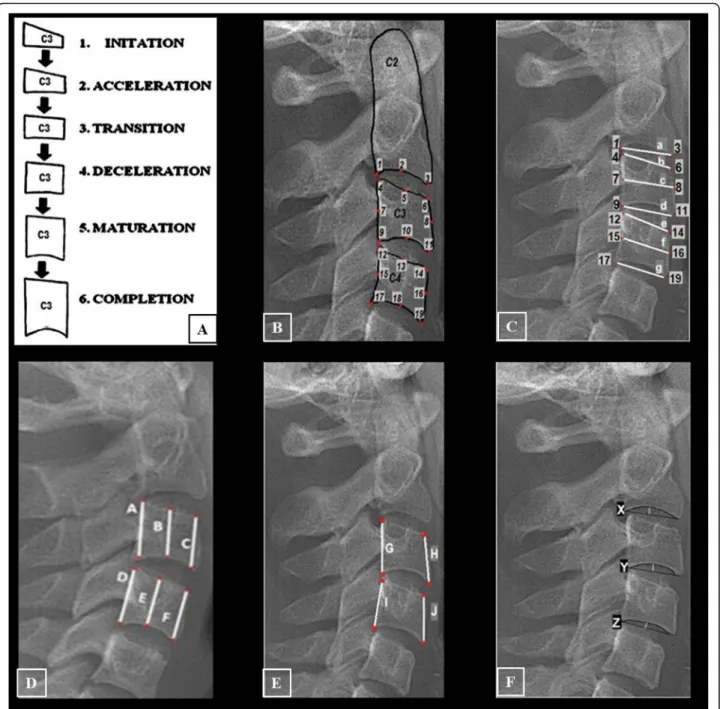
For the determination of growth and development of individuals from cephalometric radiographs, the second (C2), third (C3), and fourth (C4) cervical vertebrae are evaluated and divided into six stages: cervical vertebrae stage 1 (CVS1) is the starting stage during which adoles-cent growth commences. C2, C3, and C4 are trapezoidal, and their upper edges are inclined forward. CVS2 is the acceleration stage during which adolescent growth is ac-celerated. Concavity starts at the lower edge of C2 and C3. The lower edge of C4 is flat. C3 and C4 start to look rectangular. CVS3 is the change stage during which there is an adolescent growth spike. At the lower edges of C2 and C3, concavity becomes evident. At the lower edge of C4, concavities start. C3 and C4 assume rect-angular morphologies. CVS4 is the deceleration stage during which adolescent growth slows down consider-ably. At the lower edges of C2, C3, and C4 concavities become evident. C3 and C4 begin to look like a square. CVS5 is the maturity stage during which adolescent growth is not very significant. The concavities at the lower edges of C2, C3, and C4 become more evident. C3 and C4 take the shape of a square. CVS6 is the stage of completion during which adolescent growth is com-pleted. Growth is not expected at this stage. The concav-ities at the lower edges of C2, C3, and C4 deepen significantly. C3 and C4 are either in a square shape, or their vertical dimensions are larger than the horizontal dimension (Fig.1a) [18].
The steps of our experimental study were designed as follows: firstly, CVS of each radiograph was determined by the orthodontist. These were labeled as actual CVS. One month later, this process was repeated by the same orthodontist and the intra-examiner reproducibility for the cervical vertebral stages was tested by Fleiss Kappa and a substantial agreement was found ( = 0.7484). Then, 19 reference points were defined on C2, C3, and C4 (Fig. 1b; Table1). The vertebral measurements were detected according to our literature research. The differ-ent researcher’s measurements were combined to com-prehensive our study [26,27,31,32]. Thus, a total of 20 different linear measurements were performed on C2–
C3 and C4 in each cephalometric radiograph. These were C3–C4 anterior-medial-posterior height, C3–C4 upper-medial-lower width, C2 lower width, C3–C4 slope, and C2–C3–C4 depth measurements (Fig. 1c–f;
Tables2,3, and4). The measurement data were given as input to artificial intelligence algorithms, and the pre-dicted CVS as a result of these algorithms were obtained. Then, the predicted CVS was compared with the actual CVS (cross-validation (Fig. 2), rank (Fig. 3), ROC curve (Fig.4)).
The premise behind the use of artificial intelligence is to assist in making more accurate and unbiased deci-sions, thus increasing the efficiency of systems. There-fore, in the present study, seven algorithms of artificial intelligence that are frequently used in the field of classi-fication were selected and compared. These algorithms are k-nearest neighbors (k-NN), Naive Bayes (NB), deci-sion tree (Tree), artificial neural networks (ANN), sup-port vector machine (SVM), random forest (RF), and logistic regression (Log.Regr.) algorithms.
Fig. 1 The cervical vertebral references and measurements. a The observed alteration of C3.18. b The cervical vertebral reference points. c The horizontal linear measurements. d The vertical linear measurements. e The anterior and posterior vertebral slope measurements. f The vertebral depth measurements
The k-nearest neighbors (k-NN) algorithm makes clas-sification according to the distance between the in-stances. The nearest k neighbor to the point to be classified is determined, and according to the status of these neighbors, the class of the new instance is deter-mined. Naive Bayes is a statistical classification algo-rithm based on the Bayes theorem. Firstly, the frequency and probability tables are created for each instance of x. Then, by using these tables, theP(c|x) conditional prob-ability values are calculated for each class of c of a new incoming instance. It is said that instance x belongs to the class, for which the highest probability value is ob-tained. The decision tree is a hierarchical data structure that implements the “divide and manage” strategy. Each attribute is represented by a node. Branches and leaves
are the elements of the tree structure. The very last structure is named the leaf, while the top structure is named the root, and the remaining structures between them are named the branch. The entropy values of the attributes and the system will determine which of the at-tributes will be the root and which of them will be the branch. ID3, ASSISTANT, and C4.5 are examples of de-cision tree algorithms. Artificial Neural Network (ANN), a mathematical model of the human nervous system, is a system formed by interrelated artificial nerve cells (neu-rons). The strength of this system is at solving non-linear problems. It can decide on new instances it has never encountered, via establishing connections between the training examples [19]. The support vector machine (SVM) is an artificial intelligence algorithm that
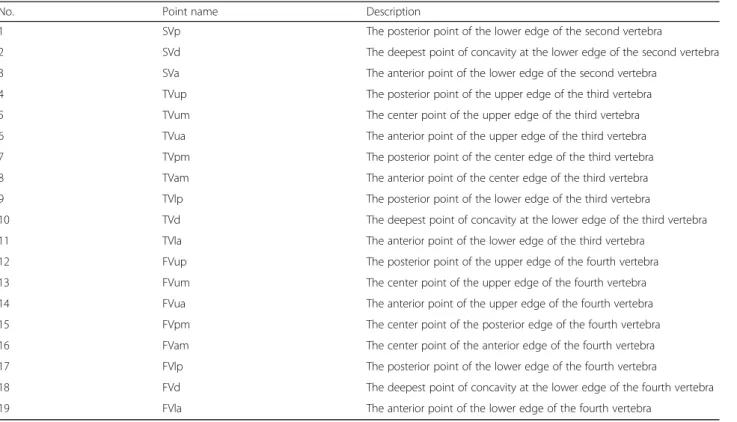
Table 1 The cervical vertebrae reference points
No. Point name Description
1 SVp The posterior point of the lower edge of the second vertebra
2 SVd The deepest point of concavity at the lower edge of the second vertebra 3 SVa The anterior point of the lower edge of the second vertebra
4 TVup The posterior point of the upper edge of the third vertebra 5 TVum The center point of the upper edge of the third vertebra 6 TVua The anterior point of the upper edge of the third vertebra 7 TVpm The posterior point of the center edge of the third vertebra 8 TVam The anterior point of the center edge of the third vertebra 9 TVlp The posterior point of the lower edge of the third vertebra
10 TVd The deepest point of concavity at the lower edge of the third vertebra 11 TVla The anterior point of the lower edge of the third vertebra
12 FVup The posterior point of the upper edge of the fourth vertebra 13 FVum The center point of the upper edge of the fourth vertebra 14 FVua The anterior point of the upper edge of the fourth vertebra 15 FVpm The center point of the posterior edge of the fourth vertebra 16 FVam The center point of the anterior edge of the fourth vertebra 17 FVlp The posterior point of the lower edge of the fourth vertebra
18 FVd The deepest point of concavity at the lower edge of the fourth vertebra 19 FVla The anterior point of the lower edge of the fourth vertebra
Table 2 The horizontal and vertical linear measurements
The horizontal linear measurements The vertical linear measurements
No. Name Description No. Name Description
a SVp-SVa Point 1 to point 3 A TVup-Tvlp Point 4 to point 9
b TVup-TVua Point 4 to point 6 B TVum-Tvd Point 5 to point 10
c TVpm-Tvam Point 7 to point 8 C TVua-TVla Point 6 to point 11
d TVlp-TVla Point 9 to point 11 D FVup-Fvlp Point 12 to point 17
e FVup-FVua Point 12 to point 14 E FVum-FVd Point 13 to point 18
f FVpm-Fvam Point 15 to point 16 F FVua-FVla Point 14 to point 19
separates the attribute space from the hyperspace, thereby aiming to maximize the margin between in-stances of different classes/class values. The SVM can also be applied to multiple classification problems [20,
21]. Random Forest, an ensembles-learning algorithm, forms a series of decision trees. Each tree is developed from a bootstrap instance from the training data. While trees are formed one by one, a random subset from attri-butes is generated (the expression of random in the al-gorithm is originated from here). The class of the new instance is determined by using the majority vote of in-dividual trees in the forest [22,23]. Logistic regression is a statistical method used to analyze a dataset consisting of one or more independent variables that determine the output. It is the regression model employed when deal-ing with categorical outcomes (as opposed to continuous outcome where linear regression can be applied). It is the model obtained by adding a regularization term (such as the Lasso regression that was used in this study) to the cost function in order to eliminate the over-learning problem of linear regression [24].
Statistical analysis
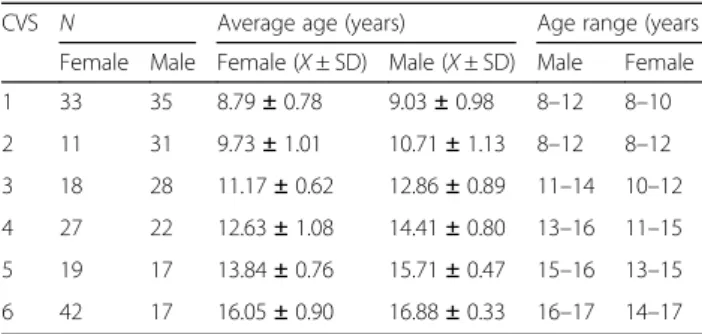
In the present study, a dataset was created by taking ver-tebral measurements from the cephalometric radio-graphs of 300 individuals. Descriptive statistics were made for cervical vertebrae stages (CVS) and the distri-bution of mean ages and age ranges according to their genders (Table5).
In order to determine CVS, which is one of the attri-butes obtained from cervical vertebral linear measure-ment values, the relevant algorithms were operated in Orange 3.11 software and the results were evaluated. Five-fold cross-validation was used to evaluate the per-formance of the algorithms. In the cross-validation process, the dataset is divided into five subsets. One of these subsets is separated as a test set to validate the ac-curacy of the system, while the remaining four are used as training sets. This process is repeated for each subset.
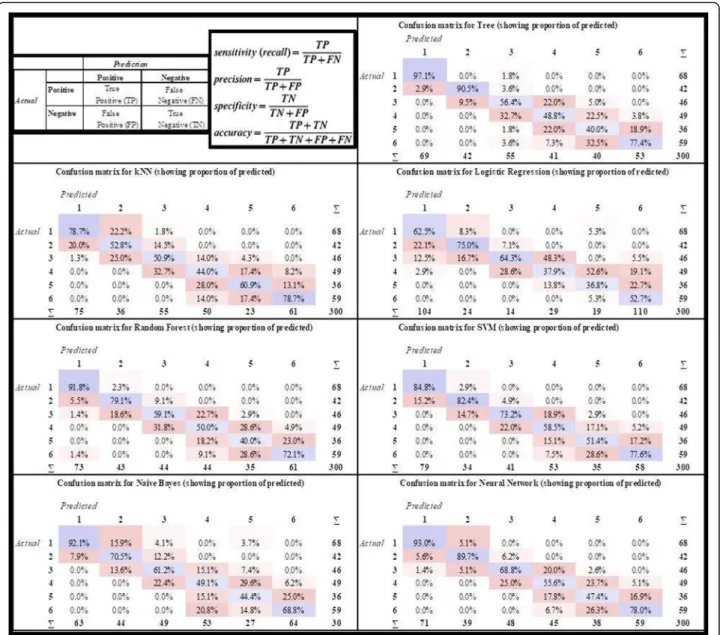
This ensures that each data point is included in the test set at least once. As a result, the average of five opera-tions for the test sets is taken, and the classification ac-curacy (CA) of the system is calculated. Also, the results can be expressed using the confusion matrix. In the con-fusion matrix, the lines represent the numbers of the ac-tual class value of the samples, while the columns represent the model’s prediction. Sensitivity (recall), pre-cision, area under the curve (AUC), and F1 criterion were used to measure the model’s success by confusion matrix (Fig.2).
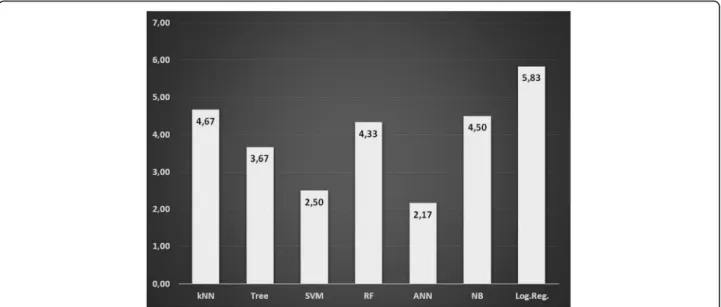
In statistics,“ranking” refers to the data transformation in which numerical values are replaced by their rank when the data are sorted in descending or ascending order. In our study, we used CA as numerical data and the ranks were assigned to CA values in descending order. For example, CA values are 90.5%, 97.1%, 52.8%, and 78% are obtained, the ranks of these data items would be 2, 1, 4, and 3, respectively.
Results
In the created study model, the confusion matrices were obtained for the six classes (CVS1-CVS6) by implement-ing the ANN, k-NN, decision tree, random forest, SVM, and logistic regression algorithms for all data set (Fig.2). Decision tree CSV1 (97.1%)–CSV2 (90.5%), SVM CVS3 (73.2%)–CVS4 (58.5%), kNN CVS5 (60.9%)–CVS 6 (78.7%) were the algorithms with the highest accuracy in determin-ing cervical vertebrae stages, while kNN CVS2 (52.8%) and CVS3 (50.9%) had the lowest accuracy. The logistic regres-sion algorithm was observed to have the lowest accuracy with the values of CVS1 (62.5%)–CVS4 (37.9%) and CVS6 (52.7%). The random forest algorithm had the lowest accur-acy for CVS5 (36.8%). The ANN algorithm was observed to have the second-highest accuracy values (93%, 89.7%, 68.8%, 55.6%, and 78%, respectively) in determining all stages except CVS5 (47.4%—third highest accuracy value). The average rank of the algorithms in predicting the CSV
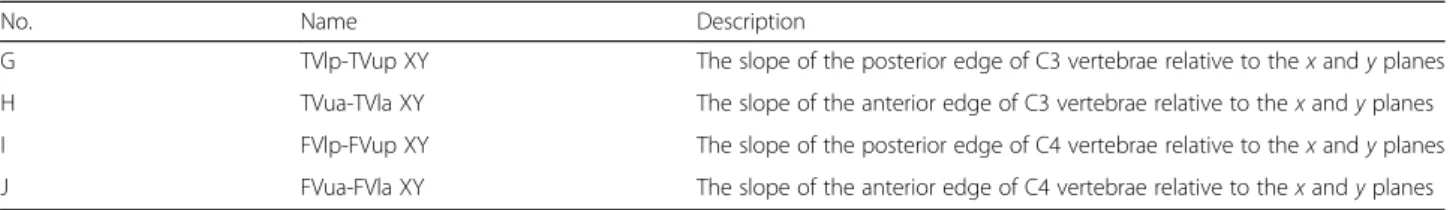
Table 3 The anterior and posterior vertebral slope measurements
No. Name Description
G TVlp-TVup XY The slope of the posterior edge of C3 vertebrae relative to the x and y planes H TVua-TVla XY The slope of the anterior edge of C3 vertebrae relative to the x and y planes I FVlp-FVup XY The slope of the posterior edge of C4 vertebrae relative to the x and y planes J FVua-FVla XY The slope of the anterior edge of C4 vertebrae relative to the x and y planes
Table 4 The vertebral depth measurements
No. Name Description
X SVD The perpendicular distance from“a” to deepest point of the inferior border of the second vertebrae Y TVD The perpendicular distance from“d” to deepest point of the inferior border of the third vertebrae Z FVD The perpendicular distance from“g” to deepest point of the inferior border of the forth vertebrae
classes is presented in (Fig.3). It was found out that ANN was the most stable algorithm with its 2.17 average rank.
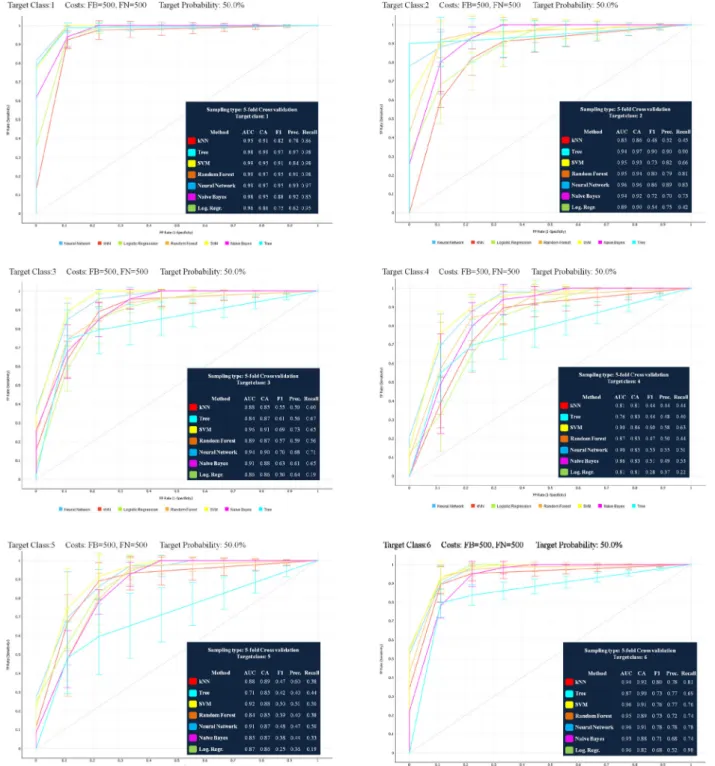
In this study, ROC curves were drawn based on average test results obtained from five-fold cross-validation for each vertebral growth and development stage (Fig.4). As a result of the AUC evaluation, it was observed that the ANN algorithm had the highest values in determining all stages with the exception of CVS3 and CVS5. The SVM algorithm had the highest values in determining the CVS3 and CVS5 stages. As a result of the CA evaluation, the ANN algorithm was determined to have the second-highest value in a stable way of determining all stages.
Discussion
Uysal et al. [25] evaluated the relationship between chronological age and bone ages determined from
hand-wrist and cervical vertebrae radiography with the Spear-man rank-order correlation coefficients and reported that cervical vertebrae stages can be used clinically in the de-termination of growth and development in Turkish indi-viduals. Mito et al. [26] developed a regression formula to determine bone age from cervical vertebrae. Caldas et al. [27] took measurements from the cervical vertebrae and developed a regression formula for Brazilian individuals. Alkhal et al. [28] compared chronological ages, hand-wrist bone ages which were determined according to the TW3 and GP method, and cervical vertebral bone ages which they determined by the formula they developed by using the stepwise multiple regression analysis from cervical ver-tebra measurements and reported the results to be com-patible and highly correlated with each other. Baidas reported that chronological age was a weak indicator of Fig. 2 The basic notations and the confusion matrices of the algorithms which were used for determination of CVS
skeletal maturation and that cervical vertebrae could serve as a better indicator for this purpose [29]. In 2010, in order to determine bone age from cephalometric radio-graphs by using a computerized and semi-automated sys-tem, Caldas et al. took measurements by marking the vertebral reference points on the computerized cephalom-etry program and by also incorporating the formula they derived previously [30]. Alhadlaq and Al-Maflehi [31] pre-sented a statistical method for the determination of bone age from cervical vertebrae by the stepwise multiple re-gression analysis using chronological age and the ratio be-tween the measurements. Beit et al. [32] evaluated the relationship between morphological changes on cervical vertebrae, the bone age according to the hand-wrist (GP) atlas, and chronological age according to the Bland and Altman plot. On the other hand, Nestman et al. [33] and Gabriel et al. [34] reported that cervical vertebrae staging has very poor reproducibility. Hand-wrist radiographs are accepted as the gold standard at the determination of growth-development, but the definition from the cephalo-metric radiographs, routine for orthodontic treatment, could be advantageous for both the patients and the clinicians.
Mito et al. [26] Caldas et al. [27, 30], and Alhadlaq and Al-Maflehi [31] performed eight linear measure-ments on C3 and C4 among cervical vertebrae, while Chen et al. [10] performed eight linear measurements on C2–C3 and C4. Beit et al. [32] performed 10 lin-ear measurements on C2–C3, and C4. These re-searchers reported that since the first (C1) and fifth (C5) cervical vertebrae could not be observed clearly and given the minimal changes in C2, they were not included in the study. In the present study, although there were minimal changes in C2, we deemed it
necessary for C2 data to be included. As a result, 20 linear measurements were taken on C2–C3 and C4.
To our knowledge, although studies have been carried out in order to automatize growth and development de-termination from cervical vertebrae in orthodontics, no method using artificial intelligence has been encoun-tered. Multidisciplinary studies have been mostly per-formed on hand-wrist radiographs. Chang et al. [35] described the computer-assisted method of determining bone age based on the characteristics of phalanges, and they benefited from the backpropagation neural network for classification purposes. In this study, 10 input param-eters from the left-hand X-ray images were applied to the neural networks, and 77.69% classification success was achieved. Giordano et al. [36] conducted studies on the pineal and diaphyseal images in hand-wrist radio-graphs in order to determine the bone age automatically. Li et al. [37] introduced the automatic detection of growth and development periods with the TW3 method from hand-wrist radiographs and with ANN among arti-ficial intelligence methods.
According to confusion matrices for all data set, Log.Regr had the lowest values for CVS1–CVS4– CVS5–CVS6. Most of the CVS4 was identified as CVS3 and CVS5 was identified as CVS4 by Log.Regr. algorithm. Its CA values of five-fold cross-validation were low too. It was observed from confusion matri-ces that kNN had the highest values for CVS5–CVS6 and the lowest values for CVS2–CVS3. By the way, kNN algorithm had low values at five-fold cross-validation. In determining CVS, different algorithms for each stage showed low and high values. In our ex-perimental study, algorithms except ANN were not able to demonstrate consistent achievement in Fig. 3 The mean rank values of the algorithms used for determination of CVS according to classification accuracy
determining each class correctly. The ANN algorithm was observed to have the second-highest accuracy values in both five-fold cross-validation and confusion matrices results for determining all stages except CVS5. We have shown the ANN algorithm has been found out to be the steadier algorithm than others in
determining cervical vertebrae stages. According to confusion matrices, ANN classification success was CVS1 (93%), CVS2 (89.7%), CVS6 (78%), CVS3 (68.8%), CVS4 (55.6%), and CVS5 (47.4%), respect-ively. The five-fold cross-validation of ANN’s CA values were the lowest 85 and higher.
Fig. 4 The ROC curves of the algorithms used for determination of CVS and the tables of average test set classification accuracy (CA) results from five-fold cross-validation
Conclusions
Artificial intelligence algorithms can be used for diag-nostic purposes in all sciences where growth develop-ment needs to be determined. Thus, more accurate and unbiased decisions can be obtained. By providing deci-sion support to clinicians, it can provide faster and more effective diagnosis and contribute to the accuracy, reli-ability, and reproducibility of the diagnosis. In the ortho-dontic science that is digitized day by day, we think that time and labor can be saved by developing computer-assisted decision support programs and integrating them into existing programs.
As a conclusion, kNN and Log.Regr. algorithms had the lowest accuracy values, while SVM, RF, Tree, and NB algorithms had varying accuracy values so ANN could be the preferred method for determining CVS ac-cording to our experimental study.
Abbreviations
ANN:Artificial neural networks algorithm; C2: Second cervical vertebrae; C3: Third cervical vertebrae; C4: Fourth cervical vertebrae; CVS: Cervical vertebrae stages; CVS1: Cervical vertebrae stage 1; CVS2: Cervical vertebrae stage 2; CVS3: Cervical vertebrae stage 3; CVS4: Cervical vertebrae stage 4; CVS5: Cervical vertebrae stage 5; CVS6: Cervical vertebrae stage 6; NN: k-nearest neighbors algorithm; Log.Regr: Logistic regression algorithm; NB: Naive Bayes algorithm; RF: Random forest algorithm; SVM: Support vector machine algorithm; Tree: Decision tree algorithm
Acknowledgements Not applicable
Authors’ contributions
HK, AMA, and MSI designed the study. MSI carried out the data collection of the study and performed the measurements. AMA carried out the computer part of the study and analyzed the data. HK wrote the manuscript and prepared the figures and tables. All listed authors critically read, edited, and approved the final manuscript.
Funding
This research did not receive any specific grant from funding agencies in the commercial or not-for-profit sectors.
Availability of data and materials
The data supporting the findings of this research can be obtained directly from the authors.
Ethics approval and consent to participate
Ethical approval for the study was obtained from Necmettin Erbakan University Ethics Committee on Research except for Pharmaceuticals and Medical Device (decision no: 2016/009).
Consent for publication Not applicable. Competing interests
The authors declare that they have no competing interests. Author details
1Faculty of Dentistry, Department of Orthodontics, Selçuk University [SÜ],
Alaeddin Keykubat Campus, Akademi Square, Yeniİstanbul Street 309, Selçuklu, Konya, Türkiye.2Engineering and Architecture Faculty, Department
of Computer Engineering, Necmettin Erbakan University [NEÜ], Konya, Türkiye.3Private Practice,İstanbul, Türkiye.
Received: 26 July 2019 Accepted: 25 October 2019
References
1. Baccetti T, Franchi L, McNamara JA. An improved version of the cervical vertebral maturation (CVM) method for the assessment of mandibular growth. Angle Orthod. 2002;72(4):316–23.
2. Marsan G, Oztas E, Kuvat SV. Changes in soft tissue profile after mandibular setback surgery in class III subjects. Int J Oral Maxillofac Surg. 2009;38(3): 236–40.
3. Nicodemo D, Pereira MD, Ferreira LM. Effect of orthognathic surgery for class III correction on quality of life as measured by SF-36. Int J Oral Maxillofac Surg. 2008;37(2):131–4.
4. Björk A. Variations in the growth pattern of the human mandible: longitudinal radiographic study by the implant method. J Dent Res. 1963; 42(1):400–11.
5. Hunter CJ. The correlation of facial growth with body height and skeletal maturation at adolescence. Angle Orthod. 1966;36(1):44–54.
6. Hagg U, Taranger J. Maturation indicators and the pubertal growth spurt. Am J Orthod. 1982;82(4):299–309.
7. Franchi L, Baccetti T, McNamara JA. Mandibular growth as related to cervical vertebral maturation and body height. Am J Orthod Dentofac Orthop. 2000; 118(3):335–40.
8. Hagg U, Taranger J. Menarche and voice changes as indicators of the pubertal growth spurt. Acta Odontol Scand. 1980;38(3):179–86.
9. Flores-Mir C, Nebbe B, Major PW. Use of skeletal maturation based on hand-wrist radiographic analysis as a predictor of facial growth: a systematic review. Angle Orthod. 2004;74(1):118–24.
10. Chen L, Liu J, Xu T, Long X, Lin J. Quantitative skeletal evaluation based on cervical vertebral maturation: a longitudinal study of adolescents with normal occlusion. Int J Oral Maxillofac Surg. 2010;39(7):653–9. 11. Fudalej P, Bollen AM. Effectiveness of the cervical vertebral maturation
method to predict postpeak circumpubertal growth of craniofacial structures. Am J Orthod Dentofac Orthop. 2010;137(1):59–65.
12. Grave K, Townsend G. Cervical vertebral maturation as a predictor of the adolescent growth spurt. Aust Orthod J. 2003;19(1):25–32.
13. Lamparski DG. Skeletal age assessment utilizing cervical vertebrae. Am J Orthod. 1975;67(4):458–9.
14. Su MC, Chang HT. A new model of self-organizing neural networks and its application in data projection. IEEE Trans Neural Netw. 2001;12(1):153–8. 15. Mackin N, Sims-Williams JH, Stephens CD. Artificial intelligence in the dental
surgery: an orthodontic expert system, a dental tool of tomorrow. Dent Update. 1991;18(8):341–3.
16. Brickley MR, Shepherd JP, Armstrong RA. Neural networks: a new technique for development of decision support systems in dentistry. J Dent. 1998; 26(4):305–9.
17. Jung SK, Kim TW. New approach for the diagnosis of extractions with neural network machine learning. Am J Orthod Dentofac Orthop. 2016;149(1):127– 33.
18. Hassel B, Farman AG. Skeletal maturation evaluation using cervical vertebrae. Am J Orthod Dentofac Orthop. 1995;107(1):58–66.
19. Mitchell TM. Machine learning. New York: The McGraw-Hill Companies Inc; 1997. p. 52,81,231.
Table 5 The descriptive statistics of the males’ and females’ age by CVS
CVS N Average age (years) Age range (years Female Male Female (X ± SD) Male (X ± SD) Male Female 1 33 35 8.79 ± 0.78 9.03 ± 0.98 8–12 8–10 2 11 31 9.73 ± 1.01 10.71 ± 1.13 8–12 8–12 3 18 28 11.17 ± 0.62 12.86 ± 0.89 11–14 10–12 4 27 22 12.63 ± 1.08 14.41 ± 0.80 13–16 11–15 5 19 17 13.84 ± 0.76 15.71 ± 0.47 15–16 13–15 6 42 17 16.05 ± 0.90 16.88 ± 0.33 16–17 14–17
20. Ben-Hur A, Weston J. A user's guide to support vector machines. Methods Mol Biol. 2010;609:223–39.
21. Cortes C, Vapnik V. Support-vector networks. Mach Learn. 1995;20:273–97. 22. Breiman L. Random forests. Mach Learn. 2001;45(1):5–32.
23. Liaw A, Wiener M. Classification and regression by Random Forest. R News. 2002;2:18–22.
24. Yang Y, Loog M. A benchmark and comparison of active learning for logistic regression. Pattern Recogn. 2018;83:401–15.
25. Uysal T, Ramoglu SI, Basciftci FA, Sari Z. Chronologic age and skeletal maturation of the cervical vertebrae and hand-wrist: is there a relationship? Am J Orthod Dentofac Orthop. 2006;130(5):622–8.
26. Mito T, Sato K, Mitani H. Cervical vertebral bone age in girls. Am J Orthod Dentofac Orthop. 2002;122(4):380–5.
27. Caldas MDP, Ambrosano GMB, Haiter NF. New formula to objectively evaluate skeletal maturation using lateral cephalometric radiographs. Braz Oral Res. 2007;21(4):330–5.
28. Alkhal HA, Wong RW, Rabie AB. Correlation between chronological age, cervical vertebral maturation and Fishman’s skeletal maturity indicators in southern Chinese. Angle Orthod. 2008;78(4):591–6.
29. Baidas L. Correlation between cervical vertebrae morphology and chronological age in Saudi adolescents. King Saud Univ J Dent Sci. 2012; 3(1):21–6.
30. Caldas MDP, Ambrosano GMB, Haiter Neto F. Computer assisted analysis of cervical vertebral bone age using cephalometric radiographs in Brazilian subjects. Braz Oral Res. 2010;24(1):120–6.
31. Alhadlaq AM, Al-Maflehi NS. New model for cervical vertebral bone age estimation in boys. King Saud Univ J Dent Sci. 2013;4(1):1–5. 32. Beit P, Peltomaki T, Schätzle M, Signorelli L, Patcas R. Evaluating the
agreement of skeletal age assessment based on hand–wrist and cervical vertebrae radiography. Am J Orthod Dentofac Orthop. 2013;144(6):838–47. 33. Nestman TS, Marshall SD, Qian F, Holton N, Franciscus RG, Southard TE.
Cervical vertebrae maturation method morphologic criteria: poor reproducibility. Am J Orthod Dentofac Orthop. 2011;140:182–8. 34. Gabriel DB, Southard KA, Qian F, Marshall SD, Franciscus RG, Southard TE.
Cervical vertebrae maturation method: poor reproducibility. Am J Orthod Dentofac Orthop. 2009;136:478.e1–7 discussion, 478–80.
35. Chang CH, Hsieh CW, Jong TL, Tiu CM. A fully automatic computerized bone age assessment procedure based on phalange ossification analysis. Proc IPPR. 2003;16:463–8.
36. Giordano D, Leonardi R, Maiorana F, Scarciofalo G, Spampinato C. Epiphysis and metaphysis extraction and classification by adaptive thresholding and DoG filtering for automated skeletal bone age analysis, 29th Conf Proc IEEE Eng Med Biol Soc; 2007. p. 6551–6.
37. Liu J, Qi J, Liu Z, Ning Q, Luo X. Automatic bone age assessment based on intelligent algorithms and comparison with TW3 method. Comput Med Imaging Graph. 2008;32(8):678–84.
Publisher’s Note
Springer Nature remains neutral with regard to jurisdictional claims in published maps and institutional affiliations.