Abstract
This study was conducted to evaluate the alterations of some morphological and biochemical parameters of sunflower cultivars (‘08-TR-003’, ‘TR-3080’ and ‘TARSAN-1018’) under salt stress. For this aim, the seedling of sunflower cultivars was irrigated with tap water as a control, and with salinised water with 50, 150 and 250 mM NaCl for 30 days under controlled conditions. Salinity caused an apparent reduction in morphological parameters (plant height, leaf area, fresh weight, dry matter and water content) in all cultivars. Salt stress significantly (P<0.01) reduced the activity of glutathione reductase (GR) and ascorbate peroxidase (APX) activ-ities in all sunflower cultivars expect for superoxide dismutase (SOD) activity. According to our results, SOD seems to play a key role in the antioxidative process in salt treated sunflower plants. Proline and malondialdehyde contents were significantly (P<0.05) increased under salt stress in all cultivars. Among the cultivars, ‘TR-3080’ had greater values in terms of morphological (plant height, leaf area, fresh weight, water content) and biochemical [GR, APX and SOD (secondly) activities and proline contents] parameters. In the light of these findings, cv. ‘TR-3080’ seems to be less affected by salt stress.
Introduction
Biotic and abiotic stresses are the main problems of agricultur-al systems. Sagricultur-alinity is agricultur-also considered as a major abiotic stress and a significant factor affecting crop production all over the world (about 7% of arable lands of the world are under salinity pressure) and especially in arid and semi-arid regions (Bajehbaj, 2010). Throughout semi-arid regions of temperate climates, the most important oil-yielding crop is sunflower (Helianthus annuus L.) (Jabeen and Ahmad, 2012). Sunflower (Helianthus annuus L.), a species of the Asteraceae family, is an important annual economic (edible or oil-producing) oilseed crop that is ranked as the 4th
important vegetable oil crop after soybean, palm oil and rapeseed (Wen-Zhi et al., 2014; Achakzai et al., 2015; Bakhoum and Sadak, 2016). It is grown around the world and is a popular crop in coun-tries that have salt affected soils (Masor, 2011). The soil salinity level was the main limiting factor for vegetative growth of sun-flower (Ma et al., 2016). Sunsun-flower (Helianthus annuus L.) has been rated as moderately salt-resistant with no significant yield reduction up to 4.8 dS m−1, and variability for salt resistance has
been detected within this crop (Ceccoli et al., 2012; Machekposhti et al., 2017).
Salinity adversely affects important physiological processes and biochemical mechanisms, causes severe loss in crop produc-tivity worldwide (Per et al., 2017) and can cause some biochemi-cal changes in plant cell such as losing of cell turgor and the accu-mulation of reactive oxygen species (ROS) (Nxele et al., 2017). ROS including hydrogen peroxide (H2O2), superoxide anions (O2
•−), hydroxyl radical (OH•) and singlet oxygen (1O2) are
by-prod-ucts of physiological metabolisms, and are precisely controlled by enzymatic and non-enzymatic antioxidant defense systems (You and Chan, 2015). The main antioxidant enzymes include superox-ide dismutase (SOD), catalase, ascorbate peroxidase (APX), glu-tathione reductase (GR) and the activities of these enzymes are generally increased in plants under oxidative stress conditions (Bela et al., 2015; Vighi et al., 2017). One of the other cellular responses to saline conditions is the alteration of metabolism and production of compatible solutes (osmolytes) such as proline, which are distributed among different organisms (Mansour and Ali, 2017). The accumulation of proline (Pro) is one of the striking metabolic responses of plants to salt stress (Per et al., 2017). One of the cell parts where stress-related oxidative damage has the most effect is the cell membrane. As a result of oxidative damage, lipid peroxidation occurs in cell membranes and the permeability of the membrane is damaged. Lipid peroxidation can be measured with the help of malondialdehyde (MDA), which is a byproduct of this process (Koç, 2015). There are limited reports (Rios-Gonzalez et al., 2002) on the morphological and biochemical responses of sunflower to soil salinity. Therefore, this study was Correspondence: Ramazan Beyaz, Department of Soil Science and
Plant Nutrition, Faculty of Agriculture, Ahi Evran University, Bağbaşı, Kırşehir, Turkey.
E-mail: [email protected]
Key words: Sunflower; NaCl; antioxidant enzymes; proline; malondi-aldehyde.
Received for publication: 17 August 2017. Revision received: 8 November 2017. Accepted for publication: 10 November 2017. ©Copyright M. Taher et al., 2018
Licensee PAGEPress, Italy
Italian Journal of Agronomy 2018; 13:1096 doi:10.4081/ija.2018.1096
This article is distributed under the terms of the Creative Commons Attribution Noncommercial License (by-nc 4.0) which permits any non-commercial use, distribution, and reproduction in any medium, provid-ed the original author(s) and source are crprovid-editprovid-ed.
Morphological and biochemical changes in response to salinity
in sunflower (
Helianthus annus
L.) cultivars
Mehdi Taher,
1Ramazan Beyaz,
2Marieh Javani,
1Mehtap Gürsoy,
3Mustafa Yildiz
11
Department of Field Crops, Graduate School of Natural and Applied Sciences, Ankara University, Dışkapı,
Ankara;
2Department of Soil Science and Plant Nutrition, Faculty of Agriculture, Ahi Evran University,
Bağbaşı, Kırşehir;
3Güzelyurt Vocational School, Aksaray University, Güzelyurt, Aksaray, Turkey
Non-commercial
conducted to evaluate the alterations of some morphological and biochemical parameters of different sunflower cultivars under salt stress.
Materials and methods
Plant material
Oil type sunflower cultivars ‘08-TR-003’, ‘TR-3080’ and ‘TARSAN-1018’ obtained from Trakya Agricultural Research Institute were used in the study.
NaCl experiments, planting and plant development
For each NaCl concentration and genotype, four replicates were tested, and there was one plant per replication. 500 mL pots were used in all experiments and one seed was sown in each pot. After sowing, each pot was irrigated with 50 mL tap water. After one week from sowing, pots were irrigated with 50 mL tap water containing different NaCl concentrations (0-control, 50, 150 and 250 mM) for four weeks. Tap water without NaCl was used as a control. All experiments were conducted in the controlled growth chamber for incubation at 24°±1°C under cool white fluorescent light (27 mmol m–2s–1) with a 16 h light/8 h dark photoperiod.
Morphological characters
After sowing, seeds were irrigated with 50 mL tap water for 10 days. First NaCl treatments began after these 10 days. Plantlets were watered with tap water (50 mL) containing different NaCl concentrations (0-control, 50, 150 and 250 mM) every two days. The application continued for 30 days, and then measurements were made. Fresh weight (g) of leaves was measured with a preci-sion scale. Dry weights were measured after drying samples at 70ºC for 48 h in an oven. Water content was calculated with the following formula:
(1) Percentages of dry matter and water content were measured with the following formulas:
(2) (3)
Biochemical observation
Measurement of antioxidant enzymes
To determine the enzyme changes in plants under salt stress, approximately 1 g of fresh leaf samples in liquid nitrogen were ground up in porcelain mortars and homogenised with 10 mL of a 50-mM phosphate buffer solution containing 0.1 mM of Na-EDTA (pH 7.6). Homogenised samples were centrifuged at 15,000 rpm for 15 min and the resultant precipitates were used in enzyme anal-yses. Samples were kept at +4°C until the enzyme analyses were performed. For the enzyme measurements, final volumes were obtained using the buffer solution.
Superoxide dismutase activity
Superoxide dismutase activity was determined by using the method proposed by Cakmak and Marschner (1992), and Cakmak (1994), based on the reduction of nitro blue tetrazolium chloride (NBT) by O2- under light. All the solutions were added into the
reaction medium: first, 0.1 mM of Na-EDTA containing 50 mM (pH: 7.6) phosphate (P) buffer, then, the enzyme extract (25 to 100 µL) followed by 0.5 mL of 50 mM Na2CO3(pH of 10.2), 0.5 mL of
12 mM of L-methionine, 0.5 mL of 75 µm of p-NBT and 10 µm of riboflavin were each added into the medium so that the final vol-ume of the medium was 5 mL. The samples were kept under light for 15 min and measurements were carried out at 560 nm.
Ascorbate peroxidase activity
Ascorbate peroxidase activity was measured by using the method proposed by Cakmak and Marschner (1992), and Cakmak (1994), based on the oxidation of ascorbate at 290 nm (E = 2.8 mM cm−1). By following the method, the final volume of the reaction
medium was adjusted to 1 mL by adding 0.1 mM of EDTA con-taining a 50-mM phosphate buffer (pH of 7.6), 0.1 mL of 10 mM of EDTA containing 12 mM of H2O2, 0.1 mL of 0.25 mM of
L-ascorbic acid and enzyme extract into the medium, and then the ascorbate concentration was measured at 290 nm using spec-trophotometry.
Glutathione reductase activity
Glutathione reductase activity was measured with the method proposed by Cakmak and Marschner (1992), and Cakmak (1994), based on the oxidation of NADPH at 340 nm (E = 6.2 mM cm−1).
By following the method, the final volume of the reaction medium was adjusted to 1 mL by adding 0.1 mM of EDTA containing a 50-mM phosphor buffer (pH of 7.6), 0.1 mL of 0.5 50-mM of oxidised glutathione, 0.1 mL of 0.12 mM of NADPH and enzyme extract into the medium, and then the NADPH oxidation was measured at 340 nm.
Measurement proline and lipid oxidation (malondialdehyde content)
The proline assay was based on the method of Bates et al. (1973), which uses 3% sulfosalicylic acid for grinding the fresh plant samples. The ninhydrin reagent was added to the tubes con-taining the ground sample, which were then placed in a water bath at 100°C for 1 h. After cooling, 4 mL of toluene were added to the samples. The samples were measured at 520 nm. MDA was deter-mined according to Lutts et al. (1996). Briefly, 5 mL trichloroacetic acid (0.1%) were added to the sample of 200 mg fresh leaves, and then centrifuged at 12,500 rpm for 20 min; 3 mL supernatant were taken from 5 mL extracts. Three milliliters of 0.1% thiobarbituric acid in 20% trichloroacetic acid (w/v) were added to an equal amount of each of the supernatants. The A-absorbance of the samples was measured using a spectrophotome-ter at 532 and 600 nm.
Statistical analysis
The experimental design was completely randomised design with four replications. Each treatment was arranged in 500 mL pots containing 5 plants. For all investigated parameters, Analysis of Variance was performed by using the SPSS for Windows computer software. Means of treatments were com-pared with Duncan’s multiple range test by using ‘MSTAT-C’ computer software. Data given in percentages were subjected to arcsine (√X) transformation before statistical analysis (Snedecor and Cochran, 1967).
Non-commercial
Results and discussion
The obtained results presented in Tables 1-4 show that, salt stress significantly reduced all growth characters (plant height, leaf area, fresh weight, dry matter and water contents) of the three sun-flower cultivars (‘08-TR-003’, ‘TR-3080’ and ‘TARSAN-1018’). Results of two-way ANOVA in the characters of plant height and leaf surface area showed that there were statistically significant (P<0.01) interactions between cultivars and salt concentrations while interaction between cultivars and salt concentrations in fresh weight was significant at 0.05 level (Table 1). From the mean data, it is apparent that cv. ‘TR-3080’ had greater plant height (21.33 cm) and fresh weight (7.47 g) than the other cultivars at the highest NaCl concentration (250 mM) (Table 2). Leaf area is a good indi-cator of water and salinity stress (Kumar et al., 2014). In the pre-sent study, salt stress significantly (P<0.01) reduced leaf area of the three sunflower cultivars (‘08-TR-003’, ‘TR-3080’ and ‘TARSAN-1018’) (Figure 1). The highest value (45.46 mm2, 43%
decrease when compared to control) was registered in cv. ‘TR-3080’ at the highest NaCl concentration (250 mM). 34.42 mm2and
26.32 mm2were recorded in cv. ‘08-TR-003’ and ‘TARSAN-1018’
with 49% and 65% decreasing rate, respectively (Table 2). Adverse effects of salt stress on leaf area of sunflower have also been reported by several authors (Rivelli et al., 2010; Achakzai et al., 2015; Khan et al., 2016). Data related to fresh weight showed that the results dramatically decreased by increasing salt concentrations in all cultivars. The highest results regarding fresh weight were recorded at all salt concentrations from cv. ‘TR-3080’ (Table 2). Lower fresh weight at higher salt concentrations was due to decreasing water absorption (Prado et al., 1995). It was reported that fresh weight increase was based on cell enlargement due to water intake, cell vacuolation and turgor-driven wall expansion (Dale, 1988).
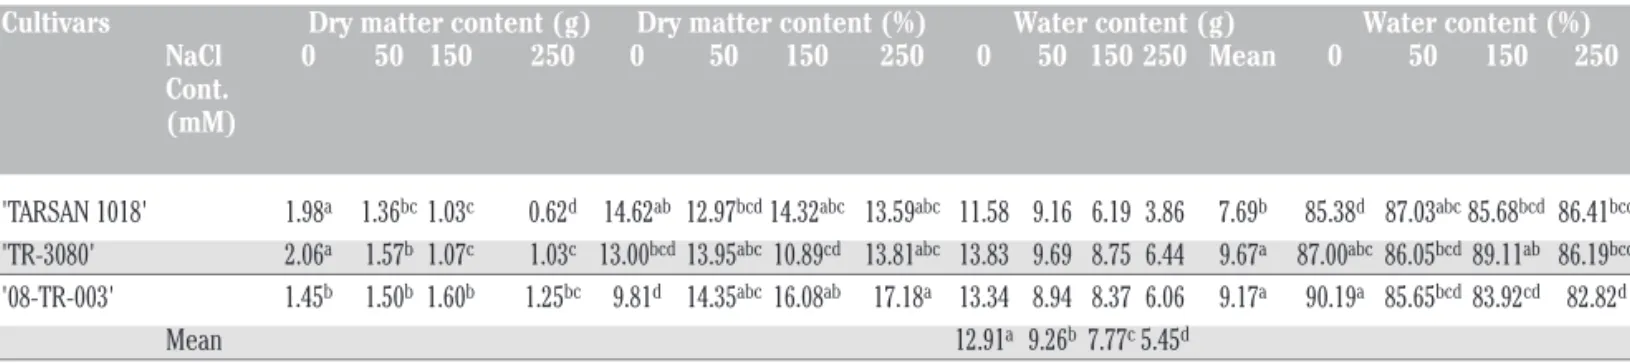
There were statistically significant interactions between culti-vars and salt concentrations on dry matter content, dry matter
per-centage and water content perper-centage at 0.01 level (Table 3). Since no interaction was determined between cultivars and salt concen-trations in water content, the effects of these factors was analysed separately (Table 3). Both factors (cultivars and salt concentra-tions) affected water content significantly at 0.01 level. In term of dry matter, the highest value was registered in cv. ‘TARSAN-1018’ with 1.25 g (13% decrease compare to control) at 250 mM NaCl. The dry matter of cv. ‘TR-3080’ and ‘08-TR-003’ was 1.03 g (50%
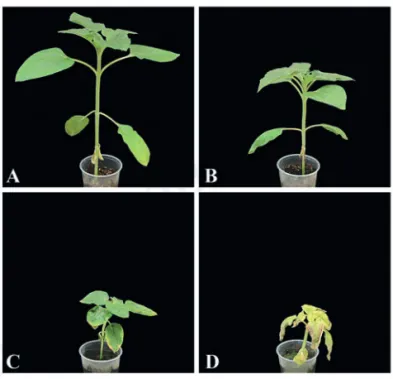
Figure 1. The effect of different salt concentrations on seedling growth of sunflower cv. 'TARSAN 1018'. A) 0 mM (control); B) 50 mM; C) 150 mM; and D) 250 mM.
Table 1. Results of two-way ANOVA of the effect of different cultivars and salt concentrations on plant height, leaf surface area and fresh weight.
Source Plant height (cm) Leaf surface area (mm2) Fresh weight (g) df Sum Mean F Sig. Sum Mean F Sig. Sum Mean of squares square of squares square of squares square F Sig. Corrected model 11 840.3 76.4 32.9 0.000 8981.5 816.5 101.1 0.000 370.8 33.7 54.4 0.000 Intercept 1 17,689.0 17,689.0 7626.4 0.000 111,915.9 111,915.9 13,862.3 0.000 3765.7 3765.7 6077.5 0.000 Cultivar 2 296.2 148.1 63.8 0.000 1035.9 518.0 64.2 0.000 31.0 15.5 25.1 0.000 Salt 3 484.9 161.6 69.7 0.000 7642.5 2547.5 315.5 0.000 330.1 110.0 177.6 0.000 Cultivar * Salt 6 59.3 9.89 4.3 0.005 303.1 50.5 6.3 0.000 9.7 1.6 2.6 0.043 Error 24 55.7 2.3 193.8 8.1 14.8 0.6 Total 36 18,585.0 121,091.2 4151.4 Corrected total 35 896.000 9175.3 385.7
Table 2. The effect of different cultivars and salt concentrations on plant height, leaf surface area, fresh weight in sunflower.
Cultivars NaCl Plant height (cm) Leaf surface area (mm2) Fresh weight (g) Cont. (mM) 0 50 150 250 0 50 150 250 0 50 150 250 'TARSAN 1018' 24.83bc 21.50cd 19.17de 12.83f 75.33ab 62.67cd 44.79e 26.32g 13.56b 10.52c 7.22d 4.48e
'TR-3080' 33.33a 26.00b 24.00bc 21.33cd 81.17a 69.00bc 57.71d 45.46e 15.89a 11.26c 9.82c 7.47d
'08-TR-003' 23.33bc 22.00cd 21.00cd 16.67e 67.13c 57.00d 48.08e 34.42f 14.79ab 10.44c 9.97c 7.31d a-eValues in a row and in a column (for water content in g) followed by the different letters are significantly different at the 0.01 level.
Non-commercial
decrease) and 0.62 g (68%decrease), respectively (Table 4). According to Nobre et al. (2010) salinity affects the plant dry mat-ter production because the high salt concentrations at the root zone decrease water availability. Sunderland (1960) reported that dry weight content of the leaf depended on cell division and new mate-rial synthesis. However, it was reported that one of the reasons of dry matter decrease in sunflower cultivars was salt stress (Rivelli et al., 2010; Maia et al., 2016; Khan et al., 2016). The highest water content was observed in the cv. ‘TR-3080’ (6.44 g, 53% decrease compare to control) at 250 mM NaCl. The water content of cv. ‘08-TR-003’ and ‘TARSAN-1018’ was 6.06 g (54% decrease) and 3.06 g (66% decrease) at 250 mM NaCl, respective-ly (Table 2). Jabeen and Ahmad (2012) stated that imposition of salt stress also had adverse effects on relative leaf water content in sunflower. Overall, decrease in growth is one of the most common-ly observed symptoms in plants grown in saline environments and has been well documented some sunflower cultivars (Steduto et al., 2000; Rios-Gonzales et al. 2002; Hussain et al., 2012). Water content in g decreased significantly by increasing salt concentra-tions. The highest water was noted in control treatment, while the lowest values were obtained from 250 mM NaCl treatment. Lower levels of all parameters at higher NaCl concentrations could be attiributed to the decreasing amount of water absorption from the soil and consequently, to a reduced uptake of solutes due to lower osmotic pressure of the roots. The inhibition of growth under water stress conditions hinders cell division and elongation (Hsia, 1973). Osmotic stress hinders cell wall extension (Van Volkenburg and Boyer, 1985). Karmoker and Van Steveninck (1979) stated that stress-induced growth reduction could be due to changes in mem-brane permeability and water absorption.
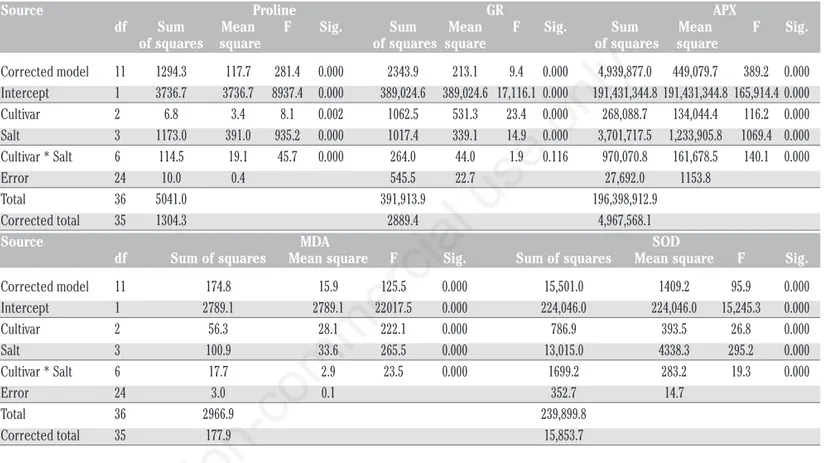
Statistical analysis showed that there were statistically
signifi-cant (P<0.01) interactions between cultivars and salt concentra-tions in proline and lipid peroxidation (MDA) contents, activity of ascorbate peroxidase and superoxide dismutase. In glutathione reductase activity, no interaction was observed between cultivars and salt concentrations. That was because the effect of these fac-tors was analysed separately. The effects of cultivars and salt con-centrations on glutathione reductase activity were found statistical-ly significant at 0.01 level (Table 5). Our results show that increas-ing the NaCl concentration significantly reduced the activity of GR and APX activities in all sunflower cultivars except for SOD activ-ity compared to control (Table 6). GR is a potential enzyme of the ASH-GSH cycle and plays an essential role in the defense system against ROS by sustaining the reduced status of GSH (Gill and Tuteja, 2010). The highest activity of GR was observed in ‘TR-3080’ (102.78 mmol min–1mg–1FW, 8.51% decrease compared to
control) at highest NaCl concentration (250 mM). However, GR activities were 96.00 and 94.00 unit–1min–1 mg FW in
‘TARSAN1018’ and ‘08-TR-003’, respectively. The percentage decreases were 17.64% and 8.05% at 250 mM NaCl concentration in ‘TARSAN1018’ and ‘08-TR-003’, respectively. The first enzyme of the ascorbate-glutathione cycle, APX, plays a vital role in the elimination of H2O2 (Vighi et al., 2017). At 250 mM NaCl
level, the highest activity of APX (2730.96 mmol min–1mg–1FW)
was recorded in cv. ‘TR-3080’ in control treatment. However, APX activities were 1759.73 and 1532.99 mmol min–1mg–1FW in
‘08-TR-003’ and ‘TARSAN1018’, respectively. Accelerated salt stress reduced APX activities by 35.57% and 12.39%, in ‘08-TR-003 and ‘TARSAN1018’, respectively. In an oxidative defense system, SOD has an important role in the first dismutation ROS. Unlike the other enzymes, our results show that SOD activity increases with increasing NaCl concentrations in all cultivars (Table 6). The
high-Table 3. Results of two-way ANOVA of the effect of cultivars and salt concentrations on the contents of dry matter and water.
Source Dry matter content (g) Dry matter content (%) Water content (g) Water content (%) df Sum Mean F Sig. Sum Mean F Sig. Sum Mean F Sig. Sum Mean F Sig. of square of square of square of square
squares squares square square
Corrected model 11 5.6 0.5 22.8 0.000 93.5 8.5 5.9 0.000 296.8 27.0 52.1 0.000 93.5 8.5 5.9 0.000 Intercept 1 68.2 68.3 3040.2 0.000 16,905.1 16,905.1 11,686.0 0.000 2820.3 2820.3 5449.7 0.000 168,060.7 168,060.7 116,175.1 0.000 Cultivar 2 0.3 0.2 6.8 0.005 8.6 4.3 3.0 0.070 25.5 12.7 24.6 0.000 8.6 4.3 3.0 0.070 Salt 3 3.7 1.2 54.5 0.000 17.8 5.9 4.1 0.017 264.4 88.1 170.3 0.000 17.8 5.9 4.1 0.017 Cultivar * Salt 6 1.6 0.3 12.3 0.000 67.1 11.2 7.7 0.000 6.9 1.2 2.2 0.075 67.1 11.2 7.7 0.000 Error 24 0.5 0.02 34.7 1.4 12.4 0.5 34.7 1.4 Total 36 74.4 17,033.4 3129.5 168,188.9 Corrected total 35 6.2 128.3 309.2 128.2
Table 4. The effect of different cultivars and salt concentrations on dry matter and water content in sunflower.
Cultivars Dry matter content (g) Dry matter content (%) Water content (g) Water content (%) NaCl 0 50 150 250 0 50 150 250 0 50 150 250 Mean 0 50 150 250 Cont.
(mM)
'TARSAN 1018' 1.98a 1.36bc 1.03c 0.62d 14.62ab 12.97bcd 14.32abc 13.59abc 11.58 9.16 6.19 3.86 7.69b 85.38d 87.03abc 85.68bcd 86.41bcd
'TR-3080' 2.06a 1.57b 1.07c 1.03c 13.00bcd 13.95abc 10.89cd 13.81abc 13.83 9.69 8.75 6.44 9.67a 87.00abc 86.05bcd 89.11ab 86.19bcd
'08-TR-003' 1.45b 1.50b 1.60b 1.25bc 9.81d 14.35abc 16.08ab 17.18a 13.34 8.94 8.37 6.06 9.17a 90.19a 85.65bcd 83.92cd 82.82d
Mean 12.91a 9.26b 7.77c5.45d a-dValues in a row and in a column (for water content in g) followed by the different letters are significantly different at the 0.01 level.
Non-commercial
est SOD activity (85.46 mmol min–1mg–1FW, 78.04% increase
compared to control) was registered in cv. ‘TARSAN1018’ under high salt stress (250 mM). However, the lowest activity of SOD (80.21 mmol min–1mg–1FW) was obtained from ‘TR-3080’ at the
same salt concentration. SOD activities increased by 78.0%, 42.1% and 43.4% in ‘TARSAN1018’, ‘TR-3080’ and ‘08-TR-003’, respectively. Many changes have been detected in the activ-ities of antioxidant enzymes in plants under salinity. The activity of antioxidant enzymes was reported to increase under saline condi-tions in the case of safflower (Siddiqi et al., 2011; Çulha Erdal and Çakirlar, 2014) and sunflower (Rios-Gonzales et al., 2002; Jabeen
and Ahmad, 2012). According to our results, SOD seems to be more sensitive in the antioxidative process of salt stressed sun-flower plants and more active in cv. “TARSAN1018”.
Proline concentration has been often suggested as an indicator of osmotic stress (Khalil et al., 2016). Proline accumulation under salt stress has been correlated with salt tolerance (Mansour and Ali, 2017). In this investigation, the findings showed that salt stress (from 0 mM to 250 mM NaCl) considerably enhanced the leaf free proline contents of all sunflower cultivars (Table 6). However, the cultivars differed significantly in proline content. Among the culti-vars, ‘TR-3080’ accumulated considerably more proline (16.70
Table 6. The effect of cultivars and salt concentrations on the activity of antioxidant enzymes (GR, APX and SOD) (unit/min./mg fresh weight) and proline content (µmol/g fresh weight) with lipid peroxidation (MDA, µmol/g fresh weight) in sunflower.
Cultivars Proline GR APX
NaCl 0 50 150 250 0 50 150 250 Mean 0 50 150 250 Cont. (mM) 'TARSAN 1018' 1.11h 10.39f 14.99c 12.99d 116.56 114.11 103.33 96.00 107.50a 2676.82ab 2514.38c 2345.18d 1532.99h 'TR-3080' 1.96h 5.65g 18.90a 16.70b 112.33 109.89 107.22 102.78 108.06a 2626.06b 2494.08c 2348.56d 2233.50e '08-TR-003' 1.03h 11.31ef 14.82c 12.40de 102.22 99.67 89.22 94.00 96.28b 2730.96a 2538.07c 1871.40f 1759.73g Mean 110.37a 107.89a 99.92b 97.59b MDA SOD NaCl 0 50 150 250 0 50 150 250 Cont. (mM) 'TARSAN 1018' 6.50h 7.66fg 7.47fg 9.13cd 48.00h 72.15de 95.82b 85.46c 'TR-3080' 8.56de 11.23b 9.73c 12.68a 56.45gh 77.33cd 128.00a 80.21cd '08-TR-003' 4.79 8.27ef 7.34g 12.10a 58.18fg 65.63ef 96.00b 83.44c a-hValues in a row and in a column (for glutathione reductase activity) followed by the different letters are significantly different at the 0.01 level.
Table 5. Results of two-way ANOVA of the effect of cultivars and salt concentrations on proline content, activities of glutathione reduc-tase (GR), ascorbate peroxidase (APX), lipid peroxidase (MDA) and superoxide dismureduc-tase (SOD).
Source Proline GR APX df Sum Mean F Sig. Sum Mean F Sig. Sum Mean F Sig. of squares square of squares square of squares square Corrected model 11 1294.3 117.7 281.4 0.000 2343.9 213.1 9.4 0.000 4,939,877.0 449,079.7 389.2 0.000 Intercept 1 3736.7 3736.7 8937.4 0.000 389,024.6 389,024.6 17,116.1 0.000 191,431,344.8 191,431,344.8 165,914.4 0.000 Cultivar 2 6.8 3.4 8.1 0.002 1062.5 531.3 23.4 0.000 268,088.7 134,044.4 116.2 0.000 Salt 3 1173.0 391.0 935.2 0.000 1017.4 339.1 14.9 0.000 3,701,717.5 1,233,905.8 1069.4 0.000 Cultivar * Salt 6 114.5 19.1 45.7 0.000 264.0 44.0 1.9 0.116 970,070.8 161,678.5 140.1 0.000 Error 24 10.0 0.4 545.5 22.7 27,692.0 1153.8 Total 36 5041.0 391,913.9 196,398,912.9 Corrected total 35 1304.3 2889.4 4,967,568.1 Source MDA SOD
df Sum of squares Mean square F Sig. Sum of squares Mean square F Sig. Corrected model 11 174.8 15.9 125.5 0.000 15,501.0 1409.2 95.9 0.000 Intercept 1 2789.1 2789.1 22017.5 0.000 224,046.0 224,046.0 15,245.3 0.000 Cultivar 2 56.3 28.1 222.1 0.000 786.9 393.5 26.8 0.000 Salt 3 100.9 33.6 265.5 0.000 13,015.0 4338.3 295.2 0.000 Cultivar * Salt 6 17.7 2.9 23.5 0.000 1699.2 283.2 19.3 0.000 Error 24 3.0 0.1 352.7 14.7 Total 36 2966.9 239,899.8 Corrected total 35 177.9 15,853.7
Non-commercial
use
only
µmol/g FW, 752.04% increase compared to control) than the other sunflower cultivars (‘TARSAN1018’ with 12.99 µmol/g FW, 1070.27% increase compared to control and ‘08-TR-003’ with 12.40 µmol/g FW, 1103.88% increase compared to control) under saline conditions. The results of this study are also in agreement with Shahbaz et al. (2011), Jabeen and Ahmad (2012) and Bakhaum and Sadak (2016), who emphasised that salt stress markedly enhanced free proline contents in sunflower cultivars. However, our result showed that there is a negative relationship of morphological traits (plant height, leaf area, fresh weight, dry mat-ter and wamat-ter contents) with proline accumulation in all sunflower cultivars (Table 6). Khalil et al. (2016), stated that the negative relationship with morphological traits indicated that proline con-centration may not be related with enhancing growth in sunflower but could increase survivability under stress contributing to the osmotic adjustment, and could participate in rapid recovery.
Lipid molecules, specifically unsaturated lipids, are sensitive to oxidation by ROS (Rasool et al., 2013). Membrane lipid perox-idation is often used as a marker of an adverse effect of oxidative stress (Ozturk et al., 2012). In the present study, the results of sun-flower cultivars showed that with increasing levels of salt stress, MDA content increased (Table 6). The lowest MDA content (9.13 µmol/g FW, 40.46% increase compared to control) was record in cv. ‘TARSAN-1018’, while the highest value (12.68 µmol/g FW, 48.13% increase compared to control) was registered in cv. ‘TR-3080’ at 250 mM NaCl concentration. For cv. ‘08-TR-003’, MDA content was 12.10 µmol/g FW with a 152.6% increase. The find-ings are in agreement with those obtained by Jabeen and Ahmad (2012) in sunflower. In particular, SOD constitutes the end product of peroxidation of membrane lipids and is the first line of defense against ROS (Hussain et al., 2016). Our result indicated that the lowest MDA content (9.13 µmol/g FW) and the highest activity (85.46 mmol min–1 mg–1 FW) of SOD were obtained from cv.
‘TARSAN-1018’. The reason of the lowest MDA content in cv. ‘TARSAN-1018’ may due to the high activity of SOD.
Conclusions
The results from this investigation allow to conclude that there are differences in the response to salt stress among sunflower cul-tivars. In term of morphological (plant height, leaf area, fresh weight, water content) and biochemical [GR, APX and SOD (sec-ondly) activities and proline contents] parameters, cv. ‘TR-3080’ seems to be less affected from salt stress. Interestingly and unlike other study about the relationship between salt stress and antioxi-dant enzyme activities, we observed a decreasing activity of the two antioxidant enzymes (GR and APX) under salt stress condi-tions. On the other hand, similarly with the other studies in the lit-erature, an increased activity was detected for SOD in all cultivars. As concerns these findings, cv. ‘TR-3080’ seems to be less affected by salt stress.
References
Achakzai AKK, Ur RM, Yaqoob M, Sarangzai AM, Barozai MYK, Din M, 2015. Stem and leaf response of sunflower hybrids to salt stress. Pak. J. Bot. 47:2063-7.
Bajehbaj AA, 2010. The effects of NaCl priming on salt tolerance in sunflower germination and seedling grown under salinity
conditions. Afr. J. Biotechnol. 9:1764-70.
Bakhoum GSH, Sadak MS, 2016. Physiological role of glycine betaine on sunflower (Helianthus annuus L.) plants grown under salinity stress. Int. J. Chem. Tech Res. 9:158-71. Bates LS, Waldren RP, Teare ID, 1973. Rapid determination of free
proline for water stress studies. Plant Soil 39:205-7.
Bela K, Horvatha E, Gallea A, Szabadosb L, Tari I, Csiszara J, 2015. Plant glutathione peroxidases: Emerging role of the antioxidant enzymes in plant development and stress respons-es. J. Plant Physiol. 176:192-201.
Cakmak I, Atlı M, Kaya R, Evliya H, Marschner H, 1994. Association of high light and zinc deficiency in cold-induced leaf chlorosis in grapefruit and mandarin trees. J. Plant Physiol. 146:355-60.
Cakmak I, Marschner H, 1992. Magnesium deficiency and high-light intensity enhance activities of superoxide dismutase, ascorbate peroxidase and glutathione reductase in bean leaves. Plant Physiol. 98:1222-6.
Ceccoli G, Senn ME, Bustos D, Ortega LI, Córdoba A, Vegetti A, Taleisnik E, 2012. Genetic variability for responses to short-and long-term salt stress in vegetative sunflower plants. J. Plant Nutr. Soil Sci. 175:882-90.
Çulha Erdal Ş, Çakirlar H, 2014. Impact of salt stress on photosys-tem II efficiency and antioxidant enzyme activities of safflow-er (Carthamus tinctorius L.) cultivars. Turk J Biol. 38:549-60. Dale JE, 1988. The control of leaf expansion. Annu. Rev. Plant
Physiol. 39:267-95.
Gill SS, Tuteja N, 2010. Reactive oxygen species and antioxidant machinery in abiotic stress tolerance in crop plants. Plant Physiol. Biochem. 48:909-30.
Hsia TC, 1973. Plant responses to water stress. Annu. Rev. Plant Physiol. 24:219-70.
Hussain M, Farooq M, Shehzad M, Khan MB, Wahid A, Shabir G, 2012. Evaluating the Performance of Elite Sunflower Hybrids under Saline Conditions. Int. J. Agric. Biol. 14:131-5. Hussain MI, Lyra DA, Farooq M, Nikoloudakis N, Khalid N,
2016. Salt and drought stresses in safflower: a review. Agron. Sustain. Dev. 36:4.
Jabeen N, Ahmad R, 2012. Improvement in growth and leaf water relation parameters of sunflower and safflower plants with foliar application of nutrient solutions under salt stress. Pak. J. Bot. 44:341-5.
Karmoker JL, Van Steveninck FM, 1979. The effect of abscisic acid on the uptake and distribution of ions in intact seedlings of Phaseolus vulgaris cv. Redland Pioneer. Physiol. Plant. 45:453-9.
Khalil F, Rauf S, Monneveux P, Anwar S, Iqbal Z, 2016. Genetic analysis of proline concentration under osmotic stress in sun-flower (Helianthus annuus L.). Breed. Sci. 66:463-70. Khan WM, Khan MS, Karim S, Umar N, Sajjad A, 2016. Effect of
salt stress on some morphological and biochemical character-istics of sunflower (Samsung-600). Pure Appl. Biol. 5:653-63. Koç A, 2015. Effect of plant growth-promoting bacteria and arbus-cular mycorrhizal fungi on lipid peroxidation and total pheno-lics of strawberry (Fragaria × ananassa ‘San Andreas’) under salt stress. Turk. J. Agric For. 39:992-8.
Kumar S, Ahmad A, Rao V, Masood A, 2014. Effect of salinity on growth and leaf area of sunflower (Helianthus annuus L.) cv. Suntech-85. Afr. J. Agric. Res. 9:1144-50.
Lutts S, Kinet JM, Bouharmont Kinet, Bouharmont J, 1996. NaCl-Induced senescence in leaves of rice (Oryza sativa l.) cultivars differing in salinity resistance. Ann. Bot. 78:389-98.
Ma T, Zeng W, Li Q, Wu J, Huang J, 2016. Effects of water, salt
Non-commercial
and nitrogen stress on sunflower (Helianthus annuus L.) at dif-ferent growth stages. J. Soil Sci. Plant Nutr. 16:1024-37. Machekposhti MF, Shahnazaria A, Ahmadia M., Aghajania G,
Ritzemab H, 2017. Effect of irrigation with sea water on soil salinity and yield of oleic Sunflower. Agricult. Water Manage. 188:69-78.
Maia FMA, Costa AC, de Castro JN, Megguer CA, Soares FAL, 2016. Photosynthesis and water relations of sunflower culti-vars under salinity conditions. Afr. J. Agric. Res. 11:2817-24. Mansour MMF, Ali EF, 2017. Evaluation of proline functions in
saline conditions. Phytochemistry 140:52-68.
Masor LL, 2011. Determining salt tolerance among sunflower genotypes. (Msc. Thesis). Texas A&M University.
Nobre RG, Gheyi HR, Correia KG, Soares FAL, Andrade LO, 2010. Crescimento e floração do girassol sob estresse salino e adubação nitrogenada. Rev. Ciênc. Agron. 41:358-65. Nxele X, Klein A, Ndimba BK, 2017. Drought and salinity stress
alters ROS accumulation, water retention, and osmolyte con-tent in sorghum plants. S. Afr. J. Bot. 108:261-6.
Ozturk L, Demir Y, Unlukara A, Karatas I, Kurunc A, Duzdemir O, 2012. Effects of long-term salt stress on antioxidant system, chlorophyll and proline contents in pea leaves. Roman. Biotechnol. Lett. 17:7227-36.
Per TS, Khan NA, Reddy PS, Masood A, Hasanuzzaman M, Iqbal M, Khan R, Anjum NA, 2017. Approaches in modulating pro-line metabolism in plants for salt and drought stress tolerance: Phytohormones, mineral nutrients and transgenics. Plant Physiol. Biochem. 115:126-40.
Prado FE, Gonzalez JA, Gallardo M, Moris M, Boero C, Kortsarz A, 1995 Changes in soluble carbohydrates and invertase activ-ity in Chenopodium quinoa (“quinoa”) developed for saline stress during germination. Curr. Top. Phytochem. 14:1-5. Rasool S, Ahmad A, Siddiqi TO, Ahmad P, 2013. Changes in
growth, lipid peroxidation and some key antioxidant enzymes in chickpea genotypes under salt stress. Acta Physiol. Plant. 35:1039-50.
Rios-Gonzalez K, Erdei L, Lips SH, 2002. The activity of antioxi-dant enzymes in maize and sunflower seedlings as affected by salinity and different nitrogen sources. Plant Sci. 162:923-30. Rivelli AR, De Maria S, Pizza S, Gherbin P, 2010. Growth and
physiological response of hydroponically-grown sunflower as affected by salinity and magnesium levels. J. Plant Nutr. 33:1307-23.
Shahbaz M, Ashraf M, Akram NA, Hanif A, Hameed S, Joham S, Rehman R, 2011. Salt-induced modulation in growth, photo-synthetic capacity, proline content and ion accumulation in sunflower (Helianthus annuus L.). Acta Physiol. Plant. 33:1113-22.
Siddiqi EH, Ashraf M, Al-Qurainy F, Akram NA, 2011. Salt-induced modulation in inorganic nutrients, antioxidant enzymes, proline content and seed oil composition in safflower (Carthamus tinctorius L.). J Sci. Food Agric. 91:2785-93. Snedecor GW, Cochran WG, 1967. Statistical Methods. The Iowa
State University Press, Iowa, USA.
Steduto P, Albrisio R, Giorio P, Sorrentino G, 2000. Gas-exchange response and stomatal and non-stomatal limitations to carbon assimilation of sunflower under salinity. Environ. Exp. Bot. 44:243-55.
Sunderland N, 1960. Cell division and expansion in the growth of the leaf. J. Exp. Bot. 11:68-80.
Van Volkenburg E, Boyer JS, 1985. Inhibitory effects of water deficit on maize leaf elongation. Plant Physiol. 77:190-4. Vighi IL, Benitez LC, Amaral MN, Moraes GP, Auler PA,
Rodrigues GS, Deuner S, Maia LC, Braga EJB, 2017. Functional characterisation of the antioxidant enzymes in rice plants exposed to salinity stress. Biol. Plant. 61:540-50. Wen-Zhi Z, Chi X, Jing-Wei W, Jie-Sheng H, Qiang Z, Mou-Song
W, 2014. Impacts of salinity and nitrogen on the photosynthet-ic rate and growth of sunflowers (Helianthus annuus L.). Pedosphere 24:635-44.
You J, Chan Z, 2015. ROS regulation during abiotic stress respons-es in crop plants. Front. Plant Sci. 6:1-15.