COMPARING URBAN OCCUPATIONAL STRUCTURES FROM THE
OTTOMAN EMPIRE TO THE TURKISH REPUBLIC WITH IMPERIAL
RUSSIA TO THE USSR
Thesis submitted to the Institute of Social Sciences In partial fulfillment of the requirements for the degree of
Master of Arts in History
by
UYGAR KARACA
ISTANBUL BILGI UNIVERSITY
SEPTEMBER 2015
i
Abstract of the thesis submitted by Uygar Karaca, for the degree of Master of Arts in History
to be taken in September 2015 from the Institute of Social Sciences
Title: Comparing Urban Occupational Structures from the Ottoman Empire to the Turkish Republic with Imperial Russia to the USSR
In this thesis project the alleged association between the industrialization and occupational transformation in late context of late imperial and early Soviet Russia as well as late Ottoman and early Republican Turkey would be examined.
The relevant occupational data for hereby analysis is obtained from; for Ottoman/Turkish side, 1845 Tax Survey records, 1927, 1935 and 1945 General Census records and for Tsarist Russia/Soviet side, 1897 Russian General Census and 1926 Soviet Census.
This analysis would be undertaken for city-level data and the relevant cities are, from the Ottoman/Turkish side, Bursa and Ankara and for Russian/Soviet side, Ivanovo and Ekaterinburg. The main inquiry would be whether industrialization process goes parallel with occupational transformation, which was supposed to move on a uni-linear line; that is, the majority of labor force would move from primary to secondary and secondary to tertiary sector activities by their occupations.
The main motivation would be to explore more on how different industrialization experiences entail different variations of occupational transformation patterns. Both Ottoman/Turkish and Russian/Soviet industrialization cases were thought to be examples of 'belated industrialization' and hence our analysis could provide us wider perspectives on the varieties of industrialization process. In this thesis project, as a tool of analysis, PSTI classifying system would be used in order to establish a common line in order to compare these four different cases. PSTI is a globally acknowledged occupational classifying system for various levels. In this thesis, two levels of analysis, PSTI First and Second Digit would be employed. The results that have been obtained in this thesis would imply remarks for both relevant local contexts and from a wider perspective, the industrialization process and the great divergence literature.
ii
Sosyal Bilimler Enstitüsü’nde Tarih Yüksek Lisans derecesi için Uygar Karaca tarafından Eylül 2015’te teslim edilen tezin özeti.
Başlık: Osmanlı İmparatorluğu'ndan Türkiye Cumhuriyeti'ne, Rus İmparatorluğu'ndan SSCB'ye Şehirsel Meslek Yapıları Üzerine Bir Karşılaştırma
İşbu Yüksek Lisans tezinde, endüstriyelleşme ve mesleki dönüşüm arasındaki ilişki, geç Osmanlı İmparatorluğu'dan erken Türkiye Cumhuriyeti yılları ve buna paralel olarak, geç Çarlık Rusya'sından erken SSCB yılları bağlamında incelendi.
Bu incelemede, gerekli meslek verisine ulaşmak için Osmanlı İmparatorluğu-Türkiye Cumhuriyeti tarafından 1845 Temettuat kayıtları, 1927, 1935 ve 1945 Genel Nüfus Sayımı, Çarlık Rusyası-SSCB tarafındansa 1897 Genel Nüfus Sayımı ile 1926 Genel Nüfus Sayımı kaynak olarak seçildi.
Bu tezde yapılan analiz için kullanılan veri, şehir seviyesi boyutunda ele alındı ve Osmanlı İmparatorluğu-Türkiye Cumhuriyeti tarafından Bursa ve Ankara, Çarlık Rusyası-SSCB tarafındansa Ivanovo ve Ekaterinburg şehirleri seçildi. Ele alınacak temel mesele, endüstriyelleşme sürecine paralel ilerleyen mesleki dönüşümün, daha evvelden varsayıldığı gibi çalışan nüfusun ağırlıkla mesleki bakımdan birincil ekonomik aktivitelerden ikincil, ikincillerden de üçüncül ekonomik aktiviteler doğrultusunda, tek yönlü bir düz çizgi üzerinde ilerleyip ilerlemediği yönünde bir sorgulamadır.
Bu tezdeki ana amaç, farklı endüstriyelleşme deneyimlerinin farklı türde mesleki dönüşüm modellerine yol açıp açmadığı yönünde yeni bulgulara ulaşmaktır. Hem Osmanlı İmparatorluğu, hem de Çarlık Rusyası, 'geç endüstriyelleşme' fikrinin örnekleri arasında yer almakta olduğundan, yapılacak analizle farklı endüstriyelleşme yollarının daha geniş bir perspektiften anlaşılması yönünde katkı sağlanması amaçlanmaktadır.
Bu tezde, yukarıda bahsedilen dört farklı örnek durumu ortak bir tabanda inceleyebilmenin yolu olarak, PSTI mesleki sınıflandırma sistemi, bir analiz aracı olarak kullanılmıştır. PSTI, meslek yapısı çalışmalarında, meslek kodlama maksadıyla geliştirilmiş ve uluslararası standartlarda kabul görmüş bir kodlama sistemidir. Bu tezde, eldeki verinin özelliklerine uygun olarak ilk ve ikinci seviye meslek kodlaması uygulanmıştır.
Bu tezde elde edilen sonuçlarla, hem yukarıda bahsi geçen ülkelerin genel iktisat tarihi literatürü hem de daha geniş olarak, küresel boyutta 'endüstriyelleşme' ve 'büyük ayrışma' bağlamlarında oluşan literatüre katkı sağlamayı amaçlanmaktadır.
iii
ACKNOWLEDGEMENT
First, I would like to express my sincere gratitude to my thesis advisor Assoc. Prof. M. Erdem Kabadayı for his continuous support, patience, motivation and immense knowledge during my MA Thesis study. Without him, it would not be possible for me to become familiar with the recently growing occupational transformation literature and bring my disorganised ideas together, to improve my vision and turn them into a one large comprehensive work.
I would like also thank Gijs Kessler who has provided invaluable support for me to explore more on the Russian economic history. His insightful comments and suggestions were immensely crucial for me transform my ideas into more specific research questions, widen my perspective and extend this study to different contexts. I would not be able to build up the comparative platform in this thesis study without his encouragement.
I am also grateful Assoc. Prof. Timur Valetov whose guidance has made it easier for me to bring the occupational data in Russian census records into the methodological framework of this thesis study. I thank also to Prof. Gennadii Kornilov who helped me to have a better understanding on the history of the city Ekaterinburg.
I would like to thank my family: my parents and brother who never gave up providing me spiritual support, for the kindness they have shown while I was studying throughout sleepless days and nights.
Last but not the least, I would like to thank my friends, Berkay Küçükbaşlar, Serdar Furtuna and Fatih Yücel provided me their earlier works on related issues and make crucial contributions for me to develop my own way in this thesis.
iv
TABLE OF CONTENTS
LIST OF CHARTS ... i
LIST OF TABLES... vi
Introduction ... 1
Chapter I: Occupational Transformation and Industrialization, Petty’s Law Reconsidered... 8
Industrialization and Modern Growth. ... 8
Initial Revisions and ‘Great Divergence’ Debate. ...12
Recent Approaches ...16
Regional Focus ...16
Occupational Structure. ...21
Chapter II. Methodology. ... 25
Source of Analysis ...25
Ottoman Tax Survey ...25
Census Records ...29
Tool of Analysis ...43
PSTI as a Classification System. ...43
Unit of Analysis ...47
On the Selection of Cities ...47
Chapter III. Occupational Transformation and Industrialization from Late Tsarist-towards Early Soviet Russia: 1897-1926 ... 49
Russian Industrialization and Occupational Change: Earlier Literature. ...51
Early View from Marxist Tradition. ...52
Quantitative Works and Pessimistic Premises on Russian Industrialization ...56
Paul Gregory and the Optimistic Turn ...64
Industrialization and Urbanization in Late Tsarist Russia. ...69
Occupational Transformation in Ivanovo: 1897-1926 ...74
General Facts: Ivanovo ...74
Results and Analysis: Ivanovo 1897-1926 ...76
Population Change in Ivanovo: 1897-1926 ...77
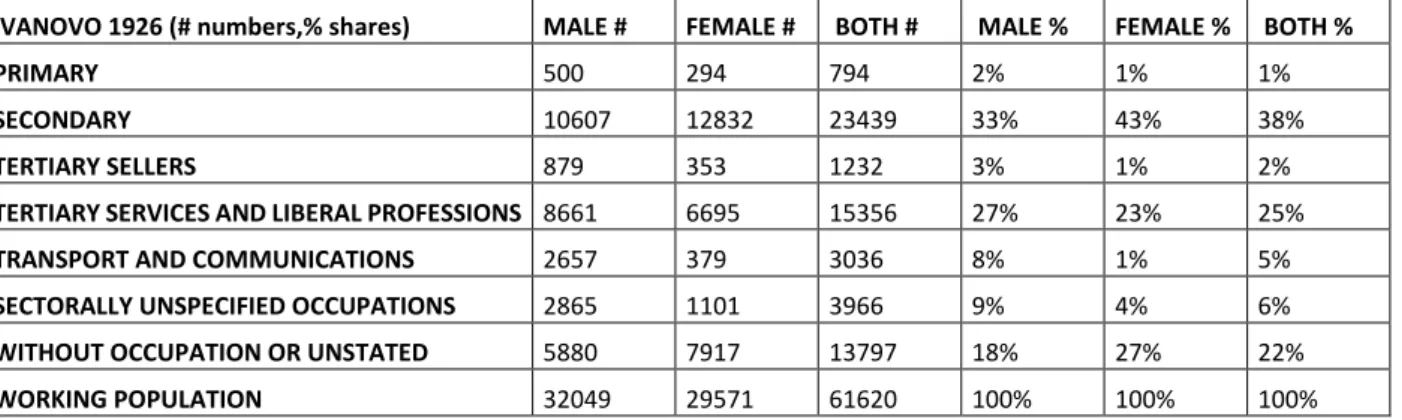
Sectoral Occupational Transformation in Ivanovo: 1897-1926 ...82
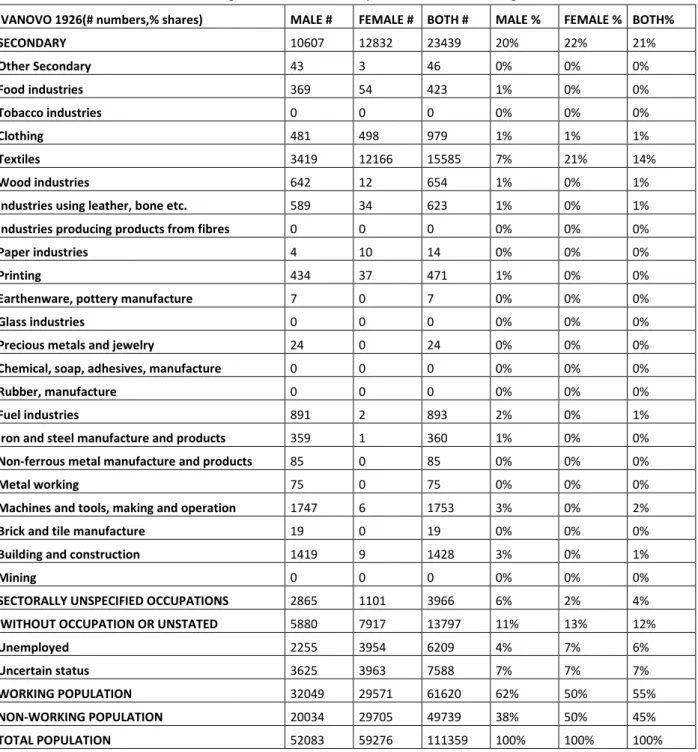
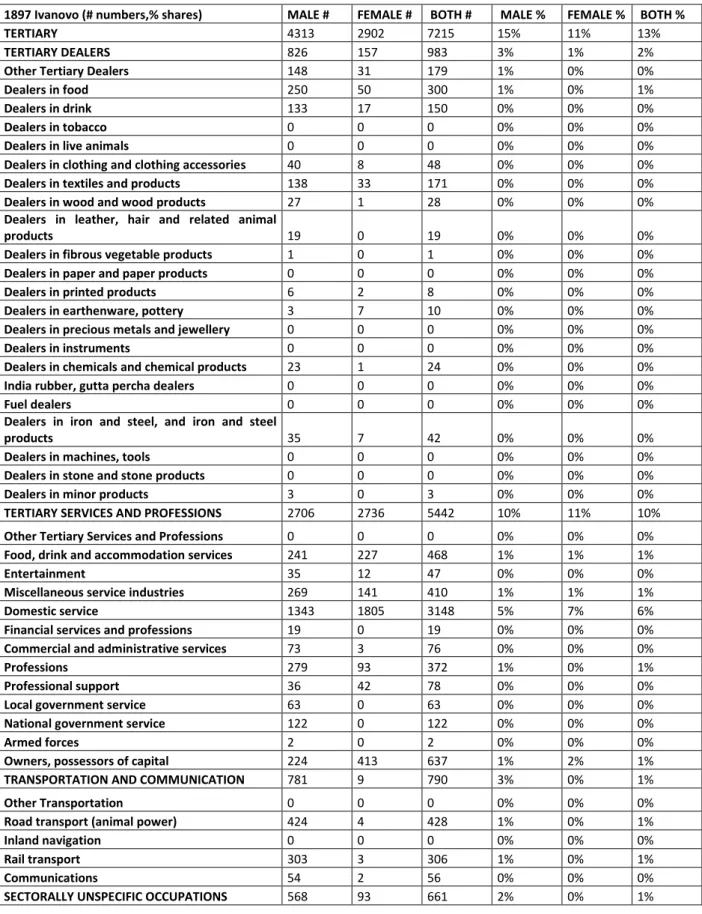
Sub-sectoral Occupation Transformation in Ivanovo: 1897-1926 ...94
v
Verdict: Occupational Transformation in Ivanovo: 1897-1926 ... 148
Occupational Transformation in Ekaterinburg: 1897-1926... 149
General Facts: Ekaterinburg ... 149
Results and Analysis: Ekaterinburg 1897-1926 ... 159
Population Change in Ekaterinburg: 1897-1926 ... 160
Sectoral Occupational Transformation in Ekaterinburg: 1897-1926 ... 165
Sub-sectoral Occupational Transformation in Ekaterinburg: 1897-1926 ... 177
Discussion: Occupational Transformation in Ekaterinburg between 1897-1926 ... 221
Verdict: Occupational Transformation in Ekaterinburg: 1897-1926 ... 227
Chapter IV. Occupational Transformation and Industrialization from Late Ottoman Empire towards early Turkish Republican Era. ... 230
Introduction ... 230
Ottoman Industrialization: A Collapsed Case? ... 232
Occupational Change throughout the Literature ... 242
Summary: Two Prominent Industrialization Debates of Ottoman Empire and Turkish Republic ... 245
Occupational Transformation in the City of Bursa: 1845-1945 ... 246
General Facts: Bursa ... 246
Results and Analysis: Bursa ... 250
Population Change in Bursa: 1845-1945 ... 250
Sectoral Occupational Transformation in Bursa: 1845-1945 ... 256
Sub-Sectoral Occupational Transformation Bursa: 1845-1945 ... 273
Discussion: Occupational Transformation in Bursa 1845-1945 ... 312
Verdict: Occupational Transformation in Bursa: 1845-1945 ... 334
Occupational Transformation in the City of Ankara: 1845-1945 ... 336
General Facts: Ankara... 336
Result and Analysis: Ankara ... 340
Population Change in Ankara 1845-1945 ... 340
Sectoral Occupational Transformation in Ankara: 1845-1945 ... 346
Sub-Sectoral Occupational Transformation in Ankara: 1845-1945 ... 362
Discussion: Occupational Transformation in Ankara: 1845-1945 ... 398
Verdict: Occupational Transformation in Ankara: 1845-1945 ... 406
Conclusion ... 408
i
LIST OF CHARTS
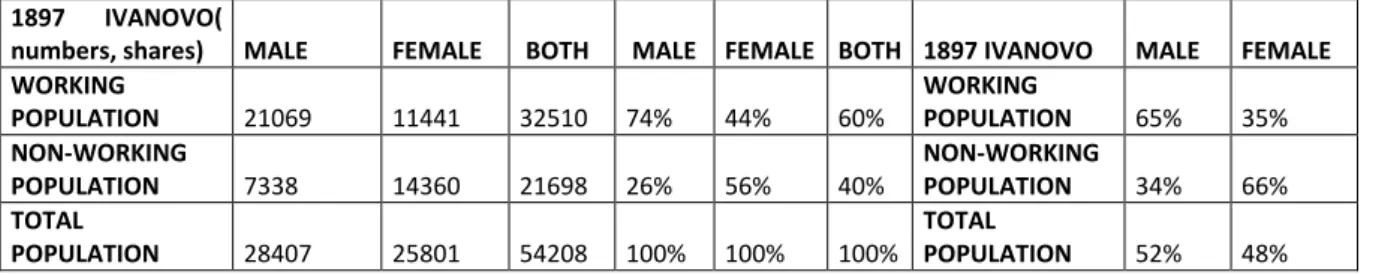
Chart 1-Ivanovo 1897 Population Gender Allocation ... 77
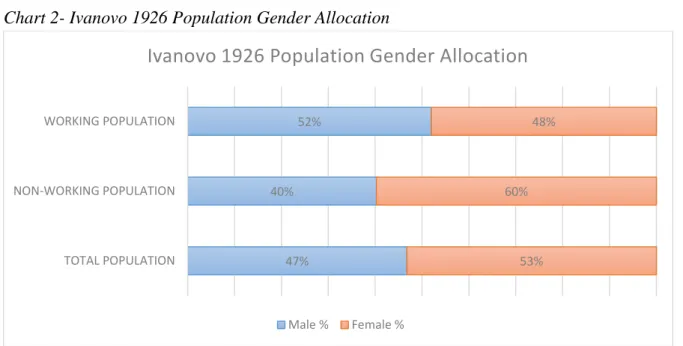
Chart 2- Ivanovo 1926 Population Gender Allocation ... 78
Chart 3-Ivanovo 1897-1926 Male Population-Labor Participation Rates... 79
Chart 4- Ivanovo 1897-1926 Female Population-Labor Participation Rates ... 79
Chart 5- Ivanovo 1897-1926 Both Sexes Population-Labor Participation Rates ... 80
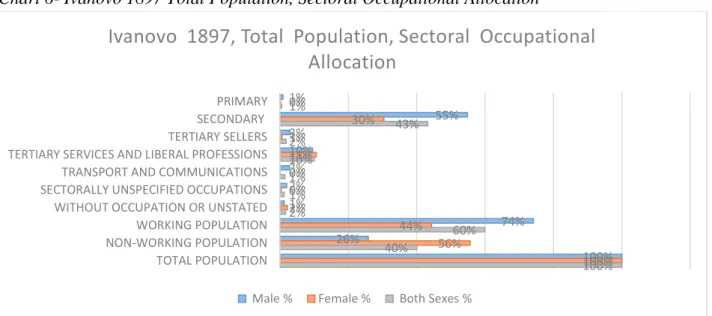
Chart 6- Ivanovo 1897 Total Population, Sectoral Occupational Allocation ... 82
Chart 7- Ivanovo 1897 Working Population, Sectoral Occupational Allocation ... 83
Chart 8-Ivanovo 1897 Gender Allocations within Occupational Sectors ... 83
Chart 9- Ivanovo 1926 Total Population, Sectoral Occupational Allocation ... 85
Chart 10- Ivanovo 1926 Working Population, Sectoral Occupational Allocation ... 86
Chart 11- Ivanovo 1926 Gender Allocation within Occupational Sectors ... 87
Chart 12- Ivanovo 1897-1926 Total Population, Both Sexes, Sectoral Occupational Shift ... 89
Chart 13- Ivanovo 1897-1926 Working Population, Both Sexes, Sectoral Occupational Shift ... 89
Chart 14- Ivanovo 1897-1926 Total Population, Males, Sectoral Occupational Shift ... 90
Chart 15- Ivanovo 1897-1926 Working Population, Males, Sectoral Occupational Shift ... 90
Chart 16- Ivanovo 1897-1926 Total Population, Females, Sectoral Occupational Shift ... 91
Chart 17- Ivanovo 1897-1926 Working Population, Females, Sectoral Occupational Shift ... 91
Chart 18-Ivanovo 1897 Total Population Secondary Sub-sectoral Occupational Allocation ... 95
Chart 19- Ivanovo 1897 Working Population, Secondary Sub-sectoral Occupational Allocation ... 96
Chart 20-Ivanovo 1897 Gender Allocation within Secondary Occupational Sub-Sectors ... 97
Chart 21- Ivanovo 1926 Total Population, Secondary Sub-sectoral Occupational Allocation ... 99
Chart 22- Ivanovo 1926 Working Population, Secondary Sub-sectoral Occupational Allocation ... 100
Chart 23-Ivanovo 1926 Gender Allocation within Secondary Occupational Sub-sectors ... 101
Chart 24- Ivanovo 1897-1926 Total Population, Both Sexes, Sectoral Occupational Shift ... 103
Chart 25- Ivanovo 1897-1926 Working Population, Both Sexes, Sectoral Occupational Shift ... 104
Chart 26- Ivanovo 1897-1926 Total Population, Males, Secondary Sub-sectoral Occupational Sub-sectoral Shift ... 105
Chart 27- Ivanovo 1897-1926 Working Population, Males, Secondary Sub-sectoral Occupational Shift ... 106
Chart 28- Ivanovo 1897-1926 Total Population, Females, Secondary Sub-sectoral Occupational Shift ... 106
Chart 29- Ivanovo 1897-1926 Working Population, Females, Secondary Sub-sectoral Occupational Shift ... 107
Chart 30- Ivanovo 1897 Total Population, Tertiary Sectoral Occupational Allocation ... 111
Chart 31- Ivanovo 1897 Total Population Tertiary Sub-sectoral Occupational Allocation ... 112
Chart 32- Ivanovo 1897 Working Population, Tertiary Sectoral Occupational Allocation ... 112
Chart 33- Ivanovo 1897 Working Population, Tertiary Sub-sectoral Occupational Allocation ... 113
Chart 34- Ivanovo 1897 Gender Allocation within Tertiary Occupational Sectors ... 113
Chart 35 Ivanovo 1897 Gender Allocation within Tertiary Occupational Sub-sectors ... 114
Chart 36- Ivanovo 1926 Total Population, Tertiary Sectoral Occupational Allocation ... 117
Chart 37- Ivanovo 1926 Total Population, Tertiary Sub-sectoral Occupational Allocation ... 117
Chart 38- Ivanovo 1926 Working Population, Tertiary Sectoral Occupational Allocation ... 118
Chart 39- Ivanovo 1926 Working Population, Tertiary Sub-sectoral Occupational Allocation ... 119
Chart 40-Ivanovo 1926 Gender Allocation within Tertiary Occupational Sectors ... 120
Chart 41- Ivanovo 1926 Gender Allocation within Tertiary Occupational Sub-sectors ... 120
Chart 42-Ivanovo 1897-1926 Total Population, Both Sexes, Tertiary Sectoral Occupational Shift ... 122
Chart 43- Ivanovo 1897-1926 Total Population, Both Sexes, Tertiary Sub-sectoral Occupational Shift ... 123
Chart 44- Ivanovo 1897-1926 Working Population, Both Sexes, Tertiary Sectoral Occupational Shift ... 124
Chart 45- Ivanovo 1897-1926 Working Population, Both Sexes, Tertiary Sub-sectoral Occupational Shift ... 125
Chart 46- Ivanovo 1897-1926 Total Population, Males, Tertiary Sectoral Occupational Shift ... 126
Chart 47- Ivanovo 1897-1926 Total Population, Males, Tertiary Sub-sectoral Occupational Shift ... 127
Chart 48- Ivanovo 1897-1926 Working Population, Males, Tertiary Sectoral Occupational Shift ... 128
Chart 49- Ivanovo 1897-1926 Working Population, Males, Tertiary Sub-sectoral Occupational Shift ... 128
Chart 50- Ivanovo 1897-1926 Total Population, Females, Tertiary Sectoral Occupational Shift ... 129
Chart 51- Ivanovo 1897-1926 Total Population, Females, Tertiary Sectoral Occupational Shift ... 130
Chart 52- Ivanovo 1897-1926 Working Population, Females, Tertiary Sectoral Occupational Shift ... 131
Chart 53- Ivanovo 1897-1926 Working Population, Females, Tertiary Sub-sectoral Occupational Shift ... 131
Chart 54- Ekaterinburg 1897 Population Gender Allocation ... 160
ii
Chart 56- Ekaterinburg 1897-1926 Male Population-Labor Participation Rates ... 162
Chart 57- Ekaterinburg 1897-1926 Female Population-Labor Participation Rates ... 162
Chart 58- Ekaterinburg 1897-1926 Total Population-Labour Participation Rates ... 163
Chart 59-Ekaterinburg 1897 Total Population, Sectoral Occupational Allocation ... 165
Chart 60- Ekaterinburg 1897 Working Population, Sectoral Occupational Allocation ... 166
Chart 61- Ekaterinburg 1897 Gender Allocation within Occupational Sectors ... 167
Chart 62- Ekaterinburg 1926 Total Population, Sectoral Occupational Allocation ... 169
Chart 63- Ekaterinburg 1926 Working Population, Sectoral Occupational Allocation ... 170
Chart 64- Ekaterinburg 1926 Gender Allocation within Occupational Sectors ... 171
Chart 65-Ekaterinburg 1897-1926 Total Population, Both Sexes, Sectoral Occupational Shift ... 172
Chart 66- Ekaterinburg 1897-1926 Working Population, Both Sexes, Sectoral Occupational Shift ... 173
Chart 67-- Ekaterinburg 1897-1926 Total Population, Males, Sectoral Occupational Shift ... 173
Chart 68- Ekaterinburg 1897-1926 Working Population, Males, Sectoral Occupational Shift ... 174
Chart 69- Ekaterinburg 1897-1926 Total Population, Females, Sectoral Occupational Shift ... 174
Chart 70-Ekaterinburg 1897-1926 Working Population Females, Sectoral Occupational Shift ... 175
Chart 71- Ekaterinburg 1897 Total Population, Secondary Sub-sectoral Occupational Allocation ... 178
Chart 72-Ekaterinburg 1897 Working Population, Secondary Sub-sectoral Occupational Allocation ... 179
Chart 73-Ekaterinburg 1897 Gender Allocation within Secondary Sub-sectoral Occupations... 180
Chart 74- Ekaterinburg 1926 Total Population Secondary Sub-sectoral Occupational Allocation ... 183
Chart 75- Ekaterinburg 1926 Working Population, Secondary Sub-sectoral Occupational Allocation ... 184
Chart 76- Ekaterinburg 1926 Gender Allocation within Secondary Occupational Sub-sectors... 185
Chart 77-Ekaterinburg 1897-1926 Total Population, Both Sexes, Secondary Sub-sectoral Occupational Shift ... 187
Chart 78- Ekaterinburg 1897-1926 Working Population, Both Sexes, Secondary Sub-sectoral Occupational Shift ... 188
Chart 79- Ekaterinburg 1897-1926 Total Population, Males, Secondary Sub-sectoral Occupational Shift ... 189
Chart 80- Ekaterinburg 1897-1926 Working Population, Males, Secondary Sub-sectoral Occupational Shift ... 190
Chart 81- Ekaterinburg 1897-1926 Total Population, Females, Secondary Sub-sectoral Occupational Shift ... 191
Chart 82- Ekaterinburg 1897-1926 Working Population, Females, Secondary Sub-sectoral Occupational Shift ... 192
Chart 83- Ekaterinburg 1897 Total Population, Tertiary Sectoral Occupational Allocation ... 195
Chart 84-Ekaterinburg 1897 Total Population, Tertiary Sub-sectoral Occupational Allocation ... 196
Chart 85- Ekaterinburg 1897 Working Population, Tertiary Sectoral Occupational Allocation ... 197
Chart 86- Ekaterinburg 1897 Working Population, Tertiary Sub-sectoral Occupational Allocation ... 198
Chart 87- Ekaterinburg 1897 Gender Allocation within Tertiary Occupational Sectors ... 199
Chart 88 Ekaterinburg 1897 Gender Allocation within Tertiary Occupational Sub-sectors ... 199
Chart 89- Ekaterinburg 1926 Total Population, Tertiary Sectoral Occupational Allocation ... 202
Chart 90-- Ekaterinburg 1926 Total Population, Tertiary Sub-sectoral Occupational Allocation ... 203
Chart 91- Ekaterinburg 1926 Working Population, Tertiary Sectoral Occupational Allocation ... 204
Chart 92- Ekaterinburg 1926 Working Population, Tertiary Sub-sectoral Occupational Allocation ... 205
Chart 93-Ekaterinburg 1926 Gender Allocation within Tertiary Occupational Sectors ... 206
Chart 94 Ekaterinburg 1926 Gender Allocation within Tertiary Occupational Sub-sectors ... 206
Chart 95- Ekaterinburg 1897-1926 Total Population, Both Sexes, Tertiary Sectoral Occupational Shift ... 208
Chart 96-Ekaterinburg 1897-1926 Total Population, Both Sexes, Tertiary Sub-sectoral Occupational Shift ... 209
Chart 97- Ekaterinburg 1897-1926 Working Population, Both Sexes, Tertiary Sectoral Occupational Shift ... 210
Chart 98- Ekaterinburg 1897-1926 Working Population, Both Sexes, Tertiary Sub-sectoral Occupational Shift ... 211
Chart 99- Ekaterinburg 1897-1926 Total Population, Males, Tertiary Sectoral Occupational Shift ... 212
Chart 100- Ekaterinburg 1897-1926 Total Population, Males, Tertiary Sub-sectoral Occupational Shift ... 213
Chart 101-Ekaterinburg 1897-1926 Working Population, Males, Tertiary Sectoral Occupational Shift ... 214
Chart 102- Ekaterinburg 1897-1926 Working Population, Males, Tertiary Sub-sectoral Occupational Shift ... 215
Chart 103-Ekaterinburg 1897-1926 Total Population, Females, Tertiary Sectoral Occupational Shift ... 216
Chart 104- Ekaterinburg 1897-1926 Total Population, Females, Tertiary Sub-sectoral Occupational Shift ... 217
Chart 105- Ekaterinburg 1897-1926 Working Population, Females, Tertiary Sectoral Occupational Shift ... 218
Chart 106- Ekaterinburg 1897-1926 Working Population, Females, Tertiary Sub-sectoral Occupational Shift ... 219
Chart 107-Bursa 1845 Population Gender Allocation ... 250
Chart 108-Bursa 1927 Population Gender Allocation ... 251
Chart 109- Bursa 1935 Population Gender Allocation ... 251
Chart 110- Bursa 1927-1945 Male Population-Labour Participation Rates ... 253
Chart 111- Bursa 1927-1945 Male Population-Labour Participation Rates ... 253
Chart 112- Bursa 1927-1945 Both Sexes Population-Labour Participation Rates ... 254
iii
Chart 114-Bursa 1845 Working Population, Sectoral Occupational Allocation ... 257
Chart 115- Bursa 1927 Total Population, Sectoral Occupational Allocation ... 258
Chart 116- Bursa 1927 Working Population, Sectoral Occupational Allocation ... 259
Chart 117-Bursa 1927 Gender Allocation within Occupational Sectors ... 260
Chart 118- Bursa 1935 Total Population, Sectoral Occupational Allocation ... 262
Chart 119- Bursa 1935 Working Population, Sectoral Occupational Allocation ... 263
Chart 120- Bursa 1945 Total Population, Sectoral Occupational Allocation ... 265
Chart 121- Bursa 1945 Working Population, Sectoral Occupational Allocation ... 266
Chart 122- Bursa Total Population Male Sectoral Occupational Allocation 1845-1945 ... 268
Chart 123-Bursa Working Population Male Sectoral Occupational Allocation 1845-1945 ... 268
Chart 124- Bursa 1935-1945 Total Population, Both Sexes, Sectoral Occupational Shift ... 269
Chart 125-Bursa 1935-1945 Working Population, Both Sexes, Sectoral Occupational Shift ... 269
Chart 126- Bursa 1935-1945 Total Population, Males, Sectoral Occupational Shift... 270
Chart 127- Bursa 1935-1945 Working Population, Males, Sectoral Occupational Shift ... 270
Chart 128- Bursa 1935-1945 Total Population, Females, Sectoral Occupational Shift ... 271
Chart 129- Bursa 1935-1945 Working Population, Females, Sectoral Occupational Shift ... 271
Chart 130-Bursa 1845 Working Male Population Secondary Sub-Sectoral Occupational Allocation ... 274
Chart 131- Bursa 1935 Total Population, Sub-Sectoral Occupational Allocation ... 275
Chart 132-Bursa 1935 Working Population, Sub-sectoral Occupational Allocation ... 276
Chart 133- Bursa 1935 Gender Allocation within Secondary Occupational Sectors ... 277
Chart 134-Bursa 1945-Total Population, Secondary Sub-Sectoral Occupational Allocation ... 279
Chart 135- Bursa 1945 Working Population, Secondary Sub-Sectoral Occupational Allocation ... 280
Chart 136- Bursa 1945 Gender Allocation within Occupational Sectors ... 281
Chart 137-Bursa Total Male Population 1845-1945 Secondary Sub-sectoral Occupational Shift ... 282
Chart 138-Bursa Total Male Population 1845-1945 Secondary Sub-Sectoral Occupational Shift ... 283
Chart 139-Bursa 1935-1945 Total Population, Both Sexes, Secondary Sub-Sectoral Occupational Shift ... 284
Chart 140- Bursa 1935-1945 Working Population, Both Sexes, Secondary Sub-Sectoral Occupational Shift ... 285
Chart 141- Bursa 1935-1945 Total Population, Males, Secondary Sub-Sectoral Occupational Shift ... 286
Chart 142- Bursa 1935-194 Working Population, Males, Secondary Sub-Sectoral Occupational Shift ... 287
Chart 143- Bursa 1935-1945 Working Population, Females, Secondary Sub-Sectoral Occupational Shift ... 288
Chart 144- Bursa 1935-1945 Working Population, Females, Secondary Sub-Sectoral Occupational Shift ... 289
Chart 145- Bursa 1845 Total Population Tertiary Sectoral Occupational Allocation ... 291
Chart 146- Bursa 1845 Total Population Tertiary Sectoral Occupational Allocation ... 292
Chart 147- Bursa 1935 Total Population, Tertiary Sectoral Occupational Allocation ... 294
Chart 148- Bursa 1935 Total Population, Tertiary Sub-Sectoral Occupational Allocation ... 295
Chart 149- Bursa 1935 Working Population, Tertiary Sectoral Occupational Allocation ... 296
Chart 150- Bursa 1935 Working Population, Tertiary Sub-Sectoral Occupational Allocation... 297
Chart 151-Bursa 1935 Gender Allocation within Tertiary Occupational Sectors ... 298
Chart 152- Bursa 1935 Gender Allocation within Tertiary Occupational Sub-sectors ... 299
Chart 153- Bursa 1945 Total Population, Tertiary Sectoral Occupational Allocation ... 300
Chart 154- Bursa 1945 Total Population, Tertiary Sub-Sectoral Occupational Allocation ... 301
Chart 155- Bursa 1945 Working Population, Tertiary Sectoral Occupational Allocation ... 302
Chart 156- Bursa 1945 Working Population, Tertiary Sub-Sectoral Occupational Allocation... 302
Chart 157- Bursa 1945 Gender Allocation within Tertiary Occupational Sectors ... 303
Chart 158- Bursa 1945 Gender Allocation within Tertiary Occupational Sub-sectors ... 303
Chart 159- Bursa 1845-1945 Total Population, Both Sexes, Tertiary Sectoral Occupational Shift ... 304
Chart 160- Bursa 1845-1945 Total Population, Both Sexes, Tertiary Sectoral Occupational Shift ... 305
Chart 161- Bursa 1935-1945 Total Population, Both Sexes, Tertiary Sectoral Occupational Shift ... 305
Chart 162- Bursa 1935-1945 Total Population, Both Sexes, Tertiary Sub-Sectoral Occupational Shift ... 306
Chart 163- Bursa 1935-1945 Working Population, Both Sexes, Tertiary Sectoral Occupational Shift ... 307
Chart 164- Bursa 1935-1945 Working Population, Both Sexes, Tertiary Sub-Sectoral Occupational Shift ... 307
Chart 165- Bursa 1935-1945 Total Population, Males, Tertiary Sectoral Occupational Shift ... 308
Chart 166- Bursa 1935-1945 Total Population, Males, Tertiary Sub-Sectoral Occupational Shift ... 308
Chart 167- Bursa 1935-1945 Working Population, Males, Tertiary Sectoral Occupational Shift ... 309
Chart 168- Bursa 1935-1945 Working Population, Males, Tertiary Sub-Sectoral Occupational Shift ... 309
Chart 169- Bursa 1935-1945 Total Population, Females, Tertiary Sectoral Occupational Shift ... 310
Chart 170- Bursa 1935-1945 Total Population, Females, Tertiary Sub-Sectoral Occupational Shift ... 310
iv
Chart 172- Bursa 1935-1945 Working Population, Females, Tertiary Sub-Sectoral Occupational Shift ... 311
Chart 173- Ankara 1845 Population Gender Allocation ... 340
Chart 174- Ankara 1927 Population Gender Allocation ... 341
Chart 175- Ankara 1935 Population Gender Allocation ... 341
Chart 176- Ankara 1945 Population Gender Allocation ... 342
Chart 177- Ankara 1927-1945 Male Population-Labour Participation Rates ... 343
Chart 178- Ankara 1927-1945 Female Population-Labour Participation Rates ... 343
Chart 179-Ankara 1927-1945 Both Sexes Population-Labour Participation Rates ... 344
Chart 180- Ankara 1845 Total Population, Sectoral Occupational Allocation ... 346
Chart 181- Ankara 1845 Working Population, Sectoral Occupational Allocation ... 347
Chart 182-Ankara 1927 Total Population Occupational Allocation ... 348
Chart 183-Ankara 1927 Working Population Sectoral Occupational Allocation ... 349
Chart 184- Ankara 1927 Total Population Gender Allocation within Occupational Sectors ... 349
Chart 185-Ankara 1935 Total Population Sectoral Occupational Allocation ... 351
Chart 186- Ankara 1935 Working Population Sectoral Occupational Allocation ... 352
Chart 187-Ankara 1935 Total Population Gender Allocation within Occupational Sectors ... 352
Chart 188- Ankara 1945 Total Population Sectoral Occupational Allocation ... 354
Chart 189- Ankara 1945 Total Population Sectoral Occupational Allocation ... 355
Chart 190- Ankara 1935 Total Population Gender Allocation within Occupational Sectors ... 355
Chart 191- Ankara 1845-1945 Total Population, Males, Sectoral Occupational Shift ... 357
Chart 192- Ankara 1845-1945 Working Population, Males, Sectoral Occupational Shift ... 357
Chart 193- Ankara 1935-1945 Total Population, Both Sexes, Sectoral Occupational Shift ... 358
Chart 194- Ankara 1935-1945 Total Population, Both Sexes, Sectoral Occupational Shift ... 358
Chart 195- Ankara 1935-1945 Total Population, Males, Sectoral Occupational Shift ... 359
Chart 196- Ankara 1935-1945 Total Population, Males, Sectoral Occupational Shift ... 359
Chart 197- Ankara 1935-1945 Total Population, Females, Sectoral Occupational Shift ... 360
Chart 198- Ankara 1935-1945 Total Population, Females, Sectoral Occupational Shift ... 360
Chart 199- Ankara 1845 Male Total Population, Secondary Sub-Sectoral Occupational Allocation ... 362
Chart 200- Ankara 1845 Working Population, Secondary Sub-Sectoral Occupational Allocation ... 363
Chart 201-Ankara 1935 Total Population Both Sexes Secondary Sub-Sectoral Occupational Allocation ... 365
Chart 202-Ankara 1935 Working Population Both Sexes Secondary Sub-Sectoral Occupational Allocation ... 365
Chart 203-Ankara 1935 Total Population Gender Allocation within Secondary Occupational Sub-sectors ... 366
Chart 204- Ankara 1945 Total Population Both Sexes Secondary Sub-Sectoral Occupational Allocation ... 368
Chart 205- Ankara 1945 Working Population Both Sexes Secondary Sub-Sectoral Occupational Allocation ... 369
Chart 206- Ankara 1945 Total Population Gender Allocation within Secondary Occupational Sub-sectors ... 370
Chart 207-Ankara 1845-1945 Total Population, Males, Secondary Sub-Sectoral Occupational Allocation ... 371
Chart 208- Ankara 1845-1945 Total Population, Males, Secondary Sub-Sectoral Occupational Allocation ... 372
Chart 209-Ankara 1935-1945 Total Population, Both Sexes, Secondary Sub-Sectoral Occupational Shift ... 372
Chart 210- Ankara 1935-1945 Working Population, Both Sexes, Secondary Sub-Sectoral Occupational Shift ... 373
Chart 211- Ankara 1935-1945 Total Population, Males, Secondary Sub-Sectoral Occupational Shift ... 373
Chart 212- Ankara 1935-1945 Working Population, Males, Secondary Sub-Sectoral Occupational Shift ... 374
Chart 213- Ankara 1935-1945 Total Population, Females, Secondary Sub-Sectoral Occupational Shift... 374
Chart 214- Ankara 1935-1945 Working Population, Females, Secondary Sub-Sectoral Occupational Shift ... 375
Chart 215- Ankara 1845 Total Population, Tertiary Sectoral Occupational Allocation ... 377
Chart 216- Ankara 1845 Working Population, Tertiary Sectoral Occupational Allocation ... 378
Chart 217- Ankara 1845 Working Population, Tertiary Sub-Sectoral Occupational Allocation ... 378
Chart 218- Ankara 1935 Total Population, Tertiary Sectoral Occupational Allocation ... 380
Chart 219- Ankara 1935 Working Population, Tertiary Sectoral Occupational Allocation ... 380
Chart 220- Ankara 1935 Total Population, Tertiary Sub-Sectoral Occupational Allocation ... 381
Chart 221- Ankara 1935 Working Population, Tertiary Sub-Sectoral Occupational Allocation ... 381
Chart 222- Ankara 1945 Total Population, Tertiary Sectoral Occupational Allocation ... 383
Chart 223- Ankara 1945 Total Population, Tertiary Sub-Sectoral Occupational Allocation ... 384
Chart 224- Ankara 1945 Working Population, Tertiary Sectoral Occupational Allocation ... 385
Chart 225- Ankara 1945 Working Population, Tertiary Sub-Sectoral Occupational Allocation ... 386
Chart 226-Ankara 1945 Gender Allocation within Tertiary Occupational Sectors ... 386
Chart 227-Ankara 1945 Gender Allocation within Tertiary Occupational Sub-sectors ... 387
Chart 228-Ankara 1845-1945 Total Population Tertiary Sub-sectoral Occupational Shift ... 389
v
Chart 230- Ankara 1845-1945 Working Population Tertiary Sectoral Occupational Shift ... 390
Chart 231- Ankara 1845-1945 Working Population Tertiary Sub-Sectoral Occupational Shift ... 390
Chart 232- Ankara 1935-1945 Total Population, Both Sexes, Tertiary Sectoral Occupational Shift ... 391
Chart 233- Ankara 1935-1945 Total Population, Both Sexes, Tertiary Sub-Sectoral Occupational Shift ... 391
Chart 234- Ankara 1935-1945 Working Population, Both Sexes, Tertiary Sectoral Occupational Shift ... 392
Chart 235- Ankara 1935-1945 Working Population, Both Sexes, Tertiary Sub-Sectoral Occupational Shift ... 392
Chart 236-Ankara 1935-1945 Total Population, Males, Tertiary Sectoral Occupational Shift ... 393
Chart 237- Ankara 1935-1945 Total Population, Males, Tertiary Sub-Sectoral Occupational Shift ... 393
Chart 238- Ankara 1935-1945 Working Population, Males, Tertiary Sectoral Occupational Shift ... 394
Chart 239- Ankara 1935-1945 Working Population, Males, Tertiary Sub-Sectoral Occupational Shift ... 394
Chart 240- Ankara 1935-1945 Total Population, Females, Tertiary Sectoral Occupational Shift ... 395
Chart 241- Ankara 1935-1945 Total Population, Females, Tertiary Sub-Sectoral Occupational Shift ... 395
Chart 242-Ankara 1935-1945 Working Population, Females, Tertiary Sectoral Occupational Shift ... 396
vi
LIST OF TABLES
Table 1-Results of Method 1: All ‘rest’ deleted, 1897 ... 34
Table 2- Results of Method 1: All ‘rest’ deleted, 1926 ... 35
Table 3- Results of Method II: All ‘rest’ deleted for Census 1897 and ‘rest’ selectively deleted for 1926 ... 35
Table 4-Ivanovo 1897 Population Gender Allocation ... 77
Table 5-Ivanovo 1926 Population Gender Allocation ... 78
Table 6-Ivanovo 1897-1926 Population Growth Rates ... 78
Table 7-Ivanovo 1897 Total Population Sectoral Occupational Allocation ... 82
Table 8- Ivanovo 1897 Working Population, Sectoral Occupational Allocation ... 82
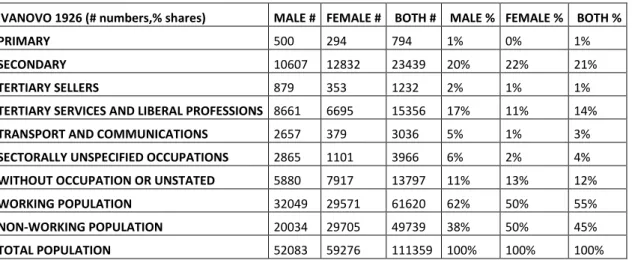
Table 9- Ivanovo 1926 Total Population, Sectoral Occupational Allocation ... 85
Table 10-Ivanovo 1926 Working Population, Sectoral Occupational Allocation ... 86
Table 11- Ivanovo 1897 Total Population, Secondary Sub-sectoral Occupational Allocation ... 94
Table 12- Ivanovo 1926 Total Population, Secondary Sub-sectoral Occupational Allocation ... 98
Table 13- Ivanovo 1897, Total Population, Tertiary Sector, Sub-sectoral Occupational Allocation ... 110
Table 14- Ivanovo 1926 Total Population, Tertiary Sub-sectoral Occupational Allocation ... 116
Table 15- Ekaterinburg 1897 Population Gender Allocation ... 160
Table 16-- Ekaterinburg 1926 Population Gender Allocation ... 160
Table 17- Ekaterinburg 1897-1926 Population Growth Rates ... 161
Table 18- Ekaterinburg 1897 Total Population, Sectoral Occupational Allocation ... 165
Table 19- Ekaterinburg 1897 Working Population, Sectoral Occupational Allocation ... 166
Table 20- Ekaterinburg 1926 Total Population, Sectoral Occupational Allocation ... 169
Table 21- Ekaterinburg 1926 Working Population, Sectoral Occupational Allocation ... 170
Table 22-Ekaterinburg 1897 Total Population, Secondary Sub-sectoral Occupational Allocation ... 177
Table 23- Ekaterinburg 1926 Total Population, Secondary Sub-sectoral Occupational Allocation ... 182
Table 24- Ekaterinburg 1897, Total Population, Tertiary Sub-sectoral Occupational Allocation ... 194
Table 25- Ekaterinburg 1926 Total Population, Tertiary Sub-sectoral Occupational Allocation ... 201
Table 26-Bursa 1845 Population Gender Allocation ... 250
Table 27-Bursa 1927 Population Gender Allocation ... 250
Table 28-Bursa 1935 Population Gender Allocation ... 251
Table 29-Bursa 1945 Population Gender Allocation ... 252
Table 30- Bursa 1845-1945 Population Growth ... 252
Table 31-Bursa 1845 Total Male Population ... 256
Table 32- Bursa 1845 Working Population, Sectoral Occupational Allocation ... 257
Table 33- Bursa 1927 Total Population, Sectoral Occupational Allocation ... 258
Table 34-Bursa 1927 Working Population, Sectoral Occupational Allocation ... 259
Table 35- Bursa 1935 Total Population, Sectoral Occupational Allocation ... 262
Table 36- Bursa 1935 Working Population, Sectoral Occupational Allocation ... 263
Table 37- Bursa 1945 Total Population, Sectoral Occupational Allocation ... 265
Table 38- Bursa 1945 Working Population, Sectoral Occupational Allocation ... 266
Table 39-Bursa 1845 Working Population, (Pre-dominantly) Male, Secondary Sub-sectoral Occupational Allocation ... 273
Table 40- Bursa 1935 Total Population, Secondary Sub-Sectoral Occupational Allocation ... 275
Table 41- Bursa 1945 Total Population, Secondary Sub-Sectoral Occupational Allocation ... 278
Table 42-Bursa 1845 Total Population Tertiary Sub-sectoral Occupational Allocation ... 290
Table 43- Bursa 1935 Total Population, Tertiary Sub-Sectoral Occupational Allocation ... 293
Table 44- Bursa 1945 Total Population, Tertiary Sub-Sectoral Occupational Allocation ... 300
Table 45-Ankara 1845 Population Gender Allocation ... 340
Table 46- Ankara 1927 Population Gender Allocation ... 340
Table 47- Ankara 1935 Population Gender Allocation ... 341
Table 48- Ankara 1945 Population Gender Allocation ... 342
Table 49- Ankara 1927-1945 Population Growth Rates ... 342
Table 50-Ankara 1845 Working Population Occupational Allocation ... 346
Table 51- Ankara 1845 Working Population, Sectoral Occupational Allocation ... 347
Table 52-Ankara 1927 Total Population Sectoral Occupational Allocation ... 348
Table 53-Ankara 1927 Working Population Sectoral Occupational Allocation ... 348
Table 54-Ankara 1935 Total Population Sectoral Occupational Allocation ... 351
Table 55- Ankara 1945 Total Population Sectoral Occupational Allocation ... 354
Table 56- Ankara 1845 Total Population, Secondary Sub-Sectoral Occupational Allocation ... 362
vii
Table 58- Ankara 1945 Total Population Secondary Sub-Sectoral Occupational Allocation ... 367
Table 59-Ankara 1845 Total Population, Tertiary Sub-Sectoral Occupational Allocation ... 376
Table 60-Ankara 1845 Total Population, Tertiary Sub-Sectoral Occupational Allocation ... 377
Table 61-Ankara 1935 Working Population Tertiary Sub-sectoral Occupational Allocation... 379
1
Introduction
In this thesis project, I would like to examine the presumed association between industrialization and occupational transformation in the contexts of late imperial and early Soviet Russia as well as late Ottoman and early Republican Turkey while maintaining a special focus on shift and trends regarding occupational structure. The main idea is to investigate more on the industrialization paths of two prominent late-industrializing countries, Russia and Turkey. What kind of a transition does the society experience in terms of occupational structure and in what extent, does the patterns that I would obtain as a result of my analysis for these different cases, fits into the ‘mainstream’ industrialization path. By ‘mainstream’; I would mean a stereotypical a way of structural change where the majority of working population would be firstly engaged in agricultural activities and at later stages of the industrialization process, secondary (mainly manufacturing) and finally tertiary activities ( like services) would likely to be dominant. 1
This theory, first put on the paper by William Petty as far as we know, was formed into a neoclassical economic theory form by Colin Clark in the beginning of Second World War.2 Simon Kuznets was the first scholar who gave a test for this hypothesis via data provided by national income accounts in a comparative and widely extensive manner. As well as Simon Kuznets or David Landes, the main assumption that the main driving force behind economic
1 Yasusada Murata, “Engel’s Law, Petty’s Law, and Agglomeration,” Journal of Development Economics 87, no. 1 (2008): 161–77; Colin Clark, The Conditions of Economic Progress. (London; New York: Macmillan; St. Martin’s Press, 1957).
2
development is technological developments and hence, structural change is not possible without full-fledged industrialization; e.g. heavily mechanized, large-scale production units.
While I would be tracking different industrialization directions by analysing occupational transformation, two essential questions would set the tone for this thesis project: First and foremost, the emphasis would be on the conceptual meaning of industrialization and hence the question ‘What is industrialization?’ would be inherently pursued throughout the work. Secondly, which could be reckoned as a methodological implication while looking for a better answer for the first question: ‘How to measure industrialization?’
In order to undertake such a research, I would like to utilize two types of sources: census records and tax surveys. These would be, namely, 1897 All-Russian and 1926 Soviet Union census for the Russian side and 1845 Ottoman tax survey, 1927,1935 and 1945 Ottoman Turkish general census records. The aim is to build a platform of comparison where all these census and survey data become comparable in our quest for tracking occupational changes and hence, the use a relatively fresh method of measuring ‘industrialization’ while tracking occupational change. One methodological tool that I could use to come up with a solid basis of comparison is the PSTI codification system3, which was developed quite recently by the renowned Cambridge economic historian Tony Wrigley. The peculiarity of this codification system is rather than using national income accounts to track for the structural changes that national economies has gone through, PSTI gives us the opportunity to follow a more micro-based, demand-sided and hence, accurate analysis of the relevant economic developments. PSTI tackles both the
3
reliability problem of official government documents and provides a more comprehensible platform of analysis with various levels like city, regional or provincial.
The main motivation for such an enquiry could be well justified if we consider the latest findings on the industrialization-occupational transformation nexus. Recent revelations of Leigh Shaw-Taylor and Tony Wrigley, on ‘irregular’ relationship between the occupational transformation and the British Industrial Revolution 4 , opens the way for more research possibilities in the following sense: The validity of Petty’s Law, that is, the orthodox understanding of occupational transformation in connection with industrialisation,where the majority of workforce move from primary sector to manufacturing and lastly, tertiary sector activities, has been put into question. Whether there could be other possibilies, more irregular transitions between the three main sectors of economy, could be a valid question to pursue in these contexts. The aim is to have a more vivid picture on almost a hundred years of economic history of local and global contexts, regarding the four cities and the relevant countries as well as the industrialization problematic itself.
In this thesis project, I have found some partial evidence for the presumed pattern of ‘Petty’s Law’ does not remain valid for each and every state or society. In Ottoman/Turkish case, rather than ‘industrialization’ in the technological sense, economic development was made possible by a fledging urban economy and therefore, a shift from primary sector dominated economy to the tertiary sector directly, regarding the occupational structure, has been noticed. For Russian
4 Leigh Shaw-Taylor and E. A. Wrigley, “Occupational Structure and Population Change,” in The Cambridge Economic History of Modern Britain. Volume 1, Industrialisation, 1700-1860, ed. Roderick Floud and Paul (Paul
4
case, the robustness of evidence does not seem to be as lucid as the Ottoman case however, we encounter with similar symptoms, that it was not the industrialization via heavy industry with large-scale mechanized production only, what drives economic growth but other factors like enhanced transportation possibilities and urbanization.
Regarding this attempted analysis for all four these cities, I have observed a significant continuity in their economic developments once we look extensively on the transformation of occupational structure. There have been a significant amount of people who had their occupations within secondary and tertiary sector and not primary sector even back in 1845 and this could be a good indicator ‘continuity’; the industrialization process does not take place in discrete periods by the initiatives of aggressive state intervention but rather, the progress could be gradual but slightly uninterrupted. In Russian case, for both Ivanovo and Ekaterinburg, it could be easily grasped that the relative weight of the tertiary sector does not diminish from back in mid-19th century and constantly gaining share from the secondary sector despite the economic hardships in terms of big-scale manufacturing activity, war, famine, disease.
In Ottoman case, despite the ‘de-industrialization’ effect, that is, a turn back to agricultural occupations among the working population could be discernible especially between 1845 and 1926 but nevertheless, it is not so strong. Both in Bursa and in Ankara as well, tertiary sector activities continue to grow in a slow pace; small-scale manufacturing keeps the secondary sector ‘alive’ despite the stagnation.
5
The main implication of this result is as follows: The industrialization concept, as a whole, should be reconsidered. Instead of confining ourselves to the concept of industrialization as a purely technical term, we must look for other ways of interpreting the dynamics of tri-partite relationship between industrialization-occupational change and urbanization and widen our understanding of the phenomena. Instead of just concentrating on national boundaries, more detailed level analysis where deeper spatial-temporal concerns should be added to the current methodological box, for instance, the level of analysis should be lowered from national borders to regional clusters and from there, perhaps cities and districts.
The organization of this thesis is as follows. In the first chapter, I would like to provide a general outlook of the industrialization literature with a particular focus on its association with occupational structure. The idea here to show different perspectives on industrialization experience debates; i.e. the argument on British industrial revolution standing as a sole reason for the ‘Great Divergence’ or the question on the validity of ‘take-off’ conditions for industrialization proper. The aim is to show that recently, there have been raised objections on the one-dimensional industrialization perspective since our study here would like to focus on a similar line of objection: occupational structure does not have to follow a similar process everywhere during the industrialization process.
In the second chapter, I would explain my methodology which is consisted of three main pillars: source, tools of analysis and unit of analysis. In the first section, I would give a more detailed account of the sources that we would like to work for this project. These are, Ottoman 1845 tax survey, 1927, 1935 and 1945 Census as well as 1897 all-Russian census and 1926 Soviet census.
6
I would also provide a detailed explanation of the PSTI classification which I would utilize here, as a tool of analysis, in order to make the relevant source data comparable with each other.
In the third and fourth chapters, I would like to explore more on local contexts individually; first, on the Russian industrialization and the relevant occupational structure association would be in focus. A brief account of the preceding literature on Russian industrialization during 19th century and in the beginning of 20th century, would be provided. Secondly, I would like to share my results obtained from the hereby analysis on two cities, Ivanovo and Ekaterinburg. The analysis could be revealing since it has been generally assumed in the literature that Russian industrialization experience was discrete and based on state initiatives, largely taken during the last ten years of 19th century. We would see that, perhaps it was not the case, at least for Ivanovo and Ekaterinburg contexts.
In the fourth chapter, the tasks that have been undertaken for the Russian case, would be completed for Ottoman/Turkish case. Here, especially deindustrialization notion would be crucial to keep an eye on during our analysis regarding our selected cities, Ankara and Bursa, since Ottoman manufacturing was generally thought to be ‘collapsed’ until the turn of 19th
century and could not recover until the state take the reins based on ideological reasons and put the country on the track of industrialization. Again, this type a ‘discrete industrialization’ narrative was not compatible with our results. In fact, Ankara and Bursa showed a significant level of continuity, albeit more subtle than the Russian case, but nevertheless, the gradual progress was to be depicted. One concern would be the high rate of increase regarding the
7
administrative roles of Ankara which blurs our analysis and disrupts the reliability of our results.
In the conclusion chapter, I would like to bring both these industrialization experiences together and would like to come to a final verdict on the issue of association between the industrialization and occupational transformation, based on our results obtained from qualitative analysis.
8
Chapter I: Occupational Transformation and Industrialization,
Petty’s Law Reconsidered
Industrialization and Modern Growth.
In this thesis project, our approach would be more like an economic historian from the standpoint of a social scientist, more than a neo-classical economist who utilizes mathematical modelling for testing readily-made assumptions. Therefore, we would not be focusing on merely national income accounts or the progress of various industries but would like to be put urban development and growth and its role on the transformation of social structure where occupational data would help us. Therefore, we would be safely assuming that our way of problematizing the industrialization phenomena in the first instance is something akin to be more descriptive.
The industrial revolution of Britain and industrialization process that the rest of the world has experienced, without a doubt, has been well examined from both economic history as well as sociological perspective. Regarding the former, it was for no reason that the founding fathers of the social science, Karl Max, Max Weber or Emile Durkheim, devoted their scholarly interest to the industrialization phenomena and social change related with it. The intriguing question haunted the minds of thinkers, echoed with the same old mysterious curiosity: What does drive
9
the economic growth? For Adam Smith as well as Marx, it was the division of labour; hence specialization and the markets will carry the progress. For Weber, it was more related with a bureaucratic rationalization and therefore, as a result of ‘good management’. For Kuznets or Landes, it was the ‘modern growth’, driven by technological leap and driven by structural transformation. All of these analysis were supply based and for the economic historians like Rostow or Kuznets, it was more likely to be something of a technicality.
Following Colin Clark’s premises on the structural transformation, Simon Kuznets made us quantitative methods which we would call the National Income Methods. Kuznets, came up with a very intriguing set of questions which was quite remarkable once we consider the historical context of the study that has been undertaken, the post-war recuperation period: “What drives economic growth? What were the forces behind the sustainable industrial momentum get unleashed and powerful impulse that gave led to irrevocable social change? How was the making of the modern world? ”5
In order to come up with a comprehensible answer, with the helping hand of recently developed computer technologies, ground-breaking improvements within the statistical analysis sphere, flourishing econometrics as well as new historical research opportunities unlocked by the wider accession to historical official documents, he worked on US national income accounts, covering a time span of nearly 200 years, late 18 century and mid-19th century. We should note that he was not the only scholar who was giving a special interest to the industrialization phenomena
5Simon Smith Kuznets, “Modern Economic Growth: Findings and Reflections,” International Journal of Social
10
with from the point of view of economic history. He refers to an earlier study, undertaken by Phyllus Dean and W.A. Cole, who pursued for a similar type of inquiry, under the British context. These two authors, utilizing the national income techniques like Kuznets, replaced the ‘social tables of Gregory King of 1688’6 and hence became the most comprehensible source of reference of British industrialization based on their study of economic development in Britain covering a period from the late 17th century and up until the middle 20th century7 up to that date. However, neither this first quantitative sketch of British industrialization history, nor the Kuznets’ exceptional analysis would remain without any objections or revisions.
After some long tenacious explorations, Kuznets came to the conclusion that it was the technological achievements that has made economic growth sustainable. The sustainable industrialization could only be possible with the advent of ‘differential impact of technological innovations8. This was clearly a rejection of an earlier, ‘Smithian growth’ conception, which was giving prominence to the market inclined, product differentiation process; the emphasis was essentially on the concept of division of labour and most of all, the whole process were thought to be in accordance with the ‘spontaneous nature’ of human development. The impetus, which led the industrial revolution and sustainable growth did not come from state or other provocative political or institutional artefacts: the economic growth and development process was led by the forces of nature and hence, the only agent who was dictating its rules ‘the market’ only. Within this framework, geographical factors become much more prominent rather than
6 Leigh Shaw-Taylor and E. A. Wrigley, “Available Sources and Earlier Research,” 2, online available, accessed March 6, 2015, http://www.geog.cam.ac.uk/research/projects/occupations/abstracts/paper26.pdf.
7 Phyllis Deane, British Economic Growth, 1688-1959 : Trends and Structure, Modern Revivals in Economic and Social History (Aldershot, Hampshire, England: Gregg Revivals ; Brookfield, Vt, USA, 1993).
8 Simon Smith Kuznets, Modern Economic Growth: Rate, Structure, and Spread, Studies in Comparative Economics 7 (New Haven: Yale University Press, 1966).
11
institutional or political factors, if one would like to make sense of the multi-faceted industrialization processes, the spatial distribution of certain industries, demographics, the extents of urbanization or the regional inequalities. However, while reverting Smithian insight on the phenomena of industrialization, Kuznets did not use an analytical toolkit which would satisfy the spatial-temporal considerations or quests for a more specified regional focus. His tools of analysis, which remained as the benchmark late until seventies, were the ones which were available by the official accounts: aggregate population growth, product per capita and etc.
Without any doubt, while these scaling inventories were providing quantitative power for the analytical framework, they were lacking more qualitative feature. How could the explanatory power of this precious analytical initiative be improved?
12
Initial Revisions and ‘Great Divergence’ Debate.
Despite the Kuznetsian insight that renders all the industrialization paths that national economies have walked through could be unified under a common denominator or could be depicted out from stylized facts and figures, more historical explorations found evidence against these conclusions. In order not lapse into ‘Eurocentrism’ trap that Kuznets and his followers have fallen, alternative industrialization narratives have been developed. Scholars like Kenneth Pomeranz9, Jean-Laurent Rosenthal and R. Bin Wong10, Gareth Austin11, Osamu Saito12 and Kaoru Sugihara13, gave an attempt to change the whole spectrum towards a less ‘Eurocentric’, alternative conception of industrialization.
In 1973, Thomas Smith published a comparative account of ‘pre-modern growth’ in Japan and the West. According to Smith, both Japan and Western Europe experienced an increase in
9 Kenneth Pomeranz, The Great Divergence : China, Europe, and the Making of the Modern World Economy, Princeton Economic History of the Western World (Princeton, NJ: Princeton University Press, 2000).
10 Jean-Laurent Rosenthal and Roy Bin Wong, Before and beyond Divergence: The Politics of Economic Change
in China and Europe (Cambridge, Mass: Harvard University Press, 2011).
11Gareth Austin, “Labour Intensity and Manufacturing in West Africa, c.1450-c.2000,” in Labour-Intensive
Industrialization in Global History, ed. Gareth Austin and Kaoru Sugihara, Routledge Explorations in Economic
History 59 (Abingdon, Oxon ; New York: Routledge, 2013), chap. 9.
12Osamu Saito, “Proto-Industrialization and Labour-Intensive Industrialization:reflections on Smithian Growth and the Role of Skill Intensity,” in Labour-Intensive Industrialization in Global History, ed. Gareth Austin and Kaoru Sugihara, Routledge Explorations in Economic History 59 (Abingdon, Oxon ; New York: Routledge, 2013), chap. 4.
13 Gareth Austin and Kaoru Sugihara, eds., Labour-Intensive Industrialization in Global History, Routledge Explorations in Economic History 59 (Abingdon, Oxon ; New York: Routledge, 2013).
13
industrial and commercial activity before the age of industrialization and achieved a modest but secular rise in per capita output over the early modern period. 14
Despite such a parallel in output growth, however, the two regions exhibited a marked contrast with respect to urbanization. Pre-modern growth in the West was accompanied by urban growth, whereas in the latter half of Tokugawa Japan a majority of towns and cities lost population. This must have been a reflection of fundamental differences, argued Smith, in the ways in which output growth was achieved in early modern Japan and Western Europe. In the European towns, foreign trade and population totals all grew, so that the size of its economy expanded, whereas Tokugawa Japan managed to achieve an increase in per capita output with its economy becoming autarkic, population stagnant and urban commerce outplayed by the rural sector. Smith thus called the west European pattern of pre-modern growth ‘urban-oriented’ and the Tokugawa pattern ‘rural-oriented’.
‘The Great Divergence’ debate has been hovering around since the works of Kenneth Pomeranz 15, who has come up with significant evidence on the relatively similar way of economic conditions and culprits of Smithian growth in both Asian(Lower Yangzhi Region in China) as well as North-Western Europe. This debate has very strong connections with the question about what industrialization really is in terms of economic historian conceptual space. Is that related with only product per capita improvements, sustainable changes in mortality rates or should we include real wages or life standards of people from different parts of the world?
14 Thomas C. Smith, “Pre-Modern Economic Growth: Japan and the West,” Past and Present, 1973, 127–60. 15 Pomeranz, The Great Divergence.
14
Akira Hayami has developed the ‘industrious revolution’ concept16; which was, in a nutshell, an ingenious method of suggesting an alternative way of industrial development. On the grounds of his explorations back on the Tokugawa period of Japan, he developed a framework where later industrial workforce was prepared by the virtues they have acquired during this era, basically heavy focusing on labour-productivity within a land-scarce environment. So unlike the ‘West’, Japanese way was rather learning methods on labour-intensification rather than labour-saving. This was again, contradicting the Kuznetsian insight where technological growth would eventually lead industries to move from labour-intensive into a capital-intensive form.
Jan De Vries has taken a different standpoint and unlike Hayami, he suggested a different way of utilizing this concept of ‘industrious revolution’ within the context of European growth paradox. Within this paradox, it has been widely believed that during the late 15th or early 16th centuries up until the 1780s, the product per capita was rising however, there was a strong trend in real wages to decline. He draw attention to the ‘demand-side’ or household consumption patterns and concluded that it was not the supply side considerations that have led this ‘industrious revolution’ but instead it was the changing tastes; the households did no longer prefer to produce the consumption goods that they would like to use for themselves but instead, chose to acquire it via market so they needed wage labour.17
16 Akira Hayami, “Keizai Shakai No Seiritsu to Sono Tokushitsu ( The Emergence of the Economic Society and
Its Characteristics),” in Atarashii Edo Jidai Shi Zō O Motomete: Sono Shakai Keizai Shi Teki Sekkin, ed. Shakai Keizaishi Gakkai. [from old catalog (Tōkyō: Tōyō Keizai Shinpōsha, 52); cited by Jan De Vries, The Industrious
Revolution: Consumer Behavior and the Household Economy, 1650 to the Present (Cambridge ; New York:
Cambridge University Press, 2008), 78.
17 Jan De Vries, “Industrious Peasants in East and West: Markets, Technology, and Family Structure in Japanese and Western European Agriculture,” Australian Economic History Review 51, no. 2 (2011): 107–19.
15
Osamu Saito has challenged De Vries on his stand about ‘industrious revolution’ because he interpreted the conclusion of De Vries, a schism between the ‘market-led’ Smithian growth and shifting towards a more labour-intensive way of production. Saito rejected that industrious revolution occurred in Tokugawa Japan because there was a lack of market interaction or the environment was relatively lack of factor markets and instead, he advocated that despite the limited market growth and a moderate Smithian growth, shifting towards labour-intensive methods and market presence went hand in hand; they were not substitutes but complements. Saito suggested that Japanese way of industrialization was in conjunction with these pre-industrialization patterns of growth and the skills that have been acquired here were decisive once the ‘actual’ period of modern industrialization has come. We could infer from his implications that the uniqueness of Japanese industrialization could be a strong evidence against the Kuznetsian ‘one-goes-for-all’ way of industrialization conception. 18
18 Osamu Saito, “An Industrious Revolution in an East Asian Market Economy? Tokugawa Japan and Implications for the Great Divergence.” Australian Economic History Review 50, no. 3 (2010): 240–61.
16
Recent Approaches
Regional Focus
Recently, yet another issue while working with the national income accounts has emerged: the regional aspect. Actually, regarding the use of national income accounts, the problems with ‘aggregation’ and ‘border’ as well as ‘regional disparities’ issues has been well problematized long ago and a shift in the unit of analysis from national boundaries to regional units and a stronger focus on the spatial-temporal considerations while exploring on the long comparative transformations or economic phenomena as ‘the industrializations’, has been suggested by various scholars. Here, we would like to bring these new approaches together in two sub-sectors: problems of aggregation and regional inequality.
In one recent paper Stephen Broadberry, on the latest development of great divergence debate, emphasized upon the necessity of historical national accounts are needed even more in order to enlarge the scope extensively for comparative purposes, more regional disaggregation is also essential especially within the large countries. Broadberry came to two main conclusions: a. Despite the fact that the traditional view remains valid, that is to say, the roots of Great Divergence belongs to late medieval period and it was well underway during the early modern period however, it should not be neglected that there were even more divergences within both Asia and European continents. This ‘little divergences’ needs to be carefully studied in order to make sense of the industrialization.
17
One second aspect of the regional focus is actually on the regional disparities. The regional inequality concerns were first brought in the literature within British context by Jeffrey Williamson. Williamson, with an analogy with the Kuznetsian inverted U curve theory for inequality within a given national economy, claimed that in the first phase of growth, the inequalities between the regions are rising, indeed. However, when the productivity rises and technology is dispersed among the periphery, the regional disparities will dim down.19 Later on, this hypothesis was to be tested, by scholars from all over Europe, ignited to make a revisit to the economic history of their relevant country with a regional focus in the last quarter of 20th century. Roses et al. have made a quest for the reasons behind the upswing of Spanish regional inequality and came to the conclusion that in fact, there is rising inequality of regions20, on the contrary to the earlier hypothesis of Williamson and neoclassical free trade models; the most prominent was named as Heckscher-Ohlin trade theory. In another study, he came to the result that industrial specialization was one reason behind the regional disparities therefore; we can infer that the industrialization was on the driving seat and leading the regional disparities. 21
A more recent study, within the context of US economy, supports the findings of Williamson. Caselli and Coleman, points to the coexistence of two basic forces behind changes in regional economic inequality: industrial specialization and labour productivity differentials. The initial expansion of industrialization, in a context of growing economic integration of regions, promoted the spatial concentration of manufacturing in certain regions, which also benefited from the greatest advances in terms of labour productivity. Since 1900, the diffusion of
19 Jeffrey G. Williamson, “Regional Inequality and the Process of National Development: A Description of the Patterns,” Economic Development and Cultural Change, 1965, 1–84.
20 Joan Ramón Rosés, Julio Martínez-Galarraga, and Daniel A. Tirado, “The Upswing of Regional Income Inequality in Spain (1860–1930),” Explorations in Economic History 47, no. 2 (April 2010): 244–57.
18
manufacturing production to a greater number of locations has generated the emulation of production structures and a process of catching-up in labour productivity and wages. 22
There were also methodological suggestions in order to give an account for regional differentiations. Tom Geary and Frank Stark developed a short-cut method for allocating country level GDP estimates across regions. Their aim had two aspects in it: “to set out a
method for allocating aggregate estimates of GDP across component regions; and to put it into operation by making some estimates of regional GDP in the UK in the second half of the nineteenth century.” 23
They have reached to the conclusion that their newly developed method appears to be capable of generating fairly reliable and robust results in accordance with the particular assumptions about wages across industry that we have made for purposes of estimating country GDP between 1861 and 1911. 24
On the contrary, Nick Crafts have found firm evidence that in fact, the rising inequality among the regions is actually rising with a trend that much resembles the trend that has been established
22 Francesco Caselli and Wilbur John Coleman II, “The U.S. Structural Transformation and Regional Convergence: A Reinterpretation,” Journal of Political Economy, no. 3 (2001): 584–616.
23Frank Geary, “Examining Ireland’s Post-Famine Economic Growth Performance,” The Economic Journal : The
Journal of the Royal Economic Society, 2002, 932.