KADİR HAS UNIVERSITY SCHOOL OF GRADUATE STUDIES
PROGRAM OF MANAGEMENT INFORMATION SYSTEM
RSSI-BASED HYBRID ALGORITHM FOR REAL-TIME
PEDESTRIAN TRACKING IN INDOOR ENVIRONMENTS
BY USING RFID TECHNOLOGY
EBUBEKİR DEMİR
E bu be kir D E M İR M .S . T he sis 20 19
RSSI-BASED HYBRID ALGORITHM FOR REAL-TIME
PEDESTRIAN TRACKING IN INDOOR ENVIRONMENTS BY USING
RFID TECHNOLOGY
EBUBEK˙IR DEM˙IR
MASTER’S THESIS
Submitted to the School of Graduate Studies of
Kadir Has University in partial fulfillment of the requirements for the degree of Master of Science in the Program of Management Information Systems
DECLARATION OF RESEARCH ETHICS/ METHODS OF DISSEMINATION
I, EBUBEKIR DEMIR,hereby declare that;
e this master’s thesis is my ownoriginal work andthat due references have been appropri-ately provided onall supporting literature and resources;
e this master’s thesis contains no material that has been submitted or accepted for a degree or diploma in any other educational institution;
e I have followed Kadir Has University Academic Ethics Principles prepared in accor-dance with The Council ofHigher Education’s Ethical ConductPrinciples.
In addition, I understandthat any false claim in respect of this workwill result in disciplinary action in accordance with University regulations.
Furthermore, both printed and electronic copies of my work will be kept in Kadir Has Informa-tion Center under the following condiInforma-tion as indicated below:
The full content of my thesis will be accessible only within the campus of Kadir Has /
KADIR HAS UNIVERSITY SCHOOL OF GRADUATE STUDIES
ACCEPTANCE AND APPROVAL
This work entitled RSSI-BASED HYBRID ALGORITHM FOR REAL-TIME PEDESTRIAN TRACKING IN INDOOR ENVIRONMENTS BY USING RFID TECHNOLOGYprepared by EBUBEKIR DEMIR has been judged to be successful at the defense exam held on 24.06.2019 and accepted by our jury as MASTER’S THESIS
APPROVEDBY:
Asst. Prof. Dr. Mahmut CAVUR(Advisor) >
Kadir Has University
Prof. Dr. Lütfiye Durak ATA
İstanbul Technical University ol. DEK
Asst, Prof. Dr. Emrullah Fatih YETKİN Kadir Has University
I certify that the above signatures belong to the faculty members name
DATE OF APPROVAL:
TABLE OF CONTENTS
ABSTRACT . . . i ¨ OZET . . . ii ACKNOWLEDGEMENTS . . . iii DEDICATION . . . iv LIST OF TABLES . . . v LIST OF FIGURES . . . viLIST OF SYMBOLS/ABBREVIATIONS . . . viii
1. INTRODUCTION . . . 1
1.1 Motivation of the Thesis . . . 1
1.2 Aim and Objective of the Thesis . . . 2
1.3 Main Contribution . . . 3
1.4 Organization of the Thesis . . . 3
2. BACKGROUND . . . 5
2.1 Positioning Systems . . . 5
2.1.1 Global Positioning System (GPS) . . . . 5
2.1.2 GSM . . . . 7
2.1.3 UWB . . . . 7
2.1.4 Wi-Fi . . . . 7
2.1.5 Bluetooth . . . . 8
2.1.6 RFID . . . . 8
2.2 Active RFID Positioning System Components . . . 8
2.3 Positioning Approach . . . 9
2.4 Wireless Positioning Algorithms . . . 9
2.4.1 Trilateration . . . . 9
2.4.2 Cell of Origin (CoO) . . . . 11
2.4.3 Fingerprinting . . . . 12
2.5.1 K-Nearest Neighbour Algorithm . . . . 13
2.5.2 Maximum Likelihood Algorithm . . . . 14
2.6 RSS Propagation Models . . . 15
2.7 System Performance Metrics . . . 15
2.8 RFID Positioning Systems Design Challenges . . . 17
3. LITERATURE REVIEW . . . 18
4. PROPOSED SYSTEM, ALGORITHM AND ARCHITECTURE . . . 21
4.1 Proposed System Architecture . . . 21
4.2 RFID Reader Communication Protocol . . . 23
4.3 Hybrid Algorithm . . . 25
4.3.1 Offline Phase . . . . 25
4.3.2 Online Phase . . . . 26
5. EXPERIMENTAL RESULTS . . . 43
5.1 Tuning Parameters . . . 47
6. CONCLUSION AND FURTHER RECOMMENDATIONS . . . 51
6.1 Conclusion . . . 51
6.2 Further Recommendations . . . 52
REFERENCES . . . 53
CURRICULUM VITAE . . . 57
APPENDIX A: INTERFACE OF THE SOFTWARE . . . 58
RSSI-BASED HYBRID ALGORITHM FOR REAL-TIME PEDESTRIAN TRACKING IN INDOOR ENVIRONMENTS BY USING RFID TECHNOLOGY
ABSTRACT
The usage and importance of Location Based Services for indoor environments are increasing recently. The knowledge of the exact and real-time location is required by many of these ser-vices. Since Global Positioning System (GPS) is not designed for indoor environment, new positioning systems based on new technologies and methods are needed for these type of en-vironments. In this thesis, RFID-based real-time indoor positioning systems and algorithm are developed. Received Signal Strength (RSS) based positioning techniques, are studied in detail. A hybrid algorithm is developed which depends on the mainly fingerprinting. The advantages of each method are emphasized. An original and unique hybrid algorithm is developed in this study in order to overcome available algorithm’s’ drawbacks. The algorithm and methodology is tested in two different indoor environments. As a result, the accuracy of this original and unique methodology and algorithm is 2,5 m.
Keywords: RFID technology, indoor positioning, Received Signal Strength, fingerprinting, WKNN
RFID TEKNOLOJ˙IS˙I KULLANARAK KAPALI ALANLARDA GERC¸ EK ZAMANLI RSSI TABANLI H˙IBR˙ID YAYA TAK˙IB˙I ALGOR˙ITMASI
¨
OZET
Kapalı ortamlarda lokasyon bazlı hizmetlerin kullanımı ve ¨onemi her gec¸en g¨un artmaktadır. Bu servisler ic¸in tam ve gerc¸ek zamanlı konum bilgisi gerekmektedir. Ulusal Konumlandırma Sistemi (GPS) kapalı ortamlar ic¸in tasarlanmadı˘gından bu tip ortamlar ic¸in yeni teknolojiler ve yeni methodlar kullanan yeni konumlandırma sistemlerine ihtiyac¸ duyulmaktadır. Bu tez c¸alıs¸masında, RFID tabanlı gerc¸ek zamanlı ic¸ mekan konumlandırma sistemleri ve algorit-maları gelis¸tirilmis¸tir. Alnan Sinyal G¨uc¨u (RSS) tabanlı konumlandırma teknikleri, detaylı olarak incelenmis¸tir. Bas¸lıca sinyal haritasına dayanan bir hibrid algoritma gelis¸tirilmis¸tir. Her y¨ontemin avantajları vurgulanmıs¸tır. Mevcut algoritmaların yetersizliklerine c¸¨ozum olacak or-jinal ve ¨ozg¨un bir hibrit algoritma gelis¸tirilmis¸tir. Gelis¸tirilen algoritma ve y¨ontem 2 farklı kapalı alanda test edilmis¸tir. Bu orjinal ve ¨ozg¨un metodoloji ve algoritmanın do˘grulu˘gu 2,5 m’dir.
Anahtar S¨ozc ¨ukler: RFID teknolojisi, kapalı alan konumlandırma sistemi, Alınan Sinyal G¨uc¨u, parmak izi y¨ontemi, WKNN
ACKNOWLEDGEMENTS
I thank Allah for the endless blessings and the care that was poured out upon me through the people who have made this experience of mine smooth and fruitful.
Among these people is my advisor, Asst. Prof. Dr. Mahmut C¸ AVUR, who I am indebted to for his sincere guidance, support, and unceasing encouragement.
I am also immensely grateful to my teachers, Prof. Dr. L¨utfiye Durak ATA and Asst. Prof. Dr. Emrullah Fatih YETK˙IN for his sincere guidance and support.
I am also immensely grateful to my loving parents, who without their encouragement, support, and prayers, this thesis wouldnt have been possible.
LIST OF TABLES
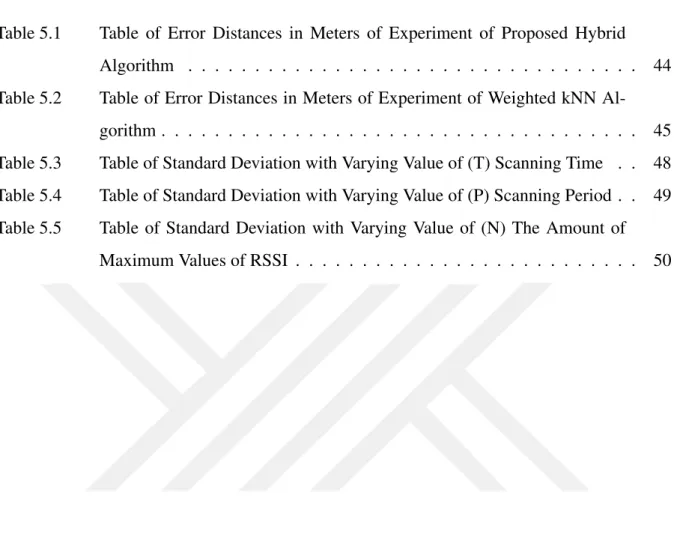
Table 5.1 Table of Error Distances in Meters of Experiment of Proposed Hybrid Algorithm . . . 44 Table 5.2 Table of Error Distances in Meters of Experiment of Weighted kNN
Al-gorithm . . . 45 Table 5.3 Table of Standard Deviation with Varying Value of (T) Scanning Time . . 48 Table 5.4 Table of Standard Deviation with Varying Value of (P) Scanning Period . . 49 Table 5.5 Table of Standard Deviation with Varying Value of (N) The Amount of
LIST OF FIGURES
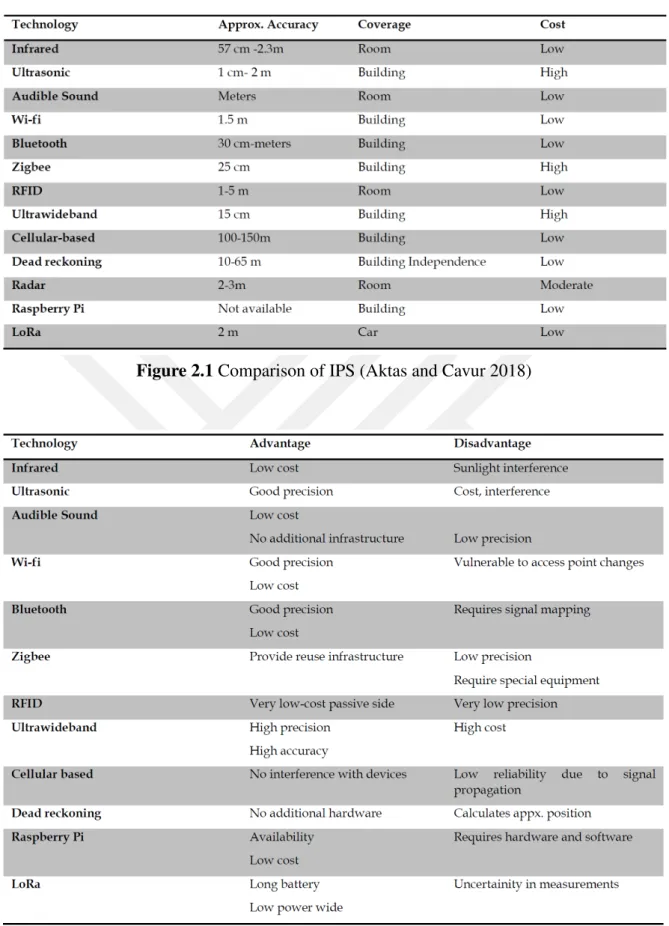
Figure 2.1 Comparison of IPS (Aktas and Cavur 2018) . . . 6
Figure 2.2 Advantages and Disadvantages of IPS (Aktas and Cavur 2018) . . . 6
Figure 2.3 Trilateration Based Positioning . . . 10
Figure 2.4 Angle of Arrival Based Positioning . . . 10
Figure 2.5 Cell of Origin Example Coverage Area . . . 12
Figure 2.6 Cell of Origin Accuracy Example . . . 12
Figure 4.1 Proposed System Architecture Test Environment #1 . . . 22
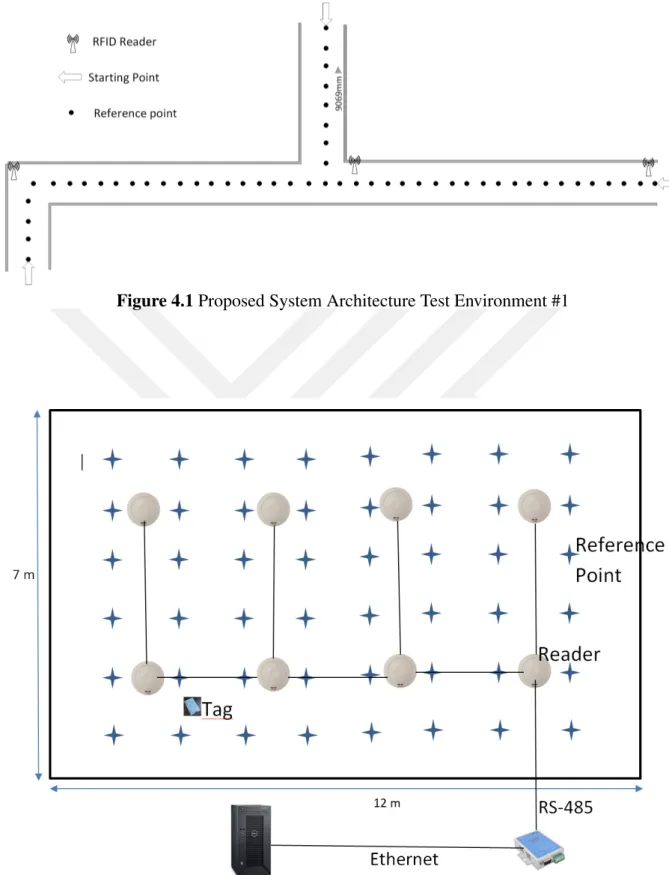
Figure 4.2 Proposed System Architecture Test Environment #2 . . . 22
Figure 4.3 The Reader Used in Experiments . . . 23
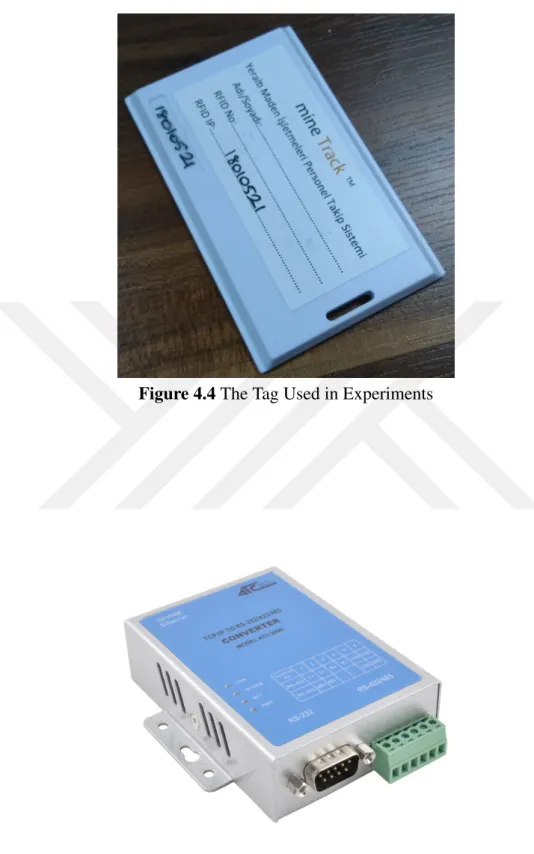
Figure 4.4 The Tag Used in Experiments . . . 24
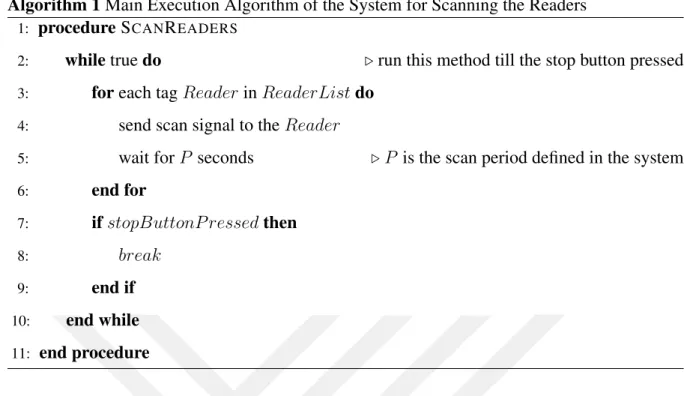
Figure 4.5 The RS485-Ethernet Converter Used in Experiments . . . 24
Figure 4.6 Main Execution Algorithm of the System for Scanning the Readers . . . . 25
Figure 4.7 Flow Chart of Offline Phase (Fingerprinting) . . . 26
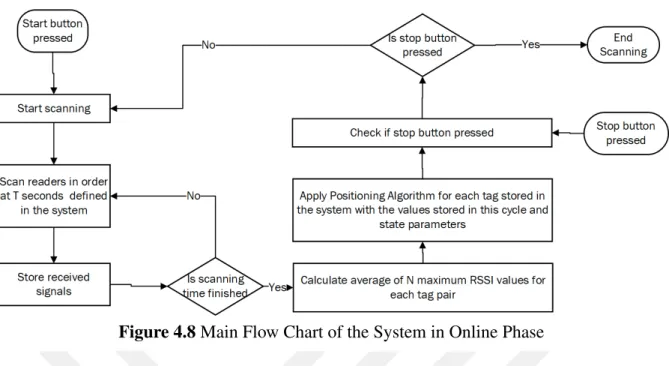
Figure 4.8 Main Flow Chart of the System in Online Phase . . . 27
Figure 4.9 Flow Chart of Decision of Which Positioning Algorithm Will Be Used . . 28
Figure 4.10 Flow Chart of the Starting Point Algorithm . . . 29
Figure 4.11 Decision Algorithm if a tag already has been positioned . . . 29
Figure 4.12 Algorithm to Set the Initial State Parameters . . . 30
Figure 4.13 Algorithm to Set the Initial Position . . . 31
Figure 4.14 Flow Chart of One Reader Algorithm . . . 32
Figure 4.15 Positioning Algorithm by Using RSSI from One Reader . . . 33
Figure 4.16 An Example Illustration of Reference Point List and Circle Intersection at One Point . . . 34
Figure 4.17 An Example Illustration of Reference Point List and Circle Intersection at Two Points . . . 35
Figure 4.18 An Example Illustration of Reference Point List and Circle Intersection at Three Points . . . 36
Figure 4.20 Flow Chart of Two Readers Algorithm . . . 38
Figure 4.21 Flow Chart of Three or More Readers Algorithm . . . 40
Figure 4.22 Algorithm for Updating State Parameters . . . 42
Figure 5.1 8 Test Point Used in Experiments at Proposed System Architecture #1 . . 44
Figure 5.2 Cumulative Distribution Function of Error Measured in Experiments . . . 46
Figure 6.1 Software Interface: Data Terminal Status Menu . . . 58
Figure 6.2 Software Interface: Reader Status Menu . . . 59
Figure 6.3 Software Interface: Add Layer Menu . . . 59
Figure 6.4 Software Interface: Main Menu . . . 60
Figure 6.5 Software Interface: Signal Map Menu . . . 60
Figure 6.6 Software Interface: Add Employee and Tag Menu . . . 61
Figure 6.7 Software Interface: Add Machine and Tag Menu . . . 61
Figure 6.8 Software Interface: Daily Report Menu . . . 62
Figure 6.9 Software Interface: Staff Report Menu . . . 63
Figure 6.10 Software Interface: Admin Login menu . . . 63
Figure 6.11 Software Interface: Button Bar . . . 63
Figure 6.12 Software Interface: Layers Panel . . . 64
LIST OF SYMBOLS/ABBREVIATIONS
GPS Global Positionig System RFID Radio Frequency Identification
Wi-Fi Wireless Local Area Network implementation based on series of 802.11 standards
RSS Received Signal Strength
RSSI Received Signal Strength Indicatior GSM Global System for Mobile
GLONASS Globalnaya Navigazionnaya Sputnikovaya Sistema, or Global Navigation Satellite System
IRNSS The Indian Regional Navigational Satellite System ToA Time of Arrival
TDoA Time Difference of Arrival AoA Angle of Arrival
UWB Ultra Wide Band
ISM Industrial, Scientific, and Medical Frequency Band IEEE Institute of Electrical and Electronics Engineers kNN k-Nearest Neighbour Algorithm
WkNN Weighed k-Nearest Neighbour Algorithm LoS Line of Sight
NLoS Non-Line of Sight RF Radio Frequency
WLAN Wireles Local Area Network AP Access Point
GUI Graphical User Interface
GIS Geographical Information System
RS232 Recommended Standard 232, a standard for serial communication RS485 Recommended Standard 485, a standard for serial communication TCP/IP Transmission Control Protocol/Internet Protocol
CDF Cumulative Distribution Function
1. INTRODUCTION
1.1 Motivation of the Thesis
The interest in indoor positioning has been increased in the last few decades. Global Posi-tioning Systems (GPS) technology is insufficient for indoor localization. Not only the human activities inside buildings but also underground mines and facilities demand indoor positioning that cannot be accomplished by the current Global Positioning Systems (GPS) infrastructure. Because of the non-line of sight circumstances and less propagation of GPS signals over build-ing walls and other blocked materials, GPS has significant concern for indoor localization. Consequently, new research attempts are focused to find GPS alternatives that can handle a better indoor positioning coverage for mobile and pervasive location-based services associated with huge buildings and underground facilities. Indoor positioning enables an extensive range of applications and services, such as employee tracking, vehicle tracking, asset tracking, etc.
Miscellaneous systems such as RFID-based, systems, Wi-Fi based systems, cellular-based sys-tems, infrared-based systems have been researched in the literature to improve indoor posi-tioning. RFID-based system is one of the alternative investigation topic so as to complement GPS in indoor environments. More specifically, using active RFID systems is promising due to their extended reading range i.e. up to 100 meter. In this thesis, Radio frequency identi-fication (RFID)-based indoor positioning is investigated. Specifically, RFID received signal strength (RSS) indoor models are improved and fingerprinting based localization algorithms and techniques are proposed.
Another important motivation to study indoor positioning is that recent development about the Internet of Things (IoT). Because of new development in technology and internet, the smart-things concept (e.g. smart home, smart office, smart sensors) is now the part of daily life.
For that reason, not only scientific world but also business world has started to develop new application, software, system and algorithms are to provide various type of smart services for citizens and customers. Indoor positioning in big malls, airports, hospitals can create critical services to increase the quality of life. Therefore, accurate system and algorithms can help and create new services.
Last but not least, the technical difficulty of RFID and RSS-based signal requires state-of-art techniques, algorithms and filters to localize the object in indoor environments accurately. These problems create important opportunities for scientists in order to study on indoor posi-tioning. Therefore, these opportunities has created chance to find state-of-art algorithms and techniques to overcome before-mentioned problems.
1.2 Aim and Objective of the Thesis
The main objective of this thesis is to provide a framework and a unique algorithm for indoor positioning. RFID-based system is the alternative investigation technology so as to comple-ment GPS in indoor environcomple-ments. There are various technologies that can be applied in indoor environment like bluetooth, wi-fi, infrared etc. Each has even advantages and disadvantages with respect to various metrics. RFID is one of these technologies which has so many appli-cations for different fields. More specifically, using active RFID systems is promising due to their extended reading range i.e. up to 100 meter and several other advantages. In this thesis, Radio frequency identification (RFID)-based indoor positioning is investigated. Specifically, RFID received signal strength (RSS) indoor models are improved and fingerprinting based lo-calization algorithms and techniques are developed and proposed. First of all, the technology and its components are studied in sufficient detail in this study. Their advantages and disadvan-tages are compared, explained and clarified. The technology and its components are selected with respect to case environment which is mentioned in the following sections. Then, the ar-chitecture is designed with respect to selected technology and its components. Not only the technology and but also the architecture should be practically implemented in real-case envi-ronment. Therefore, the architecture and technology requirements are examined and designed
in detail. Finally, state-of-art algorithm is developed to localize the object in indoor environ-ment accurately. The performance of the system and the accuracy of the algorithm should be satisfactory with respect to previous studies.
1.3 Main Contribution
This study provides several contributions towards the indoor positioning community. The most significant originality of the study is behind the proposed framework and algorithm. The appli-cation of this framework and algorithm is applicable and suitable for any indoor environment which is explained in experimental section. Indoor localization technology for indoor navi-gation is not obvious and it is a difficult task to improve the reliability and accuracy of the systems. Design of indoor positioning systems has particular challenges such as dynamic na-ture and complex strucna-ture of indoor environments. The technology has already been examined for several years in research projects and many solutions have been proposed in literature. Up until this day, the need for high accuracy indoor localization is still big and booming. The main areas of study is to help users navigate inside large, open and complex indoor environments (e.g. airport, train station, shopping mall) or administrators to track employee, asset, vehicle inside administrative area (e.g. factory, underground mine, goods storage area). In addition to the framework and the algorithm, there are several other reasons why this study is unique and valuable. First, the proposed framework is unique and applicable for various type of indoor environment. Second, the algorithm is unique and reliable for indoor positioning for RFID technology with respect to RSS value. Third, the performance of the developed system is satis-factory comparatively. Finally, the accuracy of the positioning is satissatis-factory due to application of three scientifically acceptable algorithm.
1.4 Organization of the Thesis
The thesis includes six chapters that cover the corresponding subjects in an organized manner. A brief description of each chapter is as follows:
• Introduction is chapter one and defines the motivation, aim and scope. In addition, it explains the problem statement and main contribution of this study.
• Background is chapter two and explains the Positioning Systems, Approach and Tech-nologies. Also, it defines the several critical metrics to analyze the success of an local-ization systems.
• Literature Review is chapter three and emphasizes the importance of the indoor local-ization. It explains the overview of localization technologies, techniques, algorithms, systems for indoor environment.
• The Proposed System Architecture is chapter four and this is the most technical chapter to define and explains the framework and the methodology.
• Experimental Result is chapter five and explains the implementation of framework and the usage of three implemented algorithm with their results.
• Conclusion and Further Recommendations is the final chapter that summarizes this study with discussion, further research and conclusion.
2. BACKGROUND
2.1 Positioning Systems
Positioning is the process of tracking and identifying of people, equipment, and objects. There are several potential positioning systems. Each of which has its advantages and shortcomings. A list of positioning systems that utilize existing infrastructure is highlighted below:
2.1.1 Global Positioning System (GPS)
GPS is an outdoor positioning system that was fully functionally installed in 1994. It is widely used positioning system in outdoor environments. GPS consists of 24 satellites surrounding Earth. The devices with GPS module integrated receive signal from at least 4 satellites to determine the location itself. Time of Arrival (ToA) and Time Difference of Arrival (TDoA) methodologies are used to determine distance from the satellites. Distance information to-gether with the coordinates of the satellites are sufficient to uniquely determine the location of the receiver. Constant distance from a satellite creates a sphere at space centered at the satellite. Three spheres intersect at a single point which gives for two dimension of the po-sition estimation of the receiver device. Fourth satellite is needed for three dimension of the position estimation of the receiver device. Time synchronization is critical for ToA and TDoA based algorithm and positioning. So, ground stations administrates the satellites by controlling and monitor speeds and synchronizing the clocks. Line of Sight is required for GPS system since ToA and TDoA are employed. Besides, weather conditions that causes delay of signals affects the accuracy of GPS system. Since GPS is administrated by US Government, other outdoor positioning systems with similar architecture was proposed by other governments like GLONASS, Galileo, Compass and IRNSS. The accuracy of the GNSS system is up to 10-20 m
Figure 2.1 Comparison of IPS (Aktas and Cavur 2018)
but the accuracy is assisted by ground station and decreases up to cm level.
2.1.2 GSM
GSM network is the abbreviation of Global System for Mobile communications network which refers to networks consists of base stations and mobile switching centers that covers geograph-ical areas to enable mobile devices communicate in between or other voice or data networks. Each base station forms a cell together with its coverage area. Thats why it is cellular network is called interchangeable with GSM network. Each base station is identified with its Cell-ID that the location information can be extracted. Since Cell-ID is shared with the mobile devices in the cell. Mobile switching center forwards the user to the closest base station. The position of the caller is estimated as the position of the base station which is basically the center of the cell. A typical implementation of proximity technique is implemented. The accuracy of the system varies from 2 km to 20 km which is very poor performance.
2.1.3 UWB
Ultra-Wideband (UWB) is an RF technology that indoor positioning can be implemented with centimetre level accuracy with low power consumption. The high accuracy behind the UWB depends on the ToA information provided by the UWB. This technology is emerging and ex-pected to be embedded in smart phones in near future.
2.1.4 Wi-Fi
Wi-Fi is widely used WLAN technology that enables wireless devices network access. 802:11 b,g,n,ac are The Institute of Electrical and Electronics Engineers (IEEE) standards that Wi-Fi is based on. 2.4 GHz and 5 GHz frequency bands are used at Wi-Fi with varying data rates from 10 Mbps to 1 Gbps. Received Signal Strength (RSS) methods can be implemented for indoor localization with Wi-Fi infrastructure. Wi-Fi coverage is maximum 50 meter for each Access Point (AP) that is enough for indoor localization. Besides, the cost of the system can
be evaluated as cheap.
2.1.5 Bluetooth
Bluetooth is wireless technology operates on ISM (Industrial, Scientific, and Medical) 2.4 GHz frequency band. Bluetooth functions up to 15 meter coverage at a 1 Mbps bandwidth. Received Signal Strength (RSS) based localization can be implemented Bluetooth technology by using uniquely identified Bluetooth tags.
2.1.6 RFID
Radio Frequency Identification (RFID) tags haw two types, namely passive and active. Passive RFID tags have range limitations that require a tag reader be placed on close proximity in order to read it. The coverage area of the system with passive RFID tags is limited. Active RFID tags have wider range as compared to passive tags. Active RFID reader range can be extended to 100 meter for some products. Similar to Bluetooth and Wi-Fi, Active RFID technology can be used for the operation of positioning system.
2.2 Active RFID Positioning System Components
The positioning system architecture consists of the following units:
RFID tags. Each tracked object is attached with a unique active RFID tag in order to identify and track the object. Active RFID tags responses to the requests of readers with their unique identifier.
RFID readers. RFID readers are the main infrastructure of the system so that RFID readers measure the RSSI value for each tag within its coverage area and sends to the server through communication interface. RFID readers should be located throughout the detection area such that RFID readers cover the whole area.
Data Terminal. Data Terminals are used as part of the system when incompatibility occurs in between the interfaces of readers and server. Data Terminal converts serial communication data to IP packet and IP packets to serial communication data.
Server. Server collects all the information gathered from data terminals. Location estimation of the tags is done on the server by using collected information received from the readers.
Network and Communication Channel. Communication interface between server and RFID readers may be wired or wireless, i.e. Wi-Fi, Ethernet, RS232 etc.
2.3 Positioning Approach
Positioning approach differs in the way in which the data is processed. In Centralized method, localization is centrally calculated. On the contrary, localization is distributed on mobile de-vices at decentralized method. System design and system topology vary according to posi-tioning approach. System components, component arrangement and distribution together with intended component task depend on the positioning approach. In active RFID Positioning sys-tem centralized approach is implemented since RFID tags has limited processing capability.
2.4 Wireless Positioning Algorithms
Trilateration, Cell of Origin (CoO), and fingerprinting are three main indoor positioning algo-rithms. Each algorithm is explained in the following subsections in more detail.
2.4.1 Trilateration
Euclidean Geometry is used to find the position of the target in this method. Measurement of distances with the help of circles, spheres or triangles are used for determining of positions. Distance measurements from known reference points are the basis of the locating a target mo-bile object. Time of Arrival (ToA) method is a technology that enables distance measurement
Figure 2.3 Trilateration Based Positioning
of two points since signal propagation time is directly proportional to the distance travelled by the RF signal. The velocity of signal and the travel time through two points (reference point and blind point) are required to determine the distance. ToA method uses time stamps to carry the departure and arrival time information. ToA method needs time synchronization since travel time is extracted from the absolute time source. Time Difference of Arrival (TDoA) elimi-nates synchronization requirement. TDoA uses the differences in time of travel for distance measurement, instead of absolute time source. Both in ToA and TDoA methods measuring the travel time precision should be in nanoseconds level as RF signal propagates with the velocity of light. Also, Line-of-Sigt (LoS) conditions should be met in trilateration methods. RSSI is another method to measure the distance of two points. Distance from the signal source can be extracted by using path loss model. As the distances from three reference points are known, position estimation can be done by intersecting the spheres (or the circles in 2D) centered at the reference points with radii of distances measured by one of ToA, TDoA or RSSI as shown in 2.3. Angle of Arrival (AoA) method calculates the arrival angle at the receiver that requires more complicated hardware than ToA and TDoA. Two reference point is needed in order to estimate the position of the target with AoA method as shown in 2.4.
distance = speed × time (2.1)
In ToA or TDoA methods basic speed equation is used to determine the distance for trilatera-tion. Light or sound waves are mostly in these methods. Since speed of light or speed of sound at used medium is known and constant. Distance travelled by the light waves or sound waves can be easily extracted by using the above formula.
2.4.2 Cell of Origin (CoO)
The basic localization method is proximity. This method is the first positioning algorithm originated form E911. When a signal is received from a reference point related with a target, location of the target is estimated as the position of the reference point. The simplicity of the algorithm reduces computational complexity of positioning. However, low resolution and dense reference point requirements are the drawbacks of this method. GSM network is an implementation of proximity positioning technique. The resolution of this method depends on
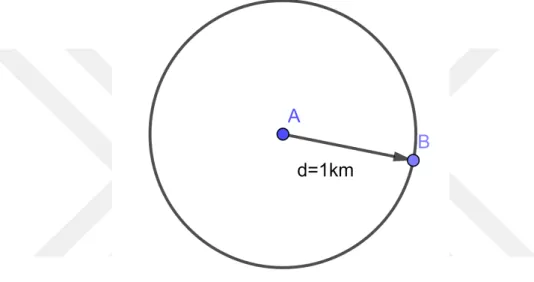
Figure 2.5 Cell of Origin Example Coverage Area
Figure 2.6 Cell of Origin Accuracy Example
the distance of the object and the nearest base station. Figure 2.5 shows an example coverage area of CoO method. The location of the target is estimated as the center of the cell if it is in that circle. CoO method has drawbacks if these circles have intersection areas or if target is not in any of the cells. Figure 2.6 shows an example accuracy. In this example accuracy of the system is 1 km.
2.4.3 Fingerprinting
The algorithm in which locations in detection area are correlated with a unique signal parameter to that location is called fingerprinting. Received signal strength (RSS) per location is the
commonly used finger printing parameter as well as other location dependent signal parameters can be used. Fingerprinting method is executed in two phases:
Offline phase. Grid points are determined over the detection area. The RSS values received from readers in the area are collected at grid points during the offline phase. RSS model is cre-ated for the indoor environment. Collected fingerprint information is stored in a database called signal map. Signal map is main input for estimating the user location in online phase. This is one of the disadvantage of the fingerprinting method since the signal map should be collocated for every case study and for the new environment. Collecting signal for each environment is costly with respect to money and time.
Online phase. Real time RSS measurements of the mobile target are compared with the signal map for the detection area by using a positioning algorithm. The disturbance in RSS measurements is handled by fingerprinting method since signal map is also created by the RSS measurements affected from disturbance in the same way. Multipath and fading effects are taken into consideration by fingerprinting method intentionally.
2.5 Fingerprinting Localization Algorithms
During the online phase determining the position needs localization algorithms as mentioned in the fingerprinting chapter. Deterministic algorithms and probabilistic algorithms are the two types of positioning algorithms used in fingerprinting localization method. Widely used examples of each type are described in detail below.
2.5.1 K-Nearest Neighbour Algorithm
kNN (k-nearest neighbour) is the commonly used deterministic location algorithm used in fin-gerprinting method. Basic goal of kNN is to find the closest grid points in the signal map to the target point by comparing the fingerprint data and actual RSS received. This algorithm defines
the RSSI distance between the target and grid point as:
R(i,t) =
q PN
n=1(RSSIin− RSSItn)2 (2.2)
where RSSindenotes the RSSI value of ith reference point from the nth reader, RSStndenotes
the RSSI value of target point from the nth reader and N is the number of reader RSSI signal re-ceived (Ni et al. 2003). Both target and grid have rere-ceived RSSI values from N readers. RSSI distance is calculated between the target and all reference points. Smaller RSSI distance means target and reference points are closer to each other. kNN algorithm uses average of the k closest grid point for estimating the location of target.
(x, y)t = 1kPki=1(xi, yi) (2.3)
where (x, y)tdenotes the estimated position of target, xi, yi denotes the actual position of the
ith closest with respect to RSSI distance reference point and k denotes the how many nearest neighbours will be taken into account and is set before algorithm works.
Weighted kNN algorithm uses weighted average of the k closest reference points.
(x, y)t = 1 Pk i=1 1 R2 (i,t) × k X i=1 1 R2 (i,t) (xi, yi) (2.4)
where (x, y)tdenotes the estimated position of target, xi, yi denotes the actual position of the
ith closest with respect to RSSI distance reference point, k denotes the how many nearest neighbours will be taken into account and is set before algorithm works, R(i,t) denotes the
RSSI distance as defined above. Since WkNN weighting the reference points, WkNN algo-rithm gives more accurate results. Selecting k and weighing the points are significant in terms of the accuracy of the system.
2.5.2 Maximum Likelihood Algorithm
Maximum likelihood is the probabilistic algorithm to estimate the target position. Joint prob-ability distribution of RSS from each reader at each grid point is needed. In offline phase, Probability Density Functions (PDF) of each grid point for the each reader is determined. To
be independent. Although it is not clear that PDFs are disjoint. So, joint PDF becomes the multiplication of the each PDF. In online phase, received RSS signals of target point are in-cluded in the resulting PDF function. Position is estimated as the grid point which maximizes the resulting PDF. The details of this algorithm are described in (Karimi 2016).
2.6 RSS Propagation Models
RSS propagation modelling is the location method that does not need fingerprinting. Offline phase of fingerprinting and signal map creation operation is replaced with distance formula related with RSSI value of RF signal. Expensive fingerprinting calibration phase is not required with propagation models. Path loss model calculates the signal propagation in free space with the formula:
Pr = P0 − 10n log10
dr
d0
(2.5)
P0 is the power at a reference point d0, dris the distance and n is the path loss exponent. It is
known that n = 2 in free space. However, n may vary from 4 to 6 in indoor environment con-ditions. Formula indicates that power density of the signal decays logarithmic as signal travels through the free space. Knowing the parameters in the formula, distance can be extracted from RSS value. So, trilateration method is used to estimate the position of the device. Indoor envi-ronments have dense multipath and NLoS conditions that deviates RSS patterns from the path loss model. RSS deviation leads to high distance errors which causes poor position estimation. Thats why path loss model is not applied in indoor environments.
2.7 System Performance Metrics
There are various type of technology, framework, algorithm and filters for positioning in indoor environments. However, there should be criteria to compare and measure the performance of each positioning system. (Aktas and Cavur 2018) defined several metrics to measure the performance of positioning system : accuracy, availability, coverage area, cost and privacy. To do so, there should be several metrics to measure the developed framework and algorithms. Accuracy is the most significant performance metric. However, accuracy itself is not enough
to show the performance of the positioning system. There are some other critical performance criteria evaluating the positioning system and comparing them. Some performance metrics are listed below:
Accuracy. Location error determines the accuracy of a locating system. Accuracy is defined as the mean distance error between the actual and estimated position.
Precision. Consistency and coherence of the system define the precision. At each attempt to estimate the distance for the same target system should give the same or similar results. This can be evaluate by using the standard deviation of the error function. Higher system performance indicates smaller mean value of standard deviation.
Complexity. Complexity can be evaluated in two categories, software and hardware. Software complexity refers to the software to estimate the location. The localization algorithm used differs the computational time elapsed and the power used. Computational complexity of the algorithm affects the software performance which may be crucial for the battery powered and low processing capability devices. Hardware complexity refers to the hardware used which is out of the scope of this thesis.
Robustness. Small changes of the system or changes in physical conditions may affect the system functions. Highly robust systems should be up and running at almost every conditions.
Cost. Not only the financial costs but also the time, space and energy cost should be evaluated for the requirement of an indoor positioning system. Space needed for installation, time needed for installation and maintenance ,and energy that the system consumed should be taken into account as performance metric.
Scalability. The capacity of designed system, for indoor positioning systems mostly referred to detection area, can be changed easily at a scalable system without affecting the other per-formance metrics. As the capacity increases the cost and the complexity of the system should
increase at most proportional to the coverage area. And, Accuracy, precision ,and robustness of the system should remain in the same order.
2.8 RFID Positioning Systems Design Challenges
RSS can be used for distance calculation and there are several scientific researches about RSS-based indoor positioning using RFID technology(C¸ avur 2018). However, many challenges oc-cur while reading RSSI measurements of the RFID devices since RFID is not designed mainly for the positioning purposes. The challenges are listed below: RSSI variations: Environmental noise is added to the RSSI value that causes RSSI value deviations. NLoS cases and the vari-ations of nature of the environment are the main causes of the noise at indoor environments. NLoS conditions are analyzed in detail at (Liu et al. 2013). At NLoS conditions, RF signal travels through different paths by reflecting and refracting which arises multipath problem. Multipath problem hides the actual RSS value that distance will be extracted. Besides, moving objects, mostly people at around, causes environmental variations. Interference: Frequency band of RFID technology is unlicensed. So, same frequency band may be used by any other device which causes interference. Besides, human body itself , composed of Latency: To track an object location determination should take place in real time. So, scanning the signals, net-work latencies, hardware-dependent latencies, computational complexity based latencies etc. suffer real time processing.
3. LITERATURE REVIEW
Literature review and related studies that enlightens the aspects of locating systems based on RSS and mainly RFID are outlined in this chapter. Also, existing RSS based systems and recent advances in indoor locating systems are discussed.
RFID technology has been being used in many areas locating and identifying systems. Most of the passive RFID-based technology positioning system are using proximity method. Since, passive RFID systems has poor coverage area. Still, many researches are focused on general purpose positioning systems based on passive RFID technology such as (Bechteler and Yeni-gun 2003), (Y. Zhang, Amin, and Kaushik 2007),(Chawla, Robins, and L. Zhang 2010),and (Savochkin 2014), . Besides, passive RFID locating systems on particular context such as robotic industry (Tralie and Fellow n.d.) and (Hahnel et al. 2004), medical industry (Tsai et al. 2006), and library (Choi, Oh, and Song 2006) are the principal applications of the passive RFID technology which is easy to implement and cheap.
Semi-active RFID is the middle stage between passive and active system. It has a medium range with respect to rest of the system. The tag in this system has battery inside but powered by RFID receiver. (C¸ avur 2018) and (Athalye et al. 2013) have used semi-active RFID tags for indoor localization.
Active RFID is one step further than passive. Since, it has long range and battery powered tags. Active RFID based positioning systems are mostly based on RSSI. Besides, there are some researches focused on phase difference for positioning based on RFID technology (Hekimian-Williams et al. 2010). RSS Based positioning systems have significant challenges as described in the previous section. So, each RSS based research has its own advantages and drawbacks.
Researchers are mostly studied on Wi-Fi systems focusing on RSS based positioning. Since, Wi-Fi is the widely used and easy to implement technology worldwide. These researches may be applied to other RSS based positioning system technologies such as RFID, Bluetooth etc. Since, external influences of the RSS are common in all technologies.
Because the measured RSS value probably has high noise and can easily be effected from environmental changes, kalman filter or extended kalman filter is applied to improve the system performance (Guvenc 2003). (ibid.). (Chadaporn, Baber, and Bakhtyar 2014) shows a simple example of extended kalman filter. Another filtering method is particle filtering. (Gustafsson et al. 2002), (Gustafsson 2010) and (Wang et al. 2007) describe how to implement particle filter for the positioning and tracking applications. In addition to these known filters, there are several other studies concentrating on the unique filters to find the neighbouring or direction of the moving objects in indoor environment which emphasize the importance of the filters in indoor positioning(C¸ avur and Demir 2017).
Using reference tags is alternative method in RSS based positioning systems. (Huang, Janaswamy, and Ganz 2006) and (Ni et al. 2003) are typical examples of reference tag usage while locat-ing RFID tags. As target and reference tag RSSI values are influenced in the same way, uslocat-ing reference tags is a logical way of handling RSS variations. However, using reference tags is an expensive method with poor scalability. Maintenance of the reference tags are also hard to overcome. Since, batteries of the reference tags may have been over at any time which directly affect the result of the positioning algorithm of the system.
Dead reckoning is an auxiliary method to help estimating the location that estimates the posi-tion given that initial posiposi-tion, direcposi-tion, speed and time passed. This method is not directly applicable for position estimation. But it is used as an assistant tool for estimating location if any other better positioning method is not available for a short time since dead reckoning results have cumulative errors. Mobile device navigation applications uses dead reckoning if GPS is not available. Pedestrian Dead Reckoning is the specific usage of dead reckoning which takes the human steps into account. Human steps can be counted by an inertial sensors like accelerometer, gyroscope etc. which is already available in smart phones. The basics of the
pedestrian dead reckoning is introduced in (Beauregard and Haas 2006). (Jimenez et al. 2009) compares and contrasts the Pedestrian Dead Reckoning algorithms in literature.
Fingerprinting is a method of location determination that uses a fingerprint database of signal or any data related to the position previously collected and compiled. RSS-based positioning systems are suitable for fingerprinting by using the RSSI values. After fingerprint has been established, several algorithm are used to estimate the location. kNN is the widely used deter-ministic approach used in researches. Many examples and improvements on kNN algorithm has been published (Xie et al. 2016), (Umair, Ramana, and Dongkai 2014).
Trilateration is another algorithm widely used in indoor positioning. (Fu and Retscher 2009), (Lee et al. 2014), and (Savochkin 2014) are typical examples of usage of trilateration technique.
Smart phones are commonly used worldwide. There are various type of smart sensors in smart phones for different purposes. This initiates a new approach to positioning, namely crowd sourcing, which uses many sensors in order to estimate the location. (Alt et al. 2010), (Rai et al. 2012), and (Zhou et al. 2017) are used crowd sourcing as indoor positioning algorithm.
4. PROPOSED SYSTEM, ALGORITHM AND ARCHITECTURE
This chapter provides an overview of the implemented algorithm for the proposed indoor active RFID fingerprint positioning system. A global overview of the proposed system architecture is shown in 4.1 and 4.2.
4.1 Proposed System Architecture
Two different test environment are created in Yıldız Technical University Technopolis. These two case environments are set up and signal map is obtained manually. The Server component of the system is written in Java Programming Language (Gosling and McGilton 1995) together with the PostgreSQL database (Momjian 2001). Server matches the target fingerprint values with database of fingerprints collected at offline phase. Java is an object oriented programming language with Graphical User Interface (GUI) support. Java makes it easy to integrate the results with GIS (Geographical Information System). RFID readers have RS485 interface. Since the RS485 provides a long range communication between readers, it is really suitable for this kind of architecture. Also, an Ethernet to RS485 interface converter is used to communicate with RFID readers as the data terminal. Although RFID products have commercial standards, product specifications may change a little bit according to the vendor.
System components are listed above:
RFID Reader: It operates at 2.4 GHz with RS485 communication interface. Vendor: Tzone (http://en.tzonedigital.cn) Brand: TZ-RD-05
Active RFID tag: It operates at 2.4 GHz and compatible with RFID reader. Vendor: Tzone (http://en.tzonedigital.cn)
RS485/Ethernet Converter: It converts RS485 signals to Ethernet-TCP/IP packets and vice versa. Vendor: USR-IOT Brand: USR-TCP232-304
Figure 4.1 Proposed System Architecture Test Environment #1
Figure 4.3 The Reader Used in Experiments
Server Software: Java Programming Language
Server Hardware: Intel Xeon W3520 @2.66 Ghz CPU and 4 GB RAM Server Database: PostgreSQL version 10
4.2 RFID Reader Communication Protocol
Since RFID readers have proprietary protocol. We have to implement the protocol on the server side. RFID readers have byte array based protocol sending and receiving data formats are as follows:
Sending data format:
0xAA + Reader ID (3 bytes) + 0x03 in hexadecimal format
Receiving data format:
0x40 + length (1byte) + TZ-RD05 ID (3 byte) + RSSI (1byte) + Tag state (1 byte) + Tag ID (4 bytes) + check code (1 byte) + 0x03 in hexadecimal format
When servers sends the request in proper format to the particular Reader, the reader sends a beacon to the surrounding area and waits for the tags in the coverage area to respond. When
Figure 4.4 The Tag Used in Experiments
Algorithm 1 Main Execution Algorithm of the System for Scanning the Readers
1: procedure SCANREADERS
2: while true do . run this method till the stop button pressed
3: for each tag Reader in ReaderList do
4: send scan signal to the Reader
5: wait for P seconds . P is the scan period defined in the system
6: end for
7: if stopButtonP ressed then
8: break
9: end if
10: end while
11: end procedure
Figure 4.6 Main Execution Algorithm of the System for Scanning the Readers
response is received from the tags, reader sends response to server in proper format. This mode of operation is called passive mode that server controls the operation and reader always expects the server to scan the tags. The readers should operate in passive mode in order to prevent the readers to scan at the same time which causes electromagnetic interference. The further details of the RFID protocol is describe in appendix.
4.3 Hybrid Algorithm
4.3.1 Offline Phase
Signal is collected in offline phase with two people. One person stands at the particular grid point with a RFID tag. The other person controls the server and starts the scan as his colleague is ready at the particular grid point with RFID tag. At every grid point all the readers are scanned during the scan time with a particular scan time and particular sample rate. All the fingerprint data is retrieved from the readers for the reference point. According to (Xue et al. 2017) a number (N) of selected maximum RSS observations should be taken into account while
Figure 4.7 Flow Chart of Offline Phase (Fingerprinting)
taking the average of RSS values taken from particular reader for particular tag at the reference point. So, the received RSS values sorted and top (N) values are used to take the average and the poor values are simply discarded from the fingerprint. If the amount of RSS values retrieved is less that N, all the RSS values are discarded for that reader and reference point. The resulting fingerprint database consist of average RSS value measured during offline phase, location of reference point and reader ID for each reference point and each reader. Obviously, if no signal is received from particular reader from the reference point or the amount of RSS values received are not more than or equal to N, resulting fingerprint database have no entity for that.
4.3.2 Online Phase
While fingerprint database is completed in offline phase, then the online phase is started. Esti-mating location is the main goal of the online phase. Online phase is started with the same scan
Figure 4.8 Main Flow Chart of the System in Online Phase
time and sample rate as the offline phase. The tag is located at a place in the coverage area and waited for the system to estimate the location. The fingerprint of the target tag is extracted with completely the same method used for reference points. Since reference and target fingerprint are available, proposed matching algorithm can be applied now. The proposed algorithm is implemented based on RSS distance (Ni et al. 2003), (Xie et al. 2016) and dropped signals in the fingerprint by using java programming language. Although, edges of the reader coverage area are not clear. Still, it is possible to divide the test area in terms of coverage criteria.
Starting Point Algorithm. The system has starting points. If a Pedestrian with a tag is de-tected in the system for the first time, the system tries to estimate the position of the pedestrian in one of the starting points with previously set default speed and inwards direction. Since walking speed does not change too much with respect to pedestrian, Initial speed of the pedes-trian is taken as 1.37 m/s. It is assumed that the pedespedes-trian is 19-39 years age male with normal speed (Himann et al. 1988). 4.11, 4.12, and 4.13 shows how initial parameters are set and initial positioning estimation has done. After initial estimation has done, the speed, direction and position of the tag are known. The next estimations are done according to the amount of readers that signal is received
Figure 4.10 Flow Chart of the Starting Point Algorithm
Algorithm 2 Decision Algorithm if a tag already has been positioned
1: procedure ISFIRSTPOSITIONING(tag)
2: for each tag positionedT ag in P ositionedT agsList do
3: if tag == positionedT ag then 4: return false
5: end if 6: end for
7: return true 8: end procedure
Algorithm 3 Algorithm to Set the Initial State Parameters
1: procedure STARTPOSITIONING(tag)
2: for each tag positionedT ag in P ositionedT agsList do 3: if IsF irstP ositioning(tag) then
4: position = getInitialP osition(tag) 5: direction = inwards 6: speed = 1.37 m/s 7: else 8: StartP ositioningAlgorithm(tag) 9: end if 10: end for 11: end procedure
Figure 4.12 Algorithm to Set the Initial State Parameters
One Reader Algorithm. 4.14 indicates the flow chart for one reader algorithm. The unique-ness of this one reader algorithm is that the current algorithms for indoor positioning is account-ing and usaccount-ing the RSS received by the reader, however, int this algorithm, the irrelevant point are discarded and used for position estimation. The system has only one RSSI value received from one reader or more RSSI values from the same reader. An RSSI value gives en estimated distance from the reader. In 3-D, the points with equal distance to a fixed point constitutes a sphere. In 2-D, points with equal distance to a fixed point constitutes a circle. Besides, cover-age area is a corridor that may be assumed as a line or curve. So, the intersection points of the circle and the line (or curve) passing through the center of the corridor (possibly two points) are the possible estimations. We have used RSS Distance to find the estimated point from RSSI. Since there is only one reader, he equation 2.2 is modified as:
R(i,t) = |RSSIi− RSSIt| (4.1)
where R(i,t) is the RSSI distance of ith reference point, RSSIidenotes the average RSSI value
of ith reference point from the particular reader, RSSIt is the average of the measured RSSI
Algorithm 4 Algorithm to Set the Initial Position
1: procedureGETINITIALPOSITION(tag)
2: distance = MAX; 3: Reader = null;
4: RSSIval = null;
5: for each RSSI RSSI in ReceivedRSSISignalList do
6: if distance is less than getDistanceF romRSSI(RSSI.Reader, RSSI) then 7: distance = RSSIDistance
8: Reader = RSSI.Reader 9: RSSIval = RSSI
10: end if 11: end for
12: if RSSIval is greater than LIM IT then
13: position = getClosestInitialP oint(Reader) . Closest initial point to the reader
14: return position 15: end if
16: end procedure
Algorithm 5 Positioning Algorithm by Using RSSI from One Reader
1: procedure RSSBASEDPOSITIONESTIMATION(RSSIm,Reader)
2: List = new empty list
3: intersectioncount = getIntersectionCount(RSSI,Reader)
4: for each RSSI RSSIi in F ingerP rint(Reader) do
5: distance = |RSSIi− RSSm|
6: add distance to List
7: end for
8: IntersectionP oints = points of top intersectioncount element of List sorted
ascend-ing
9: for each point in IntersectionP oints do
10: if point is in range of another reader then
11: remove point from IntersectionP oints
12: end if
13: end for
14: return top intersectioncount element of IntersectionP oints
15: end procedure
Figure 4.15 Positioning Algorithm by Using RSSI from One Reader
Distance is not calculated and this reference point simply out of consideration. The reference points which have the minimum RSS distance are possible estimated positions based on RSS information. Local minimum points of R(i,t) = |RSSIi−RSSIt| function are taken as possible
estimated positions. Local minimum point of discrete function is defined as the point which the function have lower values than the adjacent points. When environmental effects are ignored, minimum RSS distance points constitute a circle centered at the reader. So, local minimum points of the function are found at the intersection points of circle and the reference point list. As shown in Figures 4.17, 4.16 and 4.18 there may be one, two or three possible intersection points between reference point list and the circle. If one of the intersection points are in the range of another reader, then it is discarded from estimations list and remaining intersection point(s) is taken into account. The design of the system should be done properly such that
Figure 4.16 An Example Illustration of Reference Point List and Circle Intersection at One Point
Figure 4.17 An Example Illustration of Reference Point List and Circle Intersection at Two Points
Figure 4.18 An Example Illustration of Reference Point List and Circle Intersection at Three Points
Algorithm 6 Positioning Algorithm by Using Dead Reckoning
1: procedureGETPOSITIONBYDEADRECKONIG(initialposition,speed,direction,time) 2: distance = speed x time . estimated distance that target proceeded 3: position = getP ositionRef erenceList(initialposition,direction,distance)
4: return position
5: end procedure
Figure 4.19 Positioning Algorithm by Using Dead Reckoning
the count of remaining intersection points should be only 1. Moreover, the speed, direction and the position at t seconds before are known. The position is estimated with respect to dead reckoning by the following formula:
(x, y)dr = (x, y)prev+ speed × time (4.2)
where (x, y)prev denotes the last estimated position, speed denotes speed of the pedestrian
as calculated before and time denotes the time difference between the current estimation and previous estimation. This formula is not scalar since target is not moving linearly in proposed system architecture. The distance is applied according to the possible path of the target. The position is estimated by the following formula:
(x, y)est = Crssi× (x, y)rssi+ Cdr× (x, y)dr (4.3)
Crssi+ Cdr = 1 (4.4)
where (x, y)est denotes the estimated position,(x, y)rssi denotes the position extracted from
RSSI information according to the algorithm 4.15, (x, y)dr denotes the position calculated by
using dead reckoning. Crssi and Cdr are the weighting coefficients that are tuned by
experi-ments.
Two Readers Algorithm. The system has RSSI values received from two readers. As de-scribed above, an RSSI value gives en estimated distance from the reader. In 2-D points with equal distance to a fixed point constitutes a circle. Since we have two readers, two circles are
Figure 4.20 Flow Chart of Two Readers Algorithm
needed to consider. A similar algorithm for one reader can be applied for two reader cases. First, the two RSSI values are compared. The reader with highest value RSSI has chosen as M aster reader. The remaining reader is called Auxiliary. Since it is assumed to be the closest one. Thus, RSSI values from closest reader are more reliable. One reader algorithm is ap-plied to M aster reader with a change in choosing intersection point. The intersection points which are out of the range of the Auxiliary reader are discarded. As described in one reader algorithm, the design of the system should be done properly such that the count of remain-ing intersection points should be only 1. Next, One reader algorithm is applied to Auxiliary reader with a change in choosing intersection point. The intersection point which is close to the selected intersection point of M aster reader is the selected intersection point of Auxiliary reader.
(x, y)est = Cmaster× (x, y)master + Caux× (x, y)aux (4.5)
where (x, y)est denotes the estimated position, (x, y)master denotes the position extracted from
RSSI information of M aster reader, (x, y)aux denotes the position extracted from RSSI
infor-mation of Auxiliary reader. Cmaster and Cauxare the weighting coefficients that are tuned by
experiments.
Three or More Readers Algorithm. When the system has RSSI values received from three or more readers, an enhanced weighted k-nearest neighbour algorithm is applied. The flow chart of the algorithm is shown in 4.21.
An RSS fingerprint of a point (target or reference) consists of entries with reader ID and the average of (N) number of selected maximum RSS observations. While matching two finger-prints, RSS values related with the same reader IDs should be matched. However, a particular RSS value in a fingerprint may not match with the comparing fingerprint since it does not have an RSS value with the same reader ID. In such cases, simply drop the RSS values from match-ing fmatch-ingerprint. The amount of dropped signals from target fmatch-ingerprint is denoted as T(i, t)
while matching ith reference point and target t. Similarly, the amount of dropped signals from reference fingerprint is denoted as F(i, t) while matching ith reference point and target t. These
values are taken into account while estimation the location.
Using Spearman distance in fingerprint based localization algorithms is offered at (Xie et al. 2016) and explained in detail. It evaluates the similarity of two point based on rankings of RSS values received from different readers assuming that RSS values decreases monotonically as the distance between reader and tag increases. The Spearman distance is defined by the following formulas: S(i,t) = 1 − 6×(PN i=1d2i+c) n×(n2−1) (4.7) di = orderti− orderri (4.8) c = P#of ties m(m2−1) 12 (4.9)
where S(i,t)is the Spearman distance, ordertiis the order of the RSSI value of the ith reader
fingerprint of the reference. When two or more RSSI values are the same in a finger print, the order of the tied entries are the average of the orders. So, a correction factor c should be added to equation.
The RSSI distance between target fingerprint and reference fingerprint is defines as follows:
R(i,t) =
q PN
n=1(RSSIin− RSSItn)2 (4.10)
where R(i,t)represents the RSSI distance, RSSIindenotes the RSSI value of ith reference point
from the nth reader, RSSItn denotes the RSS value of target point from the nth reader, and N
represents number of entries in the matching fingerprint.
The resulting rank of the ith reference point with respect to the target is calculated as:
M(i,t) = ws× S(i,t)+ wf × F(i,t) + wt× T(i,t)+ wr× R(i,t) (4.11)
where M(i,t) is the resulting ranking value of the ith reference point with respect to target t,
S(i,t) is the spearman rank of the ith reference point with respect to target t, Fi,t is the amount
of dropped signals from ith reference fingerprint with respect to target t, T(i,t) is the amount
of dropped signals from ith target fingerprint with respect to ith reference fingerprint, R(i,t) is
the RSSI distance of the ith reference point from target t. ws, wf, wt, wr are the weighing
parameter experimentally tuned according to improvements of the results.
M(i,t)is calculated for all reference points for a target fingerprint t. Reference points are sorted
according to M(i,t). Reference points with Smallest M(i,t)values are assumned to be the nearest
neighbours of target t. K nearest neighbours are selected to calculate the location. Choosing K is done as shown below as described in (Thirumuruganathan 2010).
K =√n (4.12)
we have chosen k nearest neighbours. Since k nearest neighbours are selected, WkNN method is used to determine the location of the target.
(x, y)t = 1 Pk i=1 1 R2 (i,t) × k X i=1 1 R2 (i,t) (xi, yi) (4.13)
where (x, y)tdenotes the estimated position of target, xi, yi denotes the actual position of the
Algorithm 7 Algorithm for Updating State Parameters
1: procedure UPDATESTATEPARAMETERS
2: distance = getDistance(Pn,Pn−1) . distance is not the closest distance, distance is
the distance through reference points.
3: direction = sign(getDistance(Pn,Pn−1))
4: end procedure
Figure 4.22 Algorithm for Updating State Parameters
neighbours will be taken into account and is set before algorithm works, R(i,t) denotes the
RSSI distance as defined above.
This algorithm is is an improved version of WkNN algorithm. Choosing nearest neighbours are done not only RSSI distance but also Spearman distance, the amount of dropped signals from target fingerprint and The amount of dropped signals from reference fingerprint. Besides, weighting nearest neighbours method is the same with WkNN method.
Updating State Parameters. Dead reckoning is a part of the proposed solution. So, speed, direction and position of the tag are the state parameters. Each parameter is updated after estimating the position. Position is updated as stated above. Speed is updated by calculating the distance of the current position and previous position divided by the time elapsed. Direction is updated according to the sign of the result.
5. EXPERIMENTAL RESULTS
The proposed system with the hybrid algorithm is tested, developed and updated in a real envi-ronment. The results, accuracy and the performance of the system is discussed in this chapter. Positioning accuracy of the proposed system is evaluated based on the experimental results. The test environment has been prepared on on the basement floor of the Yıldız Technical Uni-versity Technopolis building. Also, another test environment has been prepared on the closed parking area to test the 4 or more reader. Figure 4.1 shows the floor plan of experimental site. The system parameter X = 2, T = 12s and P = 400ms are set during the experiments. 8 test point has been used for testing the accuracy of the system hoping that each two points will have processed in different positioning algorithm. Points are shown in Figure 5.1. The system has a stateful process. Thus, at every experiment it is waited the system to be in steady state that makes up to 5 positioning estimation cycle, especially for the test points around the center reference points. On the other hand, at starting points there is no need to wait a long time. At each test point, the position of free tag is calculated three times at least. The Error distance be-tween the estimated position and the actual test point is determined by using classical Euclidean distance:
Error = p(xt− xe)2+ (yt− ye)2 (5.1)
where (xt, yt) is the test point coordinates and (xe, ye) is the estimated point coordinates of the
proposed system. During the experiments coefficients are fine tuned and best results are gained with Crssi = 0, 8 and Cdr = 0, 2 in one reader algorithm, Cmaster = 0, 7 and Caux = 0, 3 in
two readers algorithm and ws = 0, 25, wf = 0, 15, wt = 0, 10 and wr = 0, 50 in three or
more readers algorithm. The system is tested three times for each of the test point. Table 5.1 shows the results of the experiment with errors in meters for the proposed hybrid algorithm. By using the same test points and the same measurement result, also WkNN method has been
Figure 5.1 8 Test Point Used in Experiments at Proposed System Architecture #1
Test Point Test 1 Error Test 2 Error Test 3 Error Average Error
Test Point 1 0.45 0.45 0.45 0.45 Test Point 2 2.21 2.87 3.43 2,83 Test Point 3 2.51 3.08 2.05 2,54 Test Point 4 4.49 2.20 2.71 3,13 Test Point 5 0.75 0.75 0.75 0,75 Test Point 6 3.37 3.05 3.76 3,39 Test Point 7 2.82 2.97 2.16 2,31 Test Point 8 3.57 4.85 5.90 4,77
Test Point Test 1 Error Test 2 Error Test 3 Error Average Error Test Point 1 1.29 1.13 1.62 1.34 Test Point 2 7.87 9.41 8.25 8,51 Test Point 3 3.83 1.72 2.20 2,58 Test Point 4 4.49 3.47 3.14 3,73 Test Point 5 1.42 1.27 1.55 1,41 Test Point 6 8.41 7.19 7.01 7,53 Test Point 7 3.29 2.97 2.16 2,80 Test Point 8 3.57 4.21 4.84 4,20
Table 5.2 Table of Error Distances in Meters of Experiment of Weighted kNN Algorithm
used to calculate the position. The Table 5.2 shows the results of the experiment with errors in meters for the WkNN algorithm. The proposed system results in comparable accuracy with approximately 2,5 m average positioning error. In order to show the accuracy of the proposed system, the cumulative distribution function (CDF) of the positioning errors calculated for the 24 measurements of the experiment is used. Figure 5.2 shows the CDF. Y axis of the CDF is the percent of results taken from 24 measurements which is less than or equal to X axis. As seen from the CDF %50 of the results are less than 2.5 m that means average accuracy of the system is 2.5m. However average accuracy of the WkNN algorithm is 3.3 m.
As it can be seen from the results above, proposed hybrid algorithm is compared with WkNN algorithm. Since proposed system has stateful algorithm and proposed architecture has less readers as compared to other system, state information is used to decrease the error and pro-posed algorithm gives more accurate results than the widely used fingerprinting algorithm, WkNN. At Starting point algorithm, since pedestrian is assumed to be in front of the starting point, proposed algorithm is specialized based on the assumption so that it gives more accurate results than the WkNN algorithm. At one reader algorithm and two readers algorithm, number of readers are not enough to acquire accurate results from the WkNN algorithm. However, pro-posed algorithm uses state information to get more accurate results. At three or more readers
Figure 5.2 Cumulative Distribution Function of Error Measured in Experiments
algorithm, proposed system takes Spearman distance, RSSI distance and the dropped signals are into account. On the other hand, WkNN algorithm uses only RSSI distance into account. That’s why, proposed system gives slightly more accurate results.
Proposed system architecture can be defined as one dimensional field since pedestrian is walk-ing on a line (or curve). This brwalk-ings additional assumptions on the two or three dimensional positioning algorithms. By using additional assumptions and some improvement on WkNN al-gorithm, designing more accurate positioning systems can be possible. In this proposed system architecture, the assumptions had been implemented successfully. This work shows by using additional assumptions it is possible to get more accurate positioning results with using less readers.