KADIR HAS UNIVERSITY
GRADUATE SCHOOL OF SOCIAL SCIENCES
INTERNAL CUSTOMER SATISFACTION IMPROVEMENT USING QFD TECHNIQUE
GRADUATE THESIS
KEBİRE NAZLI ERGİN
INTERNAL CUSTOMER SATISFACTION IMPROVEMENT USING
QFD TECHNIQUE
KEBİRE NAZLI ERGİN
Submitted to the Graduate School of Social Sciences in partial fulfillment of the requirements for the degree of
Master of Business Administration
KADIR HAS UNIVERSITY May, 2013
KADIR HAS UNIVERSITY
GRADUATE SCHOOL OF SOCIAL SCIENCES
INTERNAL CUSTOMER SATISFACTION IMPROVEMENT USING QFD TECHNIQUE
KEBİRE NAZLI ERGİN
APPROVED BY:
Dr. Pınar İmer (Advisor)
Kadir Has Üniversitesi _____________________
Yard. Doç. Dr. Hatice Akdağ (Co-advisor)
İstanbul Teknik Üniversitesi _____________________
Doç. Dr. Hür Bersam Bolat
İstanbul Teknik Üniversitesi _____________________
Dr. Elif Akben Selçuk
Kadir Has Üniversitesi _____________________
APPROVAL DATE: 13/May/2013 APP
END APPENDIX B
“I, Kebire Nazlı Ergin, confirm that the work presented in this thesis is my own. Where information has been derived from other sources, I confirm that this has been indicated in the thesis.”
_______________________ KEBİRE NAZLI ERGİN
ABSTRACT
INTERNAL CUSTOMER SATISFACTION IMPROVEMENT USING QFD TECHNIQUE
KEBİRE NAZLI ERGİN
Master of Business Administration in Graduate School of Social Sciences Advisors:
Yrd. Doç. Dr. Hatice CAMGÖZ-AKDAĞ Öğr. Gör. Dr. Pınar İMER
April, 2013
In this thesis, Quality Function Deployment was assigned as a methodology for converting customer requirements and expectations into quality standarts. The paper suggests an approach which is integrating SERVQUAL into QFD to set the success factors to improve quality in the textile industry. A textile company, within the city of Istanbul in Turkey was selected as the sampling frame. A SERVQUAL-type of questionnaire was used and 32938 questionnaires were distributed both manually and online and 24551 of them were received. Usable responses were 24551, comprising a response rate of 77,31% percent at the company level. From the results of the QFD application it is seen that internal customer focus has the highest weight score meaning that when internal customer focus is improved, there will be almost 12% of improvement in the internal customer satisfaction. Secondly, improvements in technical requirements of politeness and process communication will have a 9% impact on internal customer satisfaction. This thesis as a first attempt to applying this integrative approach to a different sector and thus offering practical and applied information, it will be useful for both academicians and professionals in the textile business.
Keywords: Quality, Ouality Function Deployment, internal customer satisfaction APPENDIX B
ÖZET
KFY KULLANARAK İÇ MÜŞTERİ MEMNUNİYETİNDE İYİLEŞTİRME YAPMAK
KEBİRE NAZLI ERGİN İşletme MBA, Yüksek Lisans
Danışmanlar:
Yrd. Doç. Dr. Hatice CAMGÖZ-AKDAĞ Öğr. Gör. Dr. Pınar İMER
Nisan, 2013
Bu tezde iç müşteri gereksinimleri ve beklentilerini kalite niteliklerine dönüştürmek amacıyla Kalite Fonksiyon Yayılımı (KFY) metodu kullanılmıştır. Tekstil
sektöründe kaliteyi arttırmak için başarı faktörleri belirlemek amacıyla SERVQUAL’i KFY içine entegre eden bir yaklaşım sunulmaktadır. Türkiye, İstanbul ilinde bulunan tekstil firması örnekleme çerçevesi olarak belirlenmiştir. SERVQUAL tipinde bir anket kullanılmış; bu anket 32938 kişiye dağıtılmış ve kullanılabilir 24551 adet anket toplanmıştır. Bu da firma seviyesinde cevaplanan anketlerin %77,31’lik kısmını oluşturmaktadır. KFY uygulamasının sonuçlarına göre, iç müşteri odaklılık en yüksek ağırlık skoruna sahip teknik gereklilik olup, bu alandaki iyileştirme iç müşteri memnuniyetinde %12’lik bir etkiye sahip olacaktır. İkinci olarak, nezaket ve süreç iletişimindeki iyileştirmeler, iç müşteri
memnuniyetinde %9’luk bir etkiye sahip olacaktır. Bu bütünleyici yaklaşımı farklı bir sektöre uyarlayan ve böylece pratik ve uygulamalı bir bilgi sağlayan bu tez, hem akademisyenler hem de tekstil dünyasındaki profesyoneller için faydalı olacaktır.
Anahtar Kelimeler: Kalite, Kalite Fonksiyon Yayılımı, İç Müşteri Memnuniyeti. APPENDIX B
Acknowledgements
The author takes pleasure in expressing her gratitude to Assist. Prof. Dr. Hatice Camgöz-Akdağ and Dr. Pınar İmer, the supervisors of this research. Whose guidance and advise were invaluable in carrying out this work. Special thanks and appreciation are extended to Mr. Murat Aksu, Organization and Performance Manager at LC Waikiki for his sincere interest who never hesitated to help.
Appreciation and thanks are extended to Dilek Kocabaş, Assistant Specialist in the Department of Organization and Performance, who helped the author in learning and gaining an information for this research.
Table of Contents
Abstract Özet Acknowledgements List of Tables i List of Figures iiList of Abbreviations iii
1 Introduction 1
2 Literature Review 2
2.1 Definition of Customer……….. 2
2.2 Internal Customer Satisfaction, Quality, Organizational Change and Internal Customer Motivation ……….……… 4
3 Quality Function Deployment 11
4 Textile In Turkey 14
5 Methodology 17
5.1 The case study……… 17
5.2 Survey Instrument……….. 17
6 Analysis & Results 19
6.1 Quantitative data analysis………... 19
6.2 Application of quality function deployment……….. 22
7 Conclusions 31
i List of Tables
Table 1. QFD applications and contributions ... 8
Table 2 Questions, quality dimensions and the average of the results ... 20
ii
List of Figures
Figure 1. Internal and external customers ... 4
Figure 2. Customer requirements acquired through the survey ... 22
Figure 3. Correlation among technical requirements ... 24
iii
List of Abbreviations
TQM – Total Quality Management
HOQ – House of Quality
1
1. INTRODUCTION
With the globalization in Turkey, the importance of quality increases day by day. As the Turkish textile industry started to take its place in the world’s top ten exporters, the importance of quality also shows itself in this growing sector. Quality mainly focuses on the customer satisfaction and it defines two types of customers. Tennant (2001) and Kendall (2007) describes two types of customer. One is the external customer which is the people that are not directly connected to the
organization. The other is the internal customer, which is the people that are directly connected to the organization, in other words, the employee. Quality function deployment (QFD) technique is able to provide companies with a better understanding of customers` expectations (in this thesis “internal customers’” translate these expectations into appropriate service specifications and perform existing process assessment.
In this thesis, Quality Function Deployment was assigned as a methodology for converting customer requirements and expectations into quality standarts.
In this thesis, the focus will be on the internal customer. The factors effecting the motivation of the internal customer due to firm growth will be figured out.
2
2. LITERATURE REVIEW
2.1 Definition of Customer
Berk & Berk (2000) mention Webster’s definition of a customer which is one that purchases a commodity or service. This is a starting point for a definition of customer but it should be improved from a quality management viewpoint. An interrelation is implied in Webster's definition which is one sells to the other. Wood (1997) also describes the customer and puts forwards it as it is in a typical retail process which is like the customer comes, pays the money and buy the goods. In addition to those, according to Abanoz, a customer can be defined as a person who purchases or uses the commodity (Abanoz, 2008).
As Berk, Wood and Abanoz also defines, the word customer usually brings the idea of end users of a commodity or a service to one's mind. These are all correct for the definition of a customer but may be missing an information. Yet,
commodities with a physical size being in the first place, each step in the process of marketing all commodities including services are composed of a long activity chain covering processes like production of those commodities, measurement of their qualities, their pricing and distribution. Each of the mentioned activities are executed by one or more people and output of each activity is used by another person in the chain. That is why, anybody who is purchasing those outputs should be thought as a customer or an end user. In other words, anybody using the output of the enterprise, though it is not an ultimate output, should be recognized as customers whether they are inside or outside the enterprise. As a matter of fact, according to the total quality management philosophy, anybody who is affected by the commodity should be recognized as a customer. Consequently, customer is explained as “the people both inside and outside the company who are purchasing the product of the process” and
3
based on the mentioned definition, customers are analyzed in two groups as customers inside and outside the company.
Tennant (2001) and Kendall (2007) classify the concept “customer” under two categories as the external customer and the internal customer. According to them, external customer of a firm is a person who is not directly related to that firm. On the other hand, internal customer is a person who is directly related to the firm and generally internal to the firm.
In this thesis, employee will be named as “internal customer”.
As previously mentioned, the concept of “internal customer” was brought out by the understanding of Total Quality Management.
Quality management writer Juran (1998), made a remark on the concept of an internal customer in the fourth edition of his Handbook. Thereafter, as Kelemen (2003), Stracke (2006), Reeves and Bednar (2005) put forward, the term received broad acceptance in the literature of total quality management.
Here the concept becomes a bit complicated. Webster’s common use of the customer’s definition can be slightly changed. The customer can be alternatively described as anyone or any firm who takes and uses what a person or a firm provides. Thus, the classical definition of customer which is a person who buys a good or service can be eliminated.
This definition has important implications. According to this, customers are not anymore outside the limits of a firm which is sellin either goods or service. Berk & Berk (2000) also mentions that they do not have to be outsiders, they can also be in the fim dealing with the supply of the goods and services.
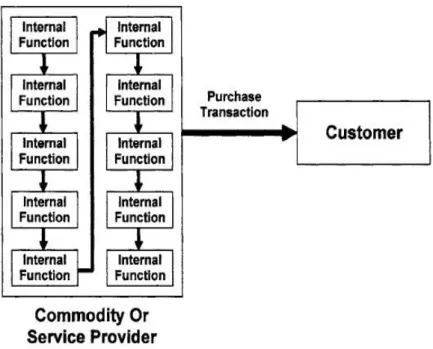
4
Figure 1. Internal and External Customers
Berk and Berk (2000) pay attention to the point that the commodity or service provider provides its product to the external customer, but there are several internal functions within the supplier. Each function is an internal customer of those
functions that precede it in the process of preparing the goods or services to be provided to the external customer.
The next step is to define how internal customer satisfaction can be provided by using Quality.
2.2 Internal Customer Satisfaction, Quality, Organizational Change and Internal Customer Motivation
Gremler, Bitner and Evans (1994) argue that an internal customer is a person in an organization being supplied with goods or services by the other people in the company. In other words, as Gremler et al. (1994) mentions that an internal customer can be realized as a customer who also look forwards to get his/her needs satisfied like external customers.
5
According to Total Quality Management, the main focus is on the internal and external customer. Satisfaction of the internal customers is important in terms of the motivation of the internal customer and the healthy execution of the process. TQM deals with the internal customer as an internal customer. The reason it approaches internal customer as an internal customer is that it is not possible for an organization to meet its customer demands without taking its internal customers’ expectations into account. In order to guarantee external customer satisfaction, the only possible way is to ensure the internal customer satisfaction.
In the last few years, internal customer satisfaction has gained huge recognition. Heskett et al. (1997) states that many companies invest respectable amounts of resources in programmes to monitor and increase internal customer satisfaction. In addition to this, Eskildsen and Dahlgaard (2000) assumes that internal customer satisfaction results in motivated and committed internal customers, in more effective and efficient work, and in turn to higher process and product quality.
Spector (1997) also describes internal customer satisfaction as the satisfaction of internal customers with their jobs or the degree to which internal customers like their jobs. Lofquist and Dawis (1969), Smith et al. (1969), Locke (1976) and Cranny et al. (1992) put forward that job satisfaction and factors of internal customer
satisfaction were emphasized as important elements of organizational management, behavior and development. There are different job satisfaction-oriented factors.
“On one hand, job satisfaction factors can be classified according to the well-known Herzberg’s (1964, 1966) two-factor theory into hygienes (supervision, working conditions, co-workers, pay, policies/procedures and job security), which lead to dissatisfaction, and motivators (achievement, recognition, the work itself, responsibility, advancement and growth), which lead to satisfaction” (Antoncic and Antoncic 2011:111).
6
“Internal customer satisfaction has become one of the important topics in total quality management. Total quality management is a popular "quality management" concept and it is about much more than only guaranteeing product or service quality. TQM is a business philosophy - a way of doing business. In order to lead people and business processes to guarantee customer, both internal and external, satisfaction at every level, it defines ways. TQM is often associated with the phrase – ‘doing the right things right, first time’. This note summarises the main features of TQM” (Studymode.com 2008:13)
According to Marshall et al. (1998), internal customer service is a two sided exchange process among people in various departments of a company in which the supplier has to respond to the requirements of his/her internal customers which is inherently in line with TQM philosophy.
Internal customer satisfaction has gained scholarly attention for decades. Kirkman and Shapiro (2001) and Ellickson (2002) argue that the concept has always been studied as an outcome variable. Scholars as Farrell and Stamm (1988), Tett and Meyer (1993) and Griffeth et al. (2000), on the other hand, discuss that it is a
precessor of internal customer intention and absenteeism.
As Kirkman et al. puts forward, internal customer satisfaction can also be a preceding reason for internal customer absenteeism and internal customer turnover intention.
It is obvious from the above explanations of internal customer satisfaction that it has become the focal point of the total quality. There are lots of impacts for the internal customer satisfaction. However, in this thesis, we will be focusing on the impact related with the organizational structure.
It also shows itself in the literature that internal customers are effected by the organizational change in different ways. Miller (2002) mentions that big changes in plans require changes in the way people work or behave in a company. In addition to that, Carnall (1991), Innstrand, Espnes and Mykletun (2004) states that the new
7
conditions can lead to anxiety, uncertainty, and stress, even for those managing the changes. Parry-Jones et al. (2000) argues that heavy workloads, difficult work relationships, lack of resources, lack of time, staff shortage, and huge administrative duties cause stress. Hui and Lee (2000) summarizes that the increase of uncertainty surrounding the changes was generally related with an increase in stress levels and a decrease in satisfaction and commitment.
“People do not resist change itself, but rather the anticipated consequences or expected effects that may be associated with change, such as loss of status, loss of pay, or loss of comfort” (Dent and Goldberg 1999:35).
“People may resist significant threats to their self-interest or have fear of poor outcomes, such as being required to perform more work or earn less money, or having their job status or security threatened” (Kotter and Schlesinger 1979:57; Trader-Leigh 2002:15).
As it is understood from the above explanation and as most of us already know that people resist change. It might be a positive or negative resisting but in the business life most of the time it appears to be a negative concept which most of the time results in internal customer dissatisfaction. Mack, Nelson, and Quick (1998) concluded that, in general, organizational changes lead to increasing levels of job dissatisfaction, mainly as a result of increased skepticism during the process of change. Glasby and Lester (2004) clarify that due to confusion over the goals of the changes, the roles of the professionals, and lack of management clarity, decrease in job satisfaction and motivation have been observed.
Miller and Chen (1994) as cited in Macr`I, Tagliaventi and Bertolotti (2002) put forward that as a result of these conditions, the work performance of the internal customer might decrease.
In order to figure out the factors effecting the motivation of internal customer due to firm growth, Quality Function Deployment (QFD) was decided to be used as a
8
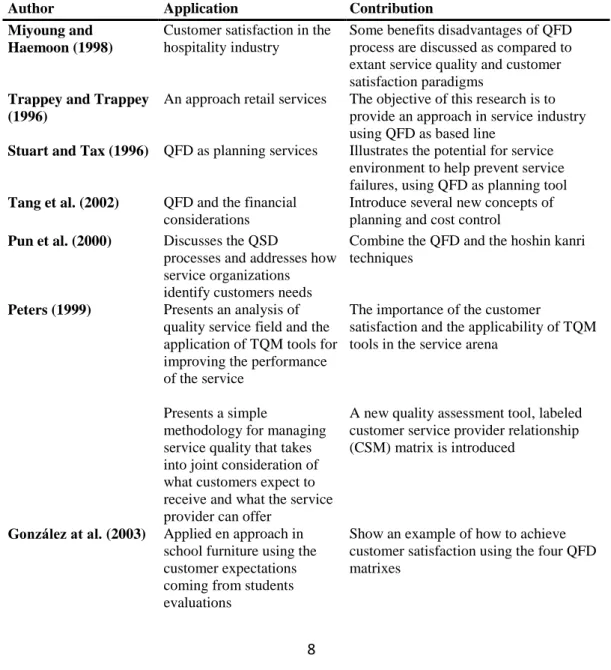
technique. QFD is a widely used technique for the voice of customer. It will help the firm to point out the most important factors to be improved first. QFD was used by several publications which shows different service area applications of QFD (Table I).
“Fewer design and service costs, fewer and earlier design changes, reduced product development time, fewer start-up problems, better company performance, improved service quality, and, above all, increased customer satisfaction are among the benefits resulting from these and other reported QFD applications” (Franceschini and Rosetto 1995:7; Kim et al. 1998:35).
Table 1. QFD applications and contributions
Author Application Contribution
Miyoung and Haemoon (1998)
Customer satisfaction in the hospitality industry
Some benefits disadvantages of QFD process are discussed as compared to extant service quality and customer satisfaction paradigms
Trappey and Trappey (1996)
An approach retail services The objective of this research is to provide an approach in service industry using QFD as based line
Stuart and Tax (1996) QFD as planning services Illustrates the potential for service
environment to help prevent service failures, using QFD as planning tool
Tang et al. (2002) QFD and the financial
considerations
Introduce several new concepts of planning and cost control
Pun et al. (2000) Discusses the QSD
processes and addresses how service organizations identify customers needs
Combine the QFD and the hoshin kanri techniques
Peters (1999) Presents an analysis of
quality service field and the application of TQM tools for improving the performance of the service
The importance of the customer
satisfaction and the applicability of TQM tools in the service arena
Presents a simple
methodology for managing service quality that takes into joint consideration of what customers expect to receive and what the service provider can offer
A new quality assessment tool, labeled customer service provider relationship (CSM) matrix is introduced
González at al. (2003) Applied en approach in
school furniture using the customer expectations coming from students evaluations
Show an example of how to achieve customer satisfaction using the four QFD matrixes
9
Camgöz-Akdağ, H. (2012)
Presents QFD technique for improving a new product fort he natural gas sector.
A case study showing an example of how to achieve customer satisfaction using the four QFD matrixes
Babakus and Mangold (1992) and Parasuraman et al. (1991a) mention that the SERVQUAL approach is recognized a significant departure from the traditional way of using perception-based measure as a customer satisfaction predictor. They also add that SERVQUAL suggest using expectation/perception – the service quality gap – as an abiding perception that predicts customer satisfaction with a service provider. The relationship between service quality and customer satisfaction is somewhat complementary. Previous research on the relationship can be divided into two schools: Bolton and Drew (1991) argue that a satisfied customer with good
perceptions about service quality, thus realizing customer satisfaction as an service quality antecedent. On the other hand, Antreas and Opoulos (2003), Cronin and Taylor (1992), Spreng and MacKoy (1996) argue that service quality leads to customer satisfaction, considering service quality as a customer satisfaction antecedent. Nonetheless, both approaches agree that there is a strong correlation between customer satisfaction and service quality.
In the literature, there have been many examples of combining SERVQUAL and QFD in different ways and in different industries (Camgöz-Akdağ, 2012). Franceschini and Terzago (1998) determined the needs of all actors playing different roles in industrial training courses within the Kano model and converted these needs into design characteristics using QFD. Matzler and Hinterhuber (1998) followed a similar methodology for the ski industry. Tan and Pawitra (2001) propose and integrated approach involving SERVQUAL and quality function deployment for evaluating the image of Singapore from the Indonesian tourist’s perspective. The
10
goal of the approach is to help companies to assess customer satisfaction, to lead improvement efforts in strengthening their week points and through the recognition of attractive attributes embedding them into future services to accelerate the
development of innovative services.
Literature also includes many examples of integrating SERVQUAL and QFD in different ways. Lim et al (1999) adopted SERVQUAL and QFD performance measurement in Singapore and used the empirical findings as an input for QFD in the process of designing services based on customer expectations for hospitals. Sahney et al. (2004) employed SERVQUAL to establish the gap between customer
expectations and perceptions of the actual service received. In addition, Baki et al. (2009) used SERVQUAL to see how well the service quality attributers are able to satisfy customer requirements and findings were transferred to QFD.
11
3. QUALITY FUNCTION DEPLOYMENT (QFD)
Mehrjerdi (2010) states that in the 1970’s, started in Japan quality function deployment (QFD) and during 1980’s the western world acknowledged it as a technique and started using it as a tool in order to make decisions.
“Companies are successfully using QFD as a powerful tool that addresses strategic and operational decisions in businesses. QFD provides a means of converting customer requirements into appropriate technical requirements for each level of product development and production in other words marketing strategies, planning, product design and
engineering, prototype evaluation, production process development, production, sales” (Sullivan 1986).
Furthermore, Akao (1990) defines QFD as a method for describing design qualities that are in keeping with customer expectations and then translating the customer requirements into design targets and critical quality assurance points that can be used throughout the production/service development phase. Gonza´lez (2001) states that QFD has two basic purposes to improve
(1) the communication of customer requirements throughout the firm, and (2) the completeness of specifications and to make them accountable directly to customer requirements and needs.
In addition to the above mentioned improvement areas, QFD has some benefits.
“The benefits of QFD as pointed out by researchers in the literature, can be summarized as follows. QFD can:
help in making trade-offs between what the customer requirements and what the company can afford to produce;
12
increase internal customer satisfaction (this is done by taking customers’ requirements into consideration and bringing them into the product development process);
shorten the time to market;
cause internal customers to provide sufficient documentation because they see the importance of information; and
improve effective communication between company departments” (Sullivan 1986:19; Hauser and Clausing 1988; Zairi and Youssef 1995:12; Chan and Wu 2002:143; Terninko 1995).
“In an attempt to respond to the needs of customers and stay at the edge of competitive advantage a decision-making tool was developed that can combine technology, firm policies and customers requirements all into a product which is convenient, enchanting, accessible, and commercial. This decision-making technology is quality function
deployment. As a matter of fact, it can be interpreted as QFD is all of the following mentioned topics
understanding customer requirements; systematic thinking about quality;
adding value through quality maximization and customer satisfaction; designing a comprehensive quality system for customer satisfaction; and developing strategies that can put a company ahead of its competition” (Mehrjerdi 2010:27).
Bossert (1991) argues that the information related with the internal customer can be gathered by questionnaires, focus groups, interviews, listening to salespeople, trade shows and publications, and customer complaints. Mehrjerdi (2010) adds that to acquire the perspective of the customer in the language of business is highly regarded and necessary for the routine business. QFD is a notably efficient tool for this task as being an analytical approach enabling users to include customers’ voices into the product planning and designing levels.
13
As we are applying this technique to a textile company, it would be a logical attempt to mention about textile sector in Turkey and the company’s place in the market.
14
4. TEXTILE IN TURKEY
“Textile production in Turkey started from the Ottoman period. In the 16th and 17th centuries, textile production was prevalent and at a progressive level. As a matter of fact, the Ottoman Empire profoundly depend on textile industry and this was a pleasant sign of the significance of the textile sector. Between the years 1923 and 1962, a huge production capacity was created in Turkey after a rapid development in the 20th century. There was a considerable growth of the cotton in Turkey, which is the most significant raw material of the textile industry. Afterwards, it contributed to the development of the textile sector. Since the first planned development period had ended, the sector gained more strength until 1972. Openning to the foreign markets started between the years 1980 and 1989” (Tcp.gov.tr 2013)
The textile sector made respectable contribution to the improvement of the clothing industry as well. During 1990’s, with a 9,3% export rate, the textile sector gained an important place in the total Turkish exports.
The sector, today, has become one of the most important components of the Turkish economy with its export value of 5,4 billion dollars. While the export value of the textile sector was 1,1 million dollar in 1990, it has reached to 5,4 billion dollars by the end of 2009. In other words, total textile exports of Turkey folded five times within the last 20 years. (ITKIB)
Textiles and clothing are among the most significant sectors of the Turkish economy and foreign trade. These two sectors constitute about 6-7% of the GDP together and they are the heart of Turkish economy in terms of GDP contribution, share in manufacturing, employment, investments and macroeconomic indicators. These sectors had a 18,5% share in total export volume in 2011. There are more than 40,000 textile and clothing companies in Turkey with an estimated workforce of 750,000 internal customers.
Turkey is one of the main actors in the world clothing industry. Turkey ranks 8th in world cotton production and 4th in world cotton consumption. After India and
15
Syria, Turkey also ranks 3rd in organic cotton production. The Turkish clothing industry is the 6th largest supplier in the world, and the 2nd largest supplier to the EU. It has a share of 4% in knitted clothing exports and it ranks 5th among the exporting countries. With a share of 2,6%, Turkey ranks 10th among the woven clothing exporters in the world. (Tcp.gov.tr 2013)
The Turkish textile industry, which is listed in the world’s top ten exporters, is also the second largest supplier to the EU. The Turkish textile and clothing industry has a significant role in world trade with the capability to meet high standards, and can compete in international markets in terms of high quality and a wide range of products. (Tcp.gov.tr 2013)
The selected company sources the products that are offered for sales in its stores through a global supply chain. The selected company is one of the leading companies of the Turkish ready-to-wear industry with its production history starting from its sister company and with its achievements as the company in the ready-to-wear retail industry.
“The company attained the following turnover figures through its stores,
respectively. By the end of 2004-255 million TL, by the end of 2005-346 million TL which reflects an increase of 35 %, by the end of 2006-495 million TL which reflects an increase of 43%, by the end of 2007-719 million TL which reflects an increase of 45 %, by the end of 2008-1 billion and 49 million TL which reflects an increase of 46%, by the end of 2009-1 billion and 428-million TL which reflects an increase of 36 %, by the end of 2010-2 billion and 107 million TL which reflects an increase of 48%, by the end of 2011-2 billion and 900 million TL which reflects an increase of 35%” (Corporate.lcwaikiki.com 2012).
“The company has been managing a chain stores rendering service to millions of people from all walks of life through over 370 stores at 450.000 m2 closed area at 71 provinces in Turkey.
16
The company has been keeping the leading position in the sector since the summer term of 2004 according to the Reports Indicating the Consumption Index of Ready-Made Clothing prepared and published at every six months by KMG” (Corporate.lcwaikiki.com 2012).
17
5. METHODOLOGY
A literature review has been carried out in order to acquire a proper understanding of the concept and a detailed assessment of the above mentioned targets. Consequently, a questionnaire was prepared and used in this study. 5.1 The case study
A retail company with a big market share within the city of Istanbul in Turkey was selected as the sampling frame of this survey to translate the customer expectation and needs to quality management characteristics. The respondents were the internal customers of the company. Total of 32938 questionnaires were distributed both manually and online and 24551 of them were received. Usable responses were 24551, comprising a response rate of 77,31% percent at the company level. The majority of the respondents completing the questionnaire were internal customers of the selected company.
5.2 Survey instrument
A survey was conveyed to measure the factors effecting the motivation of internal customers in a retail company in Istanbul Turkey. To enable this study to be surveyed, the survey instrument used is the SERVQUAL 5 dimensions model, adapted as recommended by Parasuraman et al. (1985). The SERVQUAL-type of questionnaire to be used in the selected company is constructed by retaining some items from the updated SERVQUAL dimensions. Selected items are refined and paraphrased in both wording and contextual applications as appropriate for this research (Suki et al., 2009)
The questionnaire is designed in a Likert scale five-point format ranging from “never” (1) to “always” (5). This instrument includes 25 items for the expectations scale and the same 25 items for the perceptions scale (Suki et al. 2009)
18
The results of the questionnaire were then used to integrate the findings from the SERVQUAL instrument into QFD to figure out the factors effecting the internal customer motivation.
19
6. ANALYSIS & RESULTS
6.1 Quantitative Data Analysis
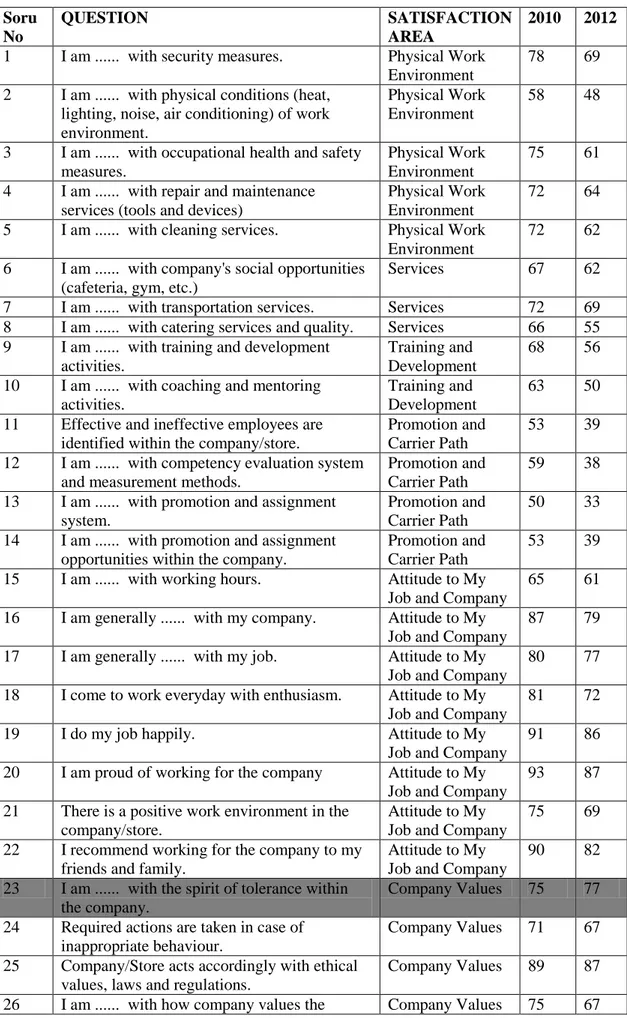
To offer a tool for measuring service quality, the SERVQUAL scale was developed. It mostly involves measuring the functional dimensions of service quality. Although it is generic scale, it needs being changed in order to address a specific sector’s requirements. In conclusion, in harmony with past research recommendations, a questionnaire was prepared. By consulting experts on organizational performance professionals and academics, it has been improved. The altered questionnaire measured respondents’ agreement on five-service quality dimensions: reliability, responsiveness; assurance empathy; and tangibles from a customer expectation and perception perspective which was taken as a basis and was expanded to 9 major classificastions. These were Physical Work Environment, Services, Training and Development, Promotion and Carrier Path, Attitude to My Job and Company, The Company Values, Policies and Strategies, Recognition Reward, Remuneration, Management Style and Effectiveness. In total, 45 items were selected to capture these five service quality dimensions. The average was taken for each response for each 45 items. This research is done every two years to compare whether if the gap between internal customer satisfaction and company requirements has increased or decreased. In this research, the last 2 survey analysis was taken into consideration. Table 2 shows the 45 items, 9 quality dimensions and the average results of respondents for the years 2010 and 2012. The items having an increase in closing the gap is shown with grey colour. The only incremental increase was seen in the specific items as the spirit of tolerance within the company, company's social responsibility activities, and eployee salary. There was no change with the items the company's rules and the wage compared to equivalent positions within the company.
20
Table 2. Questions, Quality Dimensions and the Average of the Results Soru
No
QUESTION SATISFACTION
AREA
2010 2012 1 I am ... with security measures. Physical Work
Environment
78 69
2 I am ... with physical conditions (heat, lighting, noise, air conditioning) of work environment.
Physical Work Environment
58 48
3 I am ... with occupational health and safety measures.
Physical Work Environment
75 61
4 I am ... with repair and maintenance services (tools and devices)
Physical Work Environment
72 64
5 I am ... with cleaning services. Physical Work Environment
72 62
6 I am ... with company's social opportunities (cafeteria, gym, etc.)
Services 67 62
7 I am ... with transportation services. Services 72 69 8 I am ... with catering services and quality. Services 66 55 9 I am ... with training and development
activities.
Training and Development
68 56
10 I am ... with coaching and mentoring activities.
Training and Development
63 50
11 Effective and ineffective employees are identified within the company/store.
Promotion and Carrier Path
53 39
12 I am ... with competency evaluation system and measurement methods.
Promotion and Carrier Path
59 38
13 I am ... with promotion and assignment system.
Promotion and Carrier Path
50 33
14 I am ... with promotion and assignment opportunities within the company.
Promotion and Carrier Path
53 39
15 I am ... with working hours. Attitude to My Job and Company
65 61
16 I am generally ... with my company. Attitude to My Job and Company
87 79
17 I am generally ... with my job. Attitude to My Job and Company
80 77
18 I come to work everyday with enthusiasm. Attitude to My Job and Company
81 72
19 I do my job happily. Attitude to My
Job and Company
91 86
20 I am proud of working for the company Attitude to My Job and Company
93 87
21 There is a positive work environment in the company/store.
Attitude to My Job and Company
75 69
22 I recommend working for the company to my friends and family.
Attitude to My Job and Company
90 82
23 I am ... with the spirit of tolerance within the company.
Company Values 75 77
24 Required actions are taken in case of inappropriate behaviour.
Company Values 71 67
25 Company/Store acts accordingly with ethical values, laws and regulations.
Company Values 89 87
21 employees.
27 I am ... with company's social responsibility activities.
Company Values 82 83
28 I am ... with company's rules. Company Values 77 77 29 I am ... with the innovative practices in the
company.
Company Values 75 72
30 I am ... with work efficiency within the company.
Policies and Strategies
69 57
31 I am ... with the clarity of company policies, memorandums and procedures.
Policies and Strategies
74 62
32 I am ... with company's management style based on memorandums and procedures.
Policies and Strategies
74 67
33 I am ... with the documentation system and the availability of data and documents.
Policies and Strategies
76 71
34 I am ... with the clarity of duties and responsibilities.
Policies and Strategies
65 57
35 I am ... with recognition and rewarding of success within the company.
Recognition and Reward
51 39
36 I am ... with bonus and reward system. Recognition and Reward
45 35
37 I am ... with the clarity of success evaluation criteria.
Recognition and Reward
59 38
38 I am ... with my salary. Remuneration 43 46 39 Compared with the sector figures and market
conditions, I am ... with my wage.
Remuneration 45 44
40 Compared to equivalent positions within the company I am ... with my wage.
Remuneration 42 42
41 I am ... with the wage evaluation methodology.
Remuneration 48 40
42 I am ... with our Managing Director / Assistant General Manager / Director.
Management Style and Effectiveness
79 69
43 I am ... with our General Coordinator. Management Style and Effectiveness
89 85
44 I am ... with the general competence of the company employees.
Management Style and Effectiveness
73 63
45 I am ... with working with my manager. Management Style and Effectiveness
80 72
Overall Average 70 62
As seen in Table 2, in two years there is a dramatic decrease in the overall average of internal customer satisfaction from 70 to 62. For this reason, this research decided to use the QFD technique for specifying the main problem which is effecting the internal customer satisfaction.
22
6.2 Application of Quality Function Deployment
Application of Quality Function Deployment to internal customer satisfaction is described step by step as follows:
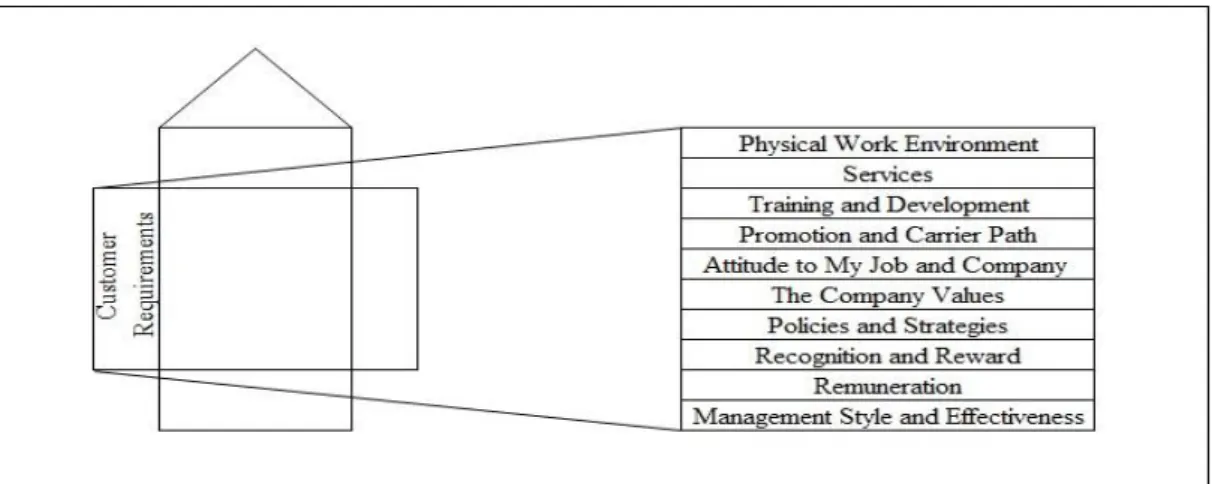
Step 1: The first output of the survey is a list of nine customer requirements, or
whats. These are listed along the left side of the matrix as shown below in Figure 2.
Figure 2. Customer requirements acquired through the survey
Step 2: In this step, technical requirements related with customer expectation are
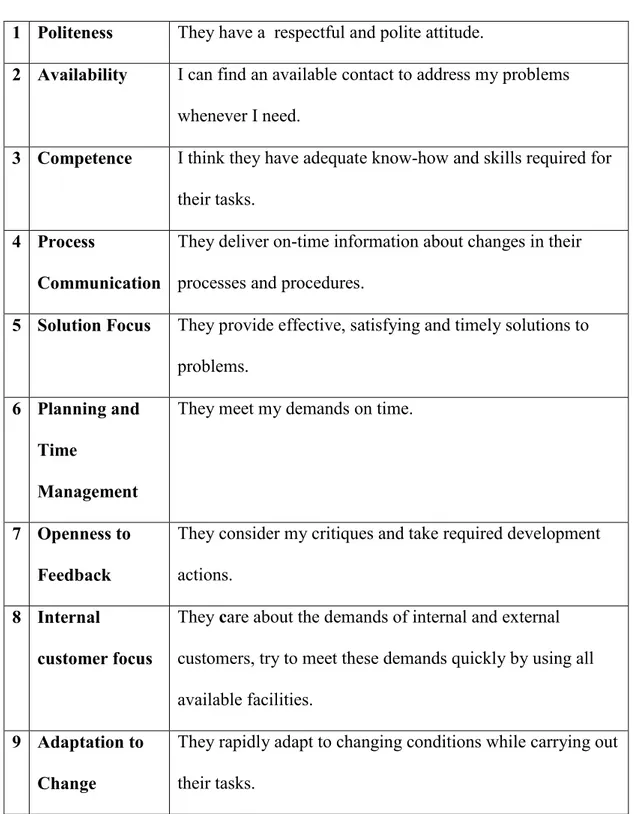
determined and explained. Technical requirements are very important for QFD analysis because engineers and experts consider these requirements when they struggle to meet the customer expectations (Scribd). To determine the requirements, experts from different departments should work together. Technical requirements which were determined in this research are as Politeness, Availability, Competence, Process Communication, Solution Focus, Planning and Time Management, Openness to Feedback, Internal customer focus, Adaptation to Change. For each technichal requirement the detailed information is given below at Table 3
23
Table 3. Technical requirements determined in this research 1 Politeness They have a respectful and polite attitude.
2 Availability I can find an available contact to address my problems whenever I need.
3 Competence I think they have adequate know-how and skills required for their tasks.
4 Process
Communication
They deliver on-time information about changes in their processes and procedures.
5 Solution Focus They provide effective, satisfying and timely solutions to problems.
6 Planning and Time
Management
They meet my demands on time.
7 Openness to Feedback
They consider my critiques and take required development actions.
8 Internal
customer focus
They care about the demands of internal and external customers, try to meet these demands quickly by using all available facilities.
9 Adaptation to Change
They rapidly adapt to changing conditions while carrying out their tasks.
Step 3: After determining the technical requirements, experts construct relationships
between customer expectations and technical requirements. Importance ratings and direction of improvement are other crucial points for QFD analysis. This information is evaluated and determined by experts. Furthermore, engineers and experts at the
24
company defined which customer expectations are related with which technical requirement.
“All relationships are classified as either strong, medium, or weak. The score of 9 is used to indicate a strong relationship between customer expectations and technical requirements. The score of 3 signifies a moderate relationship and the score of 1 refers to a weak relationship between them” (Camgöz-Akdağ et al. 2012a:445).
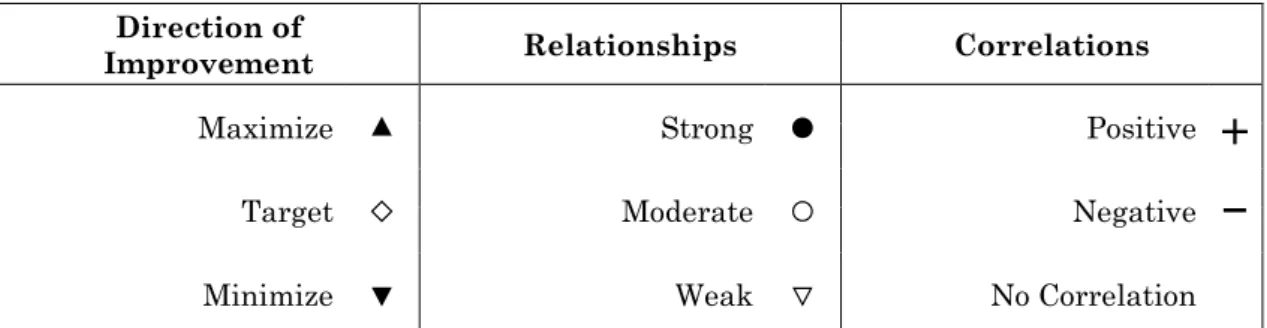
These relationships, direction of improvement and importance degrees are shown as below in Figure 3.
Figure 3. Correlation among technical requirements and direction of improvement.
Step 4: In the fourth step, experts calculated the technical importance degree of each
requirement. These values are calculated for each technical requirement as
summation of the importance degree of customer expectation which has relationship with the technical requirement multiplied with the weight of relationship. The formula is written as follows;
∑ Technical Importance Degree = ∑ (Importance degree of customer satisfaction x Weight of customer expectation).
As the questionnaire was formed with 5 likert scale, the response to each question is giving the importance degree for each related customer expectations. On the other
Direction of
Improvement Relationships Correlations
Maximize
▲
Strong●
Positive+
Target
◇
Moderate○
Negative−
25
hand relative weight of customer expectations are the percentage explained for each importance degree response (Camgöz-Akdag, 2012)
Step 5: Maximum relationship degree is showing the degree of relationship between
the customer expectation(s) and technical requirement(s). If no relationship is found between customer expectation and technical requirements, the components of customer expectations are deleted from the matrix to save space. Direction of improvement for technical requirements are symbolized with an upward triangle, downward triangle and an X. Upward triangle means needs improvement by
increasing the relationship. While a downward triangle means for improvement one should decrease. If it is decided that there is no need for improvement then that requirement direction of improvement is shown with an X. The calculated degrees of importance, relative weights and maximum relationship degree and matrix and direction of improvement (Camgöz-Akdag, 2012).
Step 6: In addition to the information given in the house of quality matrix, it can be
realized that there can be a relationship between each technical requirements in itself. Improvement for one technical requirement can also indirectly or directly affect another technical requirement positively or negatively or vice versa. The correlations among technical requirements are described in Figure 3, using a correlation matrix which also forms the roof of the quality house. Two different symbols are used in the correlation matrix to illustrate the relationship. For a positive correlation a single positive symbol (+), for a strong negative correlation two negative symbols (--) and for a negative correlation a downward triangle symbol is used. After the relationship is figured out among technical requirements the symbols are placed on the roof of the house of quality. The house of quality matrix illustrates which technical
26
QFD team should be considered with the relationships among technical characteristics because these correlations affect the improvement process.
As mentioned in the literature, this approach helps identifying the minimum set of technical requirements of a textile company to meet the various customer
requirements, in turn leading to a cost-effective means of improving quality – quality as perceived by the customers.
“House of quality (HOQ) is a core method for quality function deployment (QFD). It uses matrix deployment to transfer customer requirements into characteristics of product or service. In service HOQ, customer requirements were transferred into service characteristics through relevant matrix in service HOQ. Quality managers can use the matrix to make decisions by balancing customer needs with service characteristics. Nowadays, HOQ is a very useful tool for improving service quality and innovating quality service” (Zhang and Wang 2012:41).
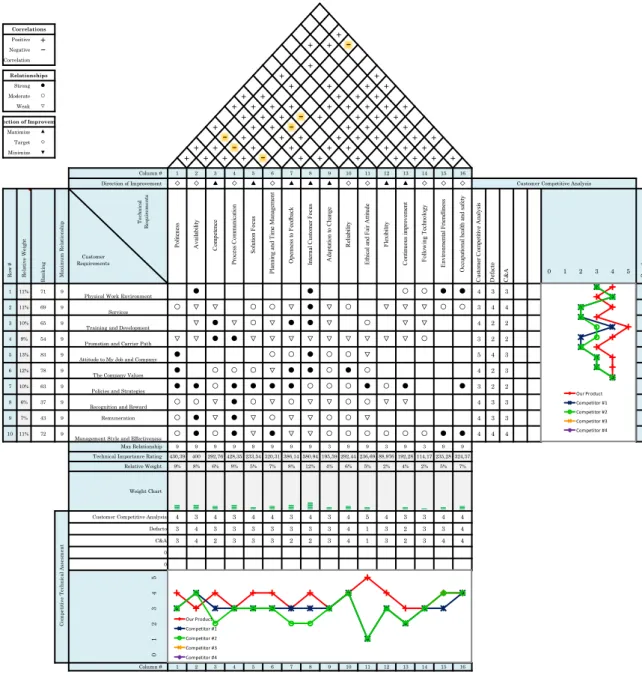
Application of QFD to internal customer satisfaction in the selected company is shown in the house of quality (HOQ) figure (see Figure 4) as follows:
27
Figure 4. House of Quality for the selected textile company
The HOQ illustrated in Figure 4 shows the customer requirements, technical requirements, maximum relationship degree, relative weight of relationships, improvement direction and correlation among technical requirements. For example; it is obvious that there is a strong relationship among technical requirements of availability, internal customer focus, environmental friendliness, occupational health
T ec h n ic al R eq u ir em en ts Customer Requirements 1 11% 71 9 4 3 3 1 2 11% 69 9 3 4 4 2 3 10% 65 9 4 2 2 3 4 9% 54 9 3 2 2 4 5 13% 83 9 5 4 3 5 6 12% 78 9 4 2 3 6 7 10% 63 9 3 2 2 7 8 6% 37 9 4 3 3 8 9 7% 43 9 4 3 3 10 11% 72 9 4 4 4 9 ● ◇ ◇15 ○ ○ ● ● E nvi ronm ent al F ri endl ine ss 16 O cc upa tiona l he al th a nd s af et y 16 15 4 3 ||| || C om pe ti ti ve T ec h n ic al A sse sm en t
Customer Competitive Analysis
M axi m u m R el at io n shi p 3 2 1 0 Defacto C&A 0 0 5 4 4 3 3 Customer Competitive Analysis
4 4 3 4 1 3 2 3 4 5 4 3 3 3 4 1 3 2 5 R ow # 3 1 2 3 4 C us tom er C om pe tit ive A na lys is D ef ac to C & A 0 ||| || || 2% 3 3 4 4 3 Correlations Positive + Negative − No Correlation Direction of Improvement Relationships Strong ● Moderate ○ Weak ▽ ▲ ◇ ▼ Maximize Target Minimize ▲ ▲ 4 5 6 7 8 1 ◇ 2 3 + + − + +
Technical Importance Rating Max Relationship 9 14 Column # Weight Chart Relative Weight 4 3 4 4 8 9 10 11 12 13 | 4 1 2 3 4 5 6 7 |||||| || 4 2 3 3 3 2 2 3 3 3 3 3 4 3 5% 7% |||| |||| ||| |||| || ||| |||| 12% 4% 6% 5% 2% 4% 9% 8% 6% 9% 5% 7% 8% 9 9 ▽ ○ 430,39 400 292,76 428,35 233,54 320,31 386,14 580,94 195,59 292,44 ○ 9 3 9 9 9 9 9 ▽ R an k in g R el at ive W ei gh t R ow # Direction of Improvement ○ ● ◇ ▲ ◇ ▲ ◇ ◇ ● ● ▽ ▽ ▽ ▽ ▽ Column # ▲ ◇14 E thi ca l a nd F ai r A tti tude F le xi bi lit y C ont inuous im pr ove m ent 9 10 Int er na l C us tom er F oc us A da pt at ion t o C ha nge P ol ite ne ss A va ila bi lit y C om pe te nc e P roc es s C om m uni ca tion S ol ut ion F oc us P la nni ng a nd T im e M ana ge m ent O pe nne ss to F ee dba ck ◇ 236,69 88,976 192,28 114,17 3 9 9 ● ● ○ ○ ○ ○ 235,28 324,57 9 3 9 ○ ▽ ○ ○ ● ▽ ● ▽▽ ○ ▽ ▽ ○ ○▽ ○ ▽ ▽ ▽ ○ ○ ▽ ▽ ▽ ▽ ▽ ▽ ▽ ▽ ○ ▽ ● ● ▽ ○ ▽ ▽ ▽ ▽ ▽ ○ ○ ▽ ● ▽ ○ ○ ○ ● ●
Policies and Strategies Recognition and Reward
● ● ▽ ● ● ○ ○ ○ ● ○ ○ ▽ ● ○
Physical Work Environment Services Training and Development Promotion and Carrier Path Attitude to My Job and Company
The Company Values ○ ○ ○
▽ ▽ ● ● ▽ + + + +++ 11 12 ▲ ▲ + + + + + R el ia bi lit y + + − ++ ++ + + + + + + + + + + + − + + + + + − + + + + + + + + + + − + + + + + + + + + + + + + + + ● ○ ● ○ ○ ○ ● ● ● ○ ● ○ ● + + + − F ol low ing T ec hnol ogy 13 ○ ● ○
Management Style and Effectiveness
Remuneration ○ ● ▽ ● Our Product Competitor #1 Competitor #2 Competitor #3 Competitor #4 Our Product Competitor #1 Competitor #2 Competitor #3 Competitor #4
28
and safety with the customer requirement of physical work environment. Secondly, there is a strong relationship between technical requirement of internal customer focus and customer requirement of services. On the other hand, there is a lower relationship between availability, competence, openness to feedback, adaptation to change but still it must be realized that there is a relationship, which means the services such as company’s social opportunities, transportation services, catering services and quality has a slight effect on availability, competence, openness to feedback, adaptation to change. Thirdly, it is again obvious that there is a strong relationship among technical requirements of competence, openness to feedback, internal customer focus and the customer requirement of training and development. However, there is a weak relationship between availability, process communication, planning and time management, adaptation to change, continuous improvement and customer requirement of training and development.
When the relative weight of column is analyzed it is seen that internal customer focus has the highest weight score meaning that when internal customer focus is improved there will be almost 12% of improvement in the company. The second highest relative weight score is calculated to be the politeness which states that an improvement in politeness will improve the company by 9%. The third highest relative weight score is equal to the second highest relative weight score which is given to the process communication as it has a score of 9%. The fourth highest relative weight score is calculated to be the availability as it has a score of 8%
meaning that when availability improved, there will be almost 8% of improvement in the company. All three are related to behavior and attitude toward internal customer. When all of the above four are obtained the company will improve and satisfy the internal customers by total 38%.
29
The correlation among technical requirements indicate that politeness has a strong positive relationship with availability, competence, solution focus, openness to feedback and internal customer focus. Availability has a strong relationship with competence, process communication, openness to feedback, internal customer focus, ethical and fair attitude, following technology. On the other hand, availability has a negative relationship with solution focus. This is reasonable as effective solution will not be available if there is nobody to address your problem. Competence has a strong relationship with process communication, planning and time management, openness to feedback, internal customer focus, adaptation to change, ethical and fair attitude, continuous improvement, environmental friendliness, occupational health and safety. Competence has a negative relationship with solution focus. This is logical as it is not possible to be solution focused without the necessary skills. Process
communication has a strong relationship with solution focus, planning and time management, internal customer focus, adaptation to change, reliability and has a negative relationship with occupational health and safety. Solution focus has a strong relationship with internal customer focus and continuous improvement. On the other hand, it has a negative relationship with planning and time management, adaptation to change, reliability. Planning and time management has a strong relationship with internal customer focus, adaptation to change, ethical and fair attitude, flexibility, continuous improvement. Openness to feedback has a strong relationship with internal customer focus, continuous improvement, following technology,
environmental friendliness and occupational health and safety. Internal customer focus has a strong relationship with adaptation to change, reliability, ethical and fair attitude, flexibility, continuous improvement, following technology, environmental friendliness, occupational health and safety. Adaptation to change has a strong
30
relationship with ethical and fair attitude, flexibility, continuous improvement, following technology, environmental friendliness. Reliability has a strong
relationship with ethical and fair attitude, continuous improvement, environmental friendliness and occupational health and safety. Ethical and fair attitude has a strong relationship with continuous improvement and environmental friendliness.
Flexibility has a strong relationship with continuous improvement, following technology, environmental friendliness. Continuous improvement has a strong relationship with following technology and environmental friendliness, occupational health and safety. Following technology has a strong relationship with environmental friendliness.
31
7. CONCLUSIONS
The aim of this thesis is to figure out the factors effecting the motivation of internal customers due to firm growth.
This thesis illustrates how an existing approach of SERVQUAL and QFD integration can be applied to a textile company. As a first attempt to applying this integrative approach to a different sector and thus offering practical and applied information, it will be useful for both academicians and professionals in this sector.
From a methodological perspective, it can be concluded that the ability of correlating technical requirements with customer satisfaction makes this approach a powerful tool for textile sector like other sectors.
In order to stay competitive, designing technical requirements in according with customers’ expectations has become an increasingly important necessity for textile companies. In this context, this approach provides textile companies a deep understanding of their service quality levels from internal customer satisfaction perspective. Also, highlighting the most important customer requirements which are highly attractive for their internal customers helps textile companies to develop innovative ideas in both strategic and tactical levels.
Secondly, using two methods in a complementary way creates some
methodological and practical benefits (Camgöz-Akdağ, 2012). Even though using these two methods has benefits it should also be mentioned that of course there are some limitations of each method. For SERVQUAL, limitations such as measuring the expectations of excellence which might not exist, weak discrimination between the dimensions and the results of gap analysis which cannot be easily generalized to the other areas can be also mentioned here (Alves and Vieira, 2006). Since QFD is so sensitive to measurement of customer needs and expectations, the success of the
32
method largely depends on the presenting power of the data collected on previous levels. Also, the procedure of aggregating customer demands and identifying their relative importance can be problematic in some situations (Poel, 2007).
The limitations, however, have not affected the use of the integrative model, as its advantages are far greater than its limitations. In summary, since none of the methods separately can achieve total benefits of this integrative approach and also minimal amount of adaptation is required for either method (Pawitra and Tan, 2001).
This methodology can be evaluated as sufficient in response to the main goal of this study. Also, ease of applying this methodology to different sectors constitutes the practical benefit aspect and makes it desirable for textile sector as well.
Based on the QFD application, improvement points are occured as internal customer focus, politeness, process communication and availability. As the most important expectations of the internal customer are also determined, improvement in those technical characteristics shows that there will be a total of 38% improvement in the internal customer satisfaction.
With the help of QFD method, which has a significant contribution in
converting social phenomenon as listening the voice of customer into numeric data, improvement in only one technical characteristic, more than one improvement happens in the customer expectation side.
33
REFERENCES
Abanoz, S. (2008) Kalite Fonksiyon Göçerimi ve Bankacılık Sektöründe Bir Uygulama. Yüksek Lisans, Karadeniz Teknik Üniversitesi, Sosyal Bilimler
Üniversitesi.
Akao, Y. (1990) Quality Function Deployment: Integrating Customer Requirements into Product Design. Productivity Press, Cambridge, MA.
Alves, A. and Vieira, A. (2006) Untitled paper, paper presented at SERVQUAL as a
marketing instrument to measure service quality in higher education institutions. Second International Conference: Product Management-Challenges of The Future,
Poznan.
Antoncic, J. and Antoncic, B. (2011) Employee satisfaction, intrapreneurship and firm growth: a model. Industrial Management & Data Systems, Vol. 111 (4), p.589-607.
Antreas, D. and Opoulos, A. (2003) Modeling customer satisfaction in
telecommunication:. Production and Operation Management, 12 (2), p.224-45. Babakus, E. and Mangold, W. (1992) Adapting the SERVQUAL scale to hospital services:. Health Services Research, 26 (6), p.767-88.
Baki, B. et al. (2009) An application of integrating SERVQUAL and Kano’s model into QFD for logistics services: A case study from Turkey.. Asia Pacific J. Mark. and
Logistics, 21 (1), p.106-126.
Berk, J. and Berk, S. (2000) Untitled. Quality management for the technology sector,
Boston, Newnes. .
Bolton, R. and Drew, J. (1991) A longitudinal analysis of the impact of service changes on. Journal of Marketing, 55 (1), p.1-10.
Bossert, J. (1991) Quality Function Deployment: A Practitioner’s Approach. ASQC
Quality Press, Milwaukee, WI..
Camgöz-Akdağ, H. et al. (2012) 4th Annual Canadian Quality Congress, June 27-29, Carleton University, Ottawa.
Camgöz-Akdağ, H. et al. (2012a) Product Improvement with Quality Function Deployment Technique. Advanced Materials Research , 445 p.1058-1063. Chan, L.-K. and Wu, M.-L. (2002), “Quality function deployment: a literature review”, European Journal of Operational Research, 143, p.463-97.
34
Corporate.lcwaikiki.com (2012) LCWaikiki Kurumsal - Hoş geldiniz. [online] Available at: http://corporate.lcwaikiki.com [Accessed: 25 Apr 2013].
Cranny, C. et al. (1992) Job Satisfaction: How People Feel about Their Jobs and
How It Affects Their Performance, . New York: Lexington Books.
Cronin, J. and Taylor, A. (1992) Measuring service quality: a re-examination and extension. Journal of Marketing, 56 p.55-68.
Dent, E. and Goldberg, S. (2013) Challenging ‘resistance to change’. The Journal of
Applied Behavioral Science, 35 p.25-41.
Ellickson, M. (2002) Determinants of Job Satisfaction of Municipal Government Internal Customers. Public Personnel Management, 31 (3), p.343-58.
Eskildsen, J. and Dahlgaard, J. (2000) A causal model for internal customer satisfaction. Total Quality Management, 11 (8), p.1081-1094.
Farrell, D. and Stamm, C. (1988) Meta-Analysis of Correlates of Internal Customer Absence. Human Relations, 41 (3), p.211-27.
Franceschini, F. and Rossetto, S. (1995) QFD: the problem of comparing
technical/engineering design requirements. Research in Engineering design, 7 (4), p.270-278.
Franceschini, F. and Terzago, M. (1998) An application of quality function
deployment to training courses. Int. J. Quality and Reliability Manage, 15 (7), p.753-68.
Glasby, J. and Lester, H. (2004) Cases for change in mental health: Partnership working in mental health services. Journal of Interprofessional Care, 18 p.7-16. Gonza´ Lez, M. (2001) Quality Function Deployment; A Road for Listening the
Customer Expectations. Mexico City, Mexico: McGraw-Hill .
Gonza´ Lez, M. et al. (2003) Improving product design using quality function deployment: the school furniture case in developing countries. Quality Engineering
Journal, 16 (1), p.47-58.
Gremler, D. et al. (1994) The Internal Service Encounter. International Journal of
Service Industry Management, 5 (2), p.34 – 56.
Griffeth, R. et al. (2000) A Meta-Analysis of Antecedents and Correlates of İnternal customer Turnover: Update, Moderator Tests, and Research Implications for the Next Millennium. Journal of Management, 26 (3), p.463-88.
35
Hauser, J.R. and Clausing, D. (1988), “The house of quality”, Harvard Business
Review, p.63-73.
Herzberg, F. (1964) The motivation-hygiene concept and problems of manpower.
Personnel Administrator, 27 p.3-7.
Herzberg, F. (1966) Work and the Nature of Man. Cleveland, OH: World Publishing. Heskett, J. et al. (1997) The Service Profit Chain: How Leading Companies Link
Profit and Growth to Loyalty, Satisfaction, and Value . New York: The Free Press.
Hui, C. and Lee, C. (2000) Moderating effects of organization-based self-esteem on organizational uncertainty: Internal customer response relationships. Journal of
Management, 26 p.215-232.
Innstrand, S. et al. (2004) Job stress, burnout and job satisfaction: An intervention study for staff working with people with intellectual disabilities. Journal of Applied
Research in Intellectual Disabilities, 17 p.119-126.
Itkib.org.tr (2005) Istanbul Tekstil ve Konfeksiyon Ihracatci Birlikleri - ISTANBUL
TEXTILE APPAREL EXPORTERS. [online] Available at: http://www.itkib.org.tr
[Accessed: 14 Apr 2013].
Juran, J. (1988) Quality Control Handbook . 4th ed. New York, NY: McGraw-Hill. Kelemen, M. (2003) Managing quality: managerial and critical perspectives. SAGE. Kendall, S. (2007) Customer Service from the Customer's Perspective". In Fogli,
Lawrence. Customer Service Delivery: Research and Best Practices. J-B SIOP Professional Practice Series 20. John Wiley and Sons.
Kim, J. et al. (1998) A knowledge based approach to the quality function deployment. Computers and Industrial Engineering, 35 (1/2), p.233-6. Kirkman, B. and Shapiro, D. (2001) The Impact of Cultural Values on Job
Satisfaction and Organizational Commitment in Self-Managing Work Teams: The Mediating Role of Internal customer Resistance. Academy of Management Journal, 44 (3), p.557-69.
Kotter, J. and Schlesinger, L. (1979) Choosing strategies for change. Harvard Business Review, 57 p.106-114.
Lim, P. et al. (1999) An innovative framework for health care performance measurement. Managing Serv. Quality, 9 (6), p.423-433.
36
Locke, E. eds. (1976) The nature and causes of job dissatisfaction. Chicago, IL: Rand McNally, p.1297-347.
Lofquist, L. and Dawis, R. (1969) Adjustment to Work: A Psychological View of
Man’s Problems in a Work-oriented Society. New York, NY:
Appleton-Century-Crofts.
Mack, D. et al. (1998) The stress of organizational change: A dynamic process model. Applied Psychology, 47 p.219–232.
Macr`I, D. et al. (2002) A grounded theory for resistance to change in a small organization. Journal of Organizational Change Management, 15 p.292–310. Marshall, G. et al. (1998) Exploring internal customer service quality. Journal of
Business & Industrial Marketing, 13 p.381–392.
Matzler, K. and Hinterhuber, H. (1998) How to make product development projects more successful by integrating Kano’s model of customer satisfaction into quality function deployment. Technovation, 18 (1), p.25-38.
Mehrjerdi, Y. (2010) Applications and extensions of quality function deployment.
Assembly Automation, 30 (4), p.388-403.
Mehrjerdi, Y. (2010a) Quality function deployment and its extensions. International
Journal of Quality & Reliability Management, 27 (6), p.616-640.
Miller, D. (2002) uccessful change leaders: What makes them? What do they do that is different?. Journal of Change Management, 2 p.359–368.
Miyoung, J. and Haemoon, O. (1998) Quality function deployment: an extended framework for service quality and customer satisfaction in the hospitality industry.
International Journal of Hospitality Management, 17 (4), p.375-90.
Parasuraman, A. et al. (1985) A conceptual model of service quality and its implications for future research. Journal of Marketing, 4 (4), p.44-51.
Parasuraman, A. et al. (1991) Refinement and reassessment of the. Journal of
Retailing, 67 (4), p.420-50.
Parry-Jones, B. et al. (1998) Stress and job satisfaction among social workers, community nurses and community psychiatric nurses: Implications for the care management model. Health and Social Care in the Community, 6 p.271–285. Peters, V. (1999) Total service quality management. Managing Service Quality, 29 (1), p.6-12.
37
Poel, I. (2007) Methodological problems in QFD and directions for future development. Research in Engineering Design, 18 (1), p.21-36.
Pun, K. et al. (2000) QFD/hoshin approach for service quality deployment: a case study. Managing Service Quality, 10 (3), p.156-70.
Reeves, C. and Bednar, D. (2005) Defining Quality. In Wood, John Cunningham;
Wood, Michael C. Joseph M. Juran: critical evaluations in business and management. Routledge.
Scribd.com (1980) Müşterinin Sesi QFD. [online] Available at:
http://www.scribd.com/doc/6570018/Muterinin-Sesi-QFD [Accessed: 14 Apr 2013]. Smith, P. et al. (1969) The Measurement of Satisfaction in Work and Retirement. Chicago, IL: Rand McNally.
Spector, P. (1997) Job Satisfaction: Application, Assessment, Causes, and
Consequences. Thousand Oaks, CA: Sage.
Spreng, R. and Mackoy, R. (1996) An empirical examination of a model of perceived service quality and satisfaction. Journal of Retailing, 72 (2), p.201-14.
Stracke, C. (2006) Process-oriented quality management. In Ehlers, Ulf-Daniel;
Pawlowski, Jan Martin. Handbook on quality and standardisation in e-learning.
Springer.
Stuart, F. and Tax, S. (1996) Planning for service quality: an integrative approach.
International Journal of Service Industry Management, 7 (4), p.58-77.
Studymode.com (2008) Tqm - Essays. [online] Available at:
http://www.studymode.com/essays/Tqm-183430.html [Accessed: 25 Apr 2013]. Suki, N. et al. (2009) 1. A Comparison of Human Elements and Nonhuman Elements in Private Health Care Settings: Customers’ Perceptions and Expectations. Journal of
Hospital Marketing & Public Relations , 19 (2).
Sullivan, L. (1986) Quality function deployment. Quality Progress, 19 (6), p.39-50. Tan, K. and Pawitra, T. (2001) Integrating SERVQUAL and Kano’s model into QFD for service excellence development. Managing Service Quality, 11 (6), p.418-30. Tang, J. et al. (2002) A new approach to quality function deployment planning with financial consideration. Journal of Computers and Operations Research, 29 (11), p.1447-63.