INTERNATIONAL COMPETITIVENESS POWER AND HUMAN
DEVELOPMENT OF COUNTRIES
Füsun Ülengina*, Özgür Kabakb, Şule Önsela, Emel Aktaşb, Gündüz Ulusoyc
a Dogus University, Faculty of Engineering, Department of Industrial Engineering, Acibadem,
34722 Kadikoy, Istanbul, Turkey
b Istanbul Technical University, Faculty of Management, Department of Industrial Engineering,
Macka, 34357 Istanbul, Turkey
c Sabancı University Faculty of Engineering and Natural Sciences, Orhanli, Tuzla, 81474 Istanbul,
Turkey
ABSTRACT
Human development should be the ultimate objective of human activity and its aim should be healthier, longer, and fuller lives. It is expected that if the competitiveness of a country is suitably managed, human welfare will be enhanced as a consequence. The research described here seeks to explore the relationship between the competitiveness of a country and its use for human development. For this purpose, 45 countries were evaluated using data envelopment analysis, where the global competitiveness indicators are taken as input variables and the human development index indicators as output variables. A detailed analysis is also conducted for the emerging economies.
Keywords: Data envelopment analysis, competitiveness, human development
1. INTRODUCTION
The near future is expected to bring important changes to the shape of the world economy and to the landscape of major industries. In seeking to explain patterns of international competition, several researchers, such as Kogut (1988), Porter (1990), and Dunning (1990, 1993), have emphasized the importance of the characteristics of the home country in determining the competitive position of national firms in international markets. A nation’s competitiveness has been defined by Artto (1987) as “the degree to which a nation can, under free and fair market conditions, produce goods and services that meet the test of international markets while simultaneously expanding the real incomes of its citizens”, thus improving their quality of life.
Global markets, global technology, global ideas and global solidarity can enrich the lives of people everywhere. The challenge is to ensure that the benefits are shared equitably and that this increasing interdependence works for people-not just for profits. The present era of globalization, driven by competitive global markets, is outpacing the governance of markets and the repercussions on people.
If directed towards the needs of people, the competitiveness of a nation can bring advances for all humankind, but markets can go too far and squeeze the no market activities so vital for human development. Human development denotes both the process of widening people’s choices and the level of their achieved well-being. The most critical choices are to lead a long and healthy life, to be educated, and to enjoy a decent standard of living. Additional choices include political freedom,
*
Corresponding author. Tel. +902163271104/1354, Fax: +90216327 9631, Email Adress: [email protected], [email protected] (F. Ülengin)..
guaranteed human rights, and self-respect. The concept distinguishes between two sides of human development. One is the formation of human capabilities, such as improved health or knowledge. The other is the use that people make of their acquired capabilities, for work or leisure.
This paper proposes a methodology to objectively analyze the relationship between the competitiveness level of a country and its capability to enhance human development. For this purpose, data envelopment analysis (DEA) is used.
The second section of the paper describes the state of the art in measuring the performance of nations in terms of both their competitiveness and their human development. The third section summarizes the basic stages used in the proposed methodology. In the fourth section, some selected countries are evaluated on the basis of a DEA, and the efficiency of the selected countries in converting their competitiveness into human development is investigated. Finally, a conclusion and further suggestions are given.
2. MEASURING THE PERFORMANCE OF NATIONS
Very few studies have attempted a comprehensive comparison of the performance of countries (Zanakis and Fernandez, 2005). The performance of countries across the world has been compared using a variety of indices, for example the global competitiveness index (Sala-i-Martin and Artadi, 2004). Several attributes are normally considered when developing such indices. The schemes used can be termed fixed-weight schemes, as they combine the performance in terms of various attributes using pre-fixed weights, which may be chosen subjectively.
2.1. Evaluation of Competitiveness
Every year, some organizations, such as the World Economic Forum (WEF) and the Institute for Management Development (IMD) (http://www.imd.ch), publish rankings of national competitiveness among countries. These rankings serve as benchmarks for national policymakers and interested parties to judge the relative success of their country in achieving the competitiveness criteria represented by the corresponding competitiveness index. The IMD, jointly with the WEF, has produced comparisons of nations’ competitiveness through the annual publication of the World Competitiveness Yearbook since 1989.
The WEF uses three competitiveness indices in order to analyze the competitiveness level from macroeconomic and microeconomic perspectives. The Growth Competitiveness Index (GCI), developed by McArthur and Sachs (2001) and Blanke and Lopez-Claros (2004), makes an evaluation based on critical and, mostly, macroeconomic environmental factors that influence sustained economic growth over the medium to long term. Porter’s Business Competitiveness Index (BCI) (Porter, 1990), however, investigates the company-specific factors that lead to improved efficiency and productivity indicators from a microeconomic perspective and is complementary to the GCI. Recently, a Global Competitiveness Index (WEF, 2005), which is a synthesis of the GCI and the BCI, has also been provided. This new index was designed with the goal of unifying the GCI and the BCI, and it is meant eventually to replace them in the Global Competitiveness Report.
Global Competitiveness Index is based on three principles. (1) The determinants of competitiveness are complex, and competitiveness is composed of twelve pillars. Each of the twelve pillars has different weights for each stage of development. (2) Economic development is a dynamic process of successive improvement, i.e. it evolves in stages. In the most basic stage, called the factor-driven stage, firms compete on price and take advantage of cheap labor and/or unprocessed natural resources. In the second stage, called the efficiency-driven stage, efficient production becomes the main source of competitiveness. Finally, in the innovation-driven stage, successful economies can no longer compete on price or even quality and have to produce innovative products and practices using the most advanced methods of production and organization. (3) As economies develop, they move from one stage to the next in a smooth fashion.
The WEF Global Competitiveness Index is calculated for the different groups of countries using three sub-indices; namely, basic requirements, efficiency enhancers, and innovation and sophistication factors. The “basic requirements” sub-index that is most critical for the countries in the factor- driven stage contains the indicators related to institutions, infrastructure, macro-economy, personal security, and basic human capital. The “efficiency enhancers” sub-index that is most critical for the countries in the efficiency- driven stage includes indicators about advanced human capital, good market efficiency, labor market efficiency, financial market efficiency, technological readiness, and openness / market size. The “innovation and sophistication factors” sub-index that is most critical for the countries in the innovation- driven stage includes business sophistication, and innovation.
The concept of “national competitiveness” has been criticized in recent years. According to some research, defending national competitive interests often becomes a façade for asking for privileges for particular groups, or seeking to prop up uneconomic activities (Lall, 2001). The WEF is clearly concerned with dynamic comparative advantage and underlines that the ability to sustain income and growth depends, in a globalized world, on each country’s ability to innovate or import and use technologies created elsewhere. The WEF indices assign uniformly higher values to freer trade, stronger intellectual property protection, and more liberal capital accounts across countries. However, the WEF has not analyzed whether a highly competitive country is also one which uses this power for the sake of human development (Lall, 2001). It is expected that if the competitiveness of a country is suitably managed, human welfare will be enhanced as a consequence. In fact, human development should be the ultimate objective of human activity and should be aimed at healthier, longer, and fuller lives.
2.2. Evaluation of Human Development
The United Nations Development Program (UNDP, 1990), through its Global Human Development Reports (HDRs), has defined development as a process of enlarging people’s choices, as well as raising the level of well-being. In principle, these choices can be infinite and can vary over time and space. From among these, the HDRs identify the choices to lead a long and healthy life, to acquire knowledge and be educated, and to have access to the resources needed for a decent standard of living as the three most critical and socially valuable issues. Thus the above report focuses on indicators of longevity, literacy, and per capita income (http://hdr.undp.org/hd/).
The UNDP claims that the Human Development Index (HDI) is superior to per-capita GDP for measuring social well-being because per-capita GDP measures only income, whereas the HDI is also weighted for longevity and education, and per-capita GDP only reflects average income, whereas the HDI is influenced by the type of goods that constitute the GDP. The HDI measures the average achievements in three basic dimensions of human development, namely a long and healthy life (measured by life expectancy at birth); knowledge (measured by the adult literacy rate (with two-thirds weight)) and the combined primary, secondary, and tertiary gross enrolment ratio (with one-third weight); and a decent standard of living (measured by GDP per capita).
Before the HDI itself is calculated, an index needs to be created for each of these dimensions. To calculate these dimension indices—the life expectancy, education, and GDP indices—minimum and maximum values are chosen for each underlying indicator. The performance in each dimension is expressed as a value between 0 and 1 by applying the following general formula (UNDP, Human Development Report, 1990, box 1.1):
Dimension index = (actual value − minimum value)/ (maximum value − minimum value) The HDI is then calculated as a simple average of the dimension indices. To construct the HDI, the UNDP looks at various measures of social outcome for each country and establishes a dimension index for each country (www.un.org.my/uploads/files/HDI_Technical_note.pdf). Because the index calculations can change from one publication to the next, the UNDP recalculates the HDI for all countries from 1975 to the current year using the current year’s index calculation.
As a result, HDI figures published in different years cannot be directly compared. The HDI can be comparable over time if it is calculated using the same methodology and comparable trend data.
The various indices that have been developed to measure either the competitiveness level or the human development of countries have been subject to severe criticism. One of the major criticisms is related to the subjectivity in the weights of the criteria. For example, Ulengin et al. (2006) criticized the subjectively applied weights in the WEF indices and underlined that their uniform application to every country may incorrectly penalize some countries. In order to aggregate the various hard and soft data into a unified composite indicator, the WEF uses a fixed set of weight values that are then applied uniformly to the underlying data for each country. Therefore, these types of indices developed in this way do not provide useful guides for executives and policymakers, since the resulting ranking of countries may be biased.
Since its establishment, the HDI has also met with considerable criticism of various attributes, such as the way its component indices are derived from the raw data, and the additivity of the aggregation method. Another critical issue in the calculation of the HDI is the fact that equal weights are given to its component indices. Although this assumption has been supported in the Human Development Reports, it has also met with considerable criticism in the literature (Despotis, 2005; Neumayer, 2001).
The drawbacks of the various indices used to measure competitiveness or human development are beyond the scope of the research described here. The basic aim of our research was, nevertheless, to investigate how successful countries are in using their competitiveness for the development of human life.
2.3. Relationship between Competitiveness and Human Development
According to our knowledge, the relationship between competitiveness and the capability for human development has not been analyzed in depth in the literature. Ranis and Steward (2000) investigated the connection between economic growth and human development and mentioned that a strong connection between economic growth and human development is expected. On the one hand, economic growth provides the resources to permit sustained improvements in human development. On the other hand, improvement in the quality of the labor force is an important contributor to economic growth. However, they underlined that while this two-way relationship may now be widely accepted, the specific factors linking the two elements have not been systematically explored. Davies and Quinlivan (2006) performed a panel analysis to analyze the impact of trade on human development. They state that the standard argument for a positive relationship between trade and human development is that more trade results in a greater standard of living, which, in turn, results in more education, better health care, better social services, etc. The standard argument rests on the premise that the influence of trade on income is direct, while the influence of trade on nonincome measures is indirect and is transmitted via income. Trade results not merely in an increase in the quantity of goods consumed, but in an increase in the variety of goods consumed. In the case of a developing nation, the new types of goods will include medicines, health-related equipment, and medical training-all of which improve the health, nutrition, and longevity of the country’s people. Improvements in trade will result in some immediate income gains. The immediate income gains will, in turn, result in future increases in literacy and health as people’s standards of living rise and the opportunities for returning to education increase. Davies and Quinlivan (2006) find that increases in trade are positively associated with future increases in social welfare.
This research sought to explore the relationship between the competitiveness of a country and its use for human development. For this purpose, 45 countries were evaluated by DEA, taking the global competitiveness indicators as input variables and the human development indicators as output variables.
3. FRAMEWORK OF THE PROPOSED METHODOLOGY
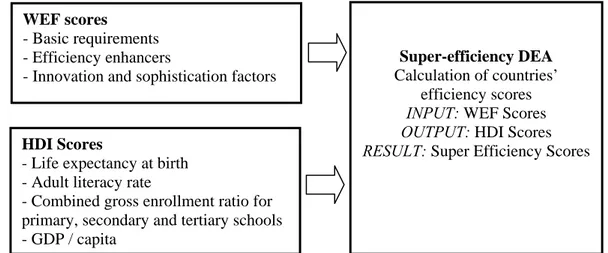
Our proposed methodology aims to determine to what extent the countries are efficient in using their competitiveness for the improvement of their human development level. A super-efficiency DEA approach is conducted for this purpose in order to measure the efficiency of countries in using their competitiveness for the welfare of their citizens. The scores for the three main dimensions of the WEF’s competitiveness index, namely basic requirements (BASREQ), efficiency enhancers (EFFENH), and innovation and sophistication factors (INSOPF), are used as the inputs. On the other hand, in order to represent the human development of the countries, the criteria used in the HDI are taken as the output of the DEA. These criteria are life expectancy at birth (LIFEXP) used as a proxy for health achievement, adult literacy rate (LITERT), combined gross enrolment ratio for primary, secondary, and tertiary schools (ENROLL) both used as a proxy for educational attainment, and GDP per capita (GDPCAP). Input and output data were gathered from the WEF 2004 report and the Human Development Report 2005 (www.sd.undp.org/HDR/HDR05e.pdf), respectively. Figure 1 shows the inputs, outputs and scores of the proposed super-efficiency DEA approach.
Figure 1 - Framework of the proposed super-efficiency DEA approach
WEF scores
- Basic requirements - Efficiency enhancers
- Innovation and sophistication factors
Super-efficiency DEA
Calculation of countries’ efficiency scores INPUT: WEF Scores OUTPUT: HDI Scores RESULT: Super Efficiency Scores
HDI Scores
- Life expectancy at birth - Adult literacy rate
- Combined gross enrollment ratio for primary, secondary and tertiary schools - GDP / capita
3.1. The Motivation to Use Data Envelopment Analysis
DEA is a method of measuring relative efficiency for a group of operating units where the relative values of the variables are unknown. It accommodates multiple inputs and outputs and can also include exogenously fixed environmental variables. DEA utilizes the fundamental concept of a production function, and since it uses linear programming it is a nonparametric technique that does not require assumptions about the statistical properties of the variables (Retzlaff-Roberts, 2004).
In DEA, it is the normal practice to decide about the relative importance of competing explanatory factors prior to the analysis. The inputs and the outputs are entered into the DEA optimization algorithm but there is no built-in test of their appropriateness. With DEA, one has also to decide about the sign of these explanatory factors prior to the running of the DEA program. DEA does not require the specification of a functional form to be fitted. If the true functional form is unknown, this feature of DEA could be advantageous, since it avoids the danger of fitting the wrong functional form. If used carefully with large samples, DEA is good at identifying possible reasons for apparently poor performance which might be highlighted by crude indicators such as performance ratios, and is good at providing a checklist of questions for management (Cubbin and Tzanidakis, 1998).
In classical DEA, decision-making units (DMUs) are represented on a scale from 0 to 1. Efficient DMUs have efficiency scores equal to 1.0 where inefficient DMUs have scores less than 1.0. The efficiency score of a DMU is measured by means of a combination of DEA-efficient
DMUs, which form part of the segments on the efficiency frontier. The efficient DMUs are not comparable among themselves in the CCR model (Charnes et al., 1978), and other DEA models.
In some problems, the number of efficient DMUs (i.e. with efficiency = 1) may be very high. This results in incomparability of many DMUs. In such situations, a super-efficiency DEA model is used to evaluate the efficient DMUs. When the DMU under evaluation is not included in the reference set of the original DEA model, the resulting DEA model is called a super-efficiency DEA model (Chen, 2004). In order to avoid incomparability of DMUs, the super-efficiency DEA model (Li et al., 2006) was used in this study.
3.2. Theoretical Framework of Super-Efficiency Data Envelopment Analysis
DEA is a data-oriented method for measuring and benchmarking the relative efficiency of peer decision-making units (Charnes et al., 1978; Cooper et al., 2000). We assume that there are n homogeneous DMUs such that all the DMUs use m inputs xij (i = 1, …, m) to produce s outputs yrj
(r = 1, …, s). It is also assumed that the Xj = (xij) ∈ ℜs×n are nonnegative. On the basis of the
output-oriented CCR model (Cooper et al., 2000); an output-output-oriented super-efficiency model can be defined as the following:
Maximize η0, subject to 0 1 0 0 0 1 0 0 1,..., , 0 1,..., , 0 1,..., . n i j ij j j n r j rj j j j x x i m y y r j n μ η μ μ = ≠ = ≠ − ≥ = − ≤ = ≥ =
∑
∑
sHere 1/η0 gives the efficiency value for DMU0. However, although the resulting values for the
inefficient DMUs (i.e. those with efficiency < 1) are the same as the classical model, the results for the efficient DMUs are greater than or equal to 1, which reflects the super-efficiency levels, and the result allows a comparison of efficient DMUs.
4. EVALUATION OF SELECTED COUNTRIES BASED ON DEA
In this study, in order to make a comparison between countries of similar scale, the countries which represented 90% of the world in terms of both world population and total world GDP were evaluated. For this reason, from the countries evaluated by the WEF (104 countries), only those having a population of over 25 million and/or a GDP level over 200 billion US dollars were selected for this study. Among the selected countries, 17 constituted the largest economies in the world in terms of purchasing power parity (PPP). These were the current G7 (US, Japan, Germany, UK, France, Italy, and Canada), plus Spain, Australia, and Korea, and the seven largest emerging-market economies, which are referred to collectively as the “E7” (China, India, Brazil, Russia, Indonesia, Mexico, and Turkey) (Hawksworth, 2006). The selected countries included 20 OECD countries, 12 European countries, members of the European Union, and 4 non members (Turkey, Russia, Norway, and Ukraine). The selected list of countries also includes 10 countries from Africa, 10 countries from Asia, 6 from South America, 2 from North America, and finally Australia.
4.1. Ranking of the Countries
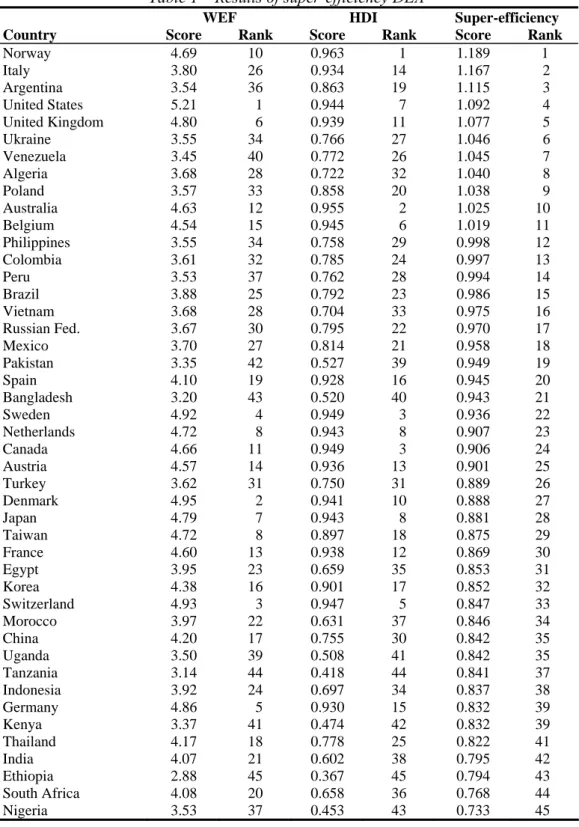
When the results of super efficiency DEA model results are analyzed (see Table 1), it is found that 11 countries are found to be efficient (i.e. they have a super-efficiency score ≥ 1). In fact, the results underline that Algeria, Argentina, Italy, Poland, Ukraine, and Venezuela which had low ranks (28th, 36th, 26th, 33rd, 34th, and 40th, respectively) according to the WEF Global Report, were in the group of efficient countries. HDI scores of these countries are relatively high with respect to their WEF
scores. It can be said that the human development performance of these nations is relatively high compared with their competitiveness.
In contrast, Denmark (2nd), Switzerland (3rd), Sweden (4th), Germany (5th), Japan (7th), Netherlands (8th), and Taiwan (9th), which had the top ranks according to the WEF global index, were at lower ranks with respect to the super-efficiency score. This shows that these countries are not using efficiently their competitiveness and their potential to improve their human development efficiency. The life expectancy score of Denmark is relatively low (16th rank) where Japan ranks 24th in enrollment. Similarly Germany ranks 19th in enrollment, 12th in life expectancy, and 11th in GDP while it ranks very high (5th) in the WEF score.
Table 1 – Results of super-efficiency DEA
WEF HDI Super-efficiency
Country Score Rank Score Rank Score Rank
Norway 4.69 10 0.963 1 1.189 1 Italy 3.80 26 0.934 14 1.167 2 Argentina 3.54 36 0.863 19 1.115 3 United States 5.21 1 0.944 7 1.092 4 United Kingdom 4.80 6 0.939 11 1.077 5 Ukraine 3.55 34 0.766 27 1.046 6 Venezuela 3.45 40 0.772 26 1.045 7 Algeria 3.68 28 0.722 32 1.040 8 Poland 3.57 33 0.858 20 1.038 9 Australia 4.63 12 0.955 2 1.025 10 Belgium 4.54 15 0.945 6 1.019 11 Philippines 3.55 34 0.758 29 0.998 12 Colombia 3.61 32 0.785 24 0.997 13 Peru 3.53 37 0.762 28 0.994 14 Brazil 3.88 25 0.792 23 0.986 15 Vietnam 3.68 28 0.704 33 0.975 16 Russian Fed. 3.67 30 0.795 22 0.970 17 Mexico 3.70 27 0.814 21 0.958 18 Pakistan 3.35 42 0.527 39 0.949 19 Spain 4.10 19 0.928 16 0.945 20 Bangladesh 3.20 43 0.520 40 0.943 21 Sweden 4.92 4 0.949 3 0.936 22 Netherlands 4.72 8 0.943 8 0.907 23 Canada 4.66 11 0.949 3 0.906 24 Austria 4.57 14 0.936 13 0.901 25 Turkey 3.62 31 0.750 31 0.889 26 Denmark 4.95 2 0.941 10 0.888 27 Japan 4.79 7 0.943 8 0.881 28 Taiwan 4.72 8 0.897 18 0.875 29 France 4.60 13 0.938 12 0.869 30 Egypt 3.95 23 0.659 35 0.853 31 Korea 4.38 16 0.901 17 0.852 32 Switzerland 4.93 3 0.947 5 0.847 33 Morocco 3.97 22 0.631 37 0.846 34 China 4.20 17 0.755 30 0.842 35 Uganda 3.50 39 0.508 41 0.842 35 Tanzania 3.14 44 0.418 44 0.841 37 Indonesia 3.92 24 0.697 34 0.837 38 Germany 4.86 5 0.930 15 0.832 39 Kenya 3.37 41 0.474 42 0.832 39 Thailand 4.17 18 0.778 25 0.822 41 India 4.07 21 0.602 38 0.795 42 Ethiopia 2.88 45 0.367 45 0.794 43 South Africa 4.08 20 0.658 36 0.768 44 Nigeria 3.53 37 0.453 43 0.733 45
The USA, which has the first rank in WEF Global Competitiveness Index, does not show a similar outstanding performance in human development (7th rank), ranking below Norway, Italy and Argentina. Despite its relatively high economical performance, its relative position in terms of life expectancy and enrollment is moderate (15th and 12th respectively).
4.2. Detailed Analysis for E7 Countries
There has been an increasing focus in recent years on the opportunities and challenges posed by China, India, and other emerging-market economies to the established advanced economies of the US, Europe, and Japan. For this reason, it was decided in this study to analyze the DEA scores of the E7 countries in detail.
When the results of E7 countries given in Table 1 are analyzed, Brazil, Russian Federation, and Mexico are at the top, Turkey in the middle and China, Indonesia, and India are at the bottom according to super-efficiency scores. Interestingly, the countries having the worst super-efficiency scores are the top ranked E7 countries according to WEF score (China, India, and Indonesia), while their HDI rank is at the bottom. This shows that China and India, which are considered as very promising countries in the future, are not currently using their competitive power to increase their human development that includes health, education, and economic aspects.
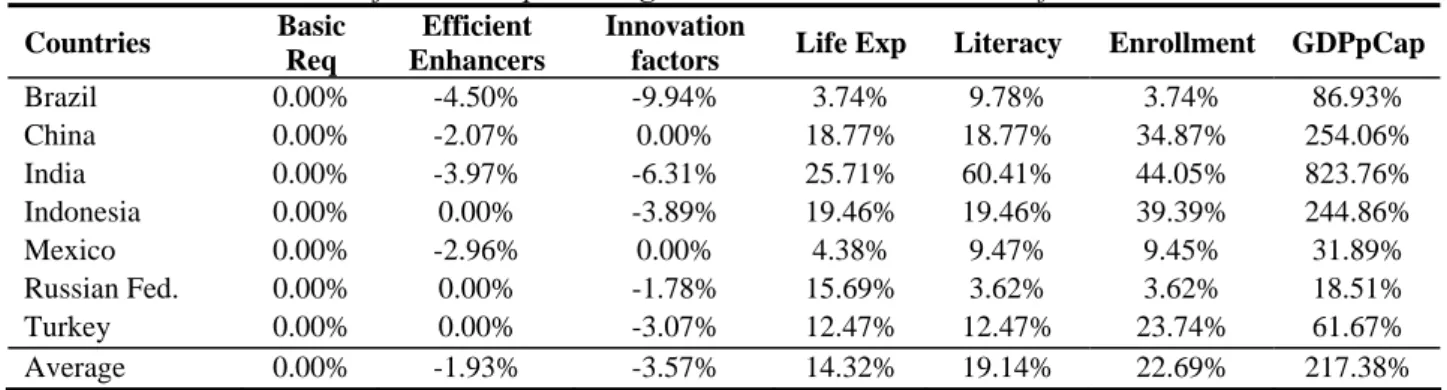
When a projection analysis is conducted for these countries, among the inputs, the basic requirements is seen as the most important input to improve their efficiency scores. The second important input is efficiency enhancers. In fact, it is necessary to underline that China, India, and Indonesia are factor-driven stage countries, Brazil is in transition from factor driven to efficiency driven stage while Mexico, Russian Federation, and Turkey are in efficiency-driven stage countries according to the WEF’s classification. As a result it can be concluded that E7 countries should especially pay attention to the improvement of their institutions, infrastructure, as well as their basic human capital, market efficiencies, technological readiness, and openness of its markets.
Table 2 – Projections as percentage increase wrt current status for E7 Countries
Countries Basic
Req
Efficient Enhancers
Innovation
factors Life Exp Literacy Enrollment GDPpCap
Brazil 0.00% -4.50% -9.94% 3.74% 9.78% 3.74% 86.93% China 0.00% -2.07% 0.00% 18.77% 18.77% 34.87% 254.06% India 0.00% -3.97% -6.31% 25.71% 60.41% 44.05% 823.76% Indonesia 0.00% 0.00% -3.89% 19.46% 19.46% 39.39% 244.86% Mexico 0.00% -2.96% 0.00% 4.38% 9.47% 9.45% 31.89% Russian Fed. 0.00% 0.00% -1.78% 15.69% 3.62% 3.62% 18.51% Turkey 0.00% 0.00% -3.07% 12.47% 12.47% 23.74% 61.67% Average 0.00% -1.93% -3.57% 14.32% 19.14% 22.69% 217.38%
Projections of the outputs, on the other hand, show that E7 countries have a very high potential of increasing their GDP per capita level (217.38% in average). This is followed by the potential of improving their enrollment level (22.69% in average), their literacy level (19.14% in average) and life expectancy level (14.32% in average).
The peer countries for Turkey in DEA analysis were found to be Italy, Poland, and Venezuela. (see Table 3 for the peer countries of E7 countries) When the input and output values of those countries are compared with those of Turkey, it can be seen that although the input values of Venezuela are comparatively very low with respect to Turkey’s, its output value is much higher. On the other hand, although Poland’s input values are approximately the same as Turkey’s, its output level is higher. According to these results, since it would be illogical to expect Turkey to reduce its current competitiveness level, it would be appropriate for Turkey to take Poland as its peer country
in the initial stage and seek to increase its efficiency level using its current input levels. In the next stage, the aim should be to imitate Italy and make a radical improvement in its output levels.
Table 3 – Peer countries of E7 Countries
Country Peer Country
Brazil Poland, United Kingdom Russian Federation Italy, Poland, Venezuela Mexico Italy Turkey Italy, Poland, Venezuela
China Italy, Venezuela
Indonesia Argentina, Poland, Ukraine India Italy, Poland, Venezuela
6. CONCLUSIONS AND FURTHER SUGGESTIONS
In this study, the capability of countries to convert their competitiveness into better lives for their people has been analyzed through a DEA approach. The scores of the WEF related to basic requirements, efficiency enhancers, and innovation and sophistication factors were used as the inputs of the DEA, while the HDI scores were taken as the output. The results of the DEA gave a super-efficiency score for the countries.
In the countries evaluated in this research, the DEA found only 24% of the 45 countries studied to be efficient. The smallest efficiency score belongs to Nigeria and this efficiency score is much lower than that of the other countries.
In this study, the proposed methodology was applied using attribute values for the year 2004 published by the WEF (2005). However, the method can be used to analyze performance over several years using procedures such as window analysis and the Malmquist Productive Index. Further, a times-series analysis of country performance can be carried out to analyze the evolution of countries over the years.
In the applied super-efficiency model all of the four HDI scores are included in the evaluation. However it can be interesting to study other combinations of outputs. Getting each HDI sub-criteria as output may be used to analyze countries’ competitiveness and its use for each dimension of human development (i.e. health, education, economy) separately.
Another improvement on the model may be the specification of the criteria that have the highest impact in determining the super-efficiency score of the countries. Regression analysis and feed forward ANN analysis can be used for this purpose.
REFERENCES
Artto E.W. 1987. Relative total costs-an approach to competitiveness measurement of industries. Management International Review 27, 47-58.
Blanke J., Lopez-Claros A. 2004. The Growth Competitiveness Index: Assessing Countries’ Potential for Sustained Economic Growth. In The Global Competitiveness Report 2004-2005. Oxford University Press for the World Economic Forum, New York
Charnes, A., Cooper, W.W., Rhodes, E., 1978. Measuring the efficiency of decision making units. European Journal of Operational Research, 2(6), 429–444.
Chen, Y. 2004. Ranking efficient units in DEA. Omega, 32, 213-219.
Cooper, W.W., Seiford, L.M. and Tone, K., 2000. Data Envelopment Analysis: A Comprehensive Text with Models, Applications, References and DEA-Solver Software. Kluwer Academic Publishers, Boston
Cubbin, J., Tzanidakis, G 1998. Regression versus data envelopment analysis for efficiency measurement: an application to the England and Wales regulated water industry. Utilities Policy, 7(2), 75-85.
Davies, A., Quinlivan, G. 2006. A Panel Data Analysis on the Impact of Trade on Human Development, Journal of Socio-Economics, 35(5), 868-876.
Despotis, D.K. 2005. Measuring human development via data envelopment analysis: The case of Asia and the Pacific. Omega, 33, 385-390
Dunning, J. H., 1990. The Globalization of Firms and the Competitiveness of Countries'. In: J. H. Dunning, B. Kogut and M. Blomström, (eds), Globalization of Firms and the Competitiveness of Nations Lund University Press. Lund. Dunning, J. H., 1993. The Globalization of Business: The Challenge of the 1990s. London.
Fried, H. O., Lovell, C. A. K., Schmidt, S. S., 1993. The Measurement of Productive Efficiency-Techniques and Applications. Oxford University Press.
Hawksworth, J. 2006. The World in 2050: How big will the major emerging market economies get and how can the OECD compete?. PricewaterhouseCoopers.
Kogut, B., 1988. Country Patterns in International Competition: Appropriability and Oligopolistic Agreement. in Strategies in Global Competition, Eds. N. Hood and J. E. Vahlne, New York: Wiley.
Lall, S. 2001. Competitiveness Indices and Developing Countries: An economic Evaluation of the Global Competitiveness Report. World Development, 29, 1501-1525
Li, S., Jahanshahloo, G.R., Khodabakhshi M. 2006. A super-efficiency model for ranking efficient units in data envelopment analysis. Applied Mathematics and Computation, in press doi:10.1016/j.amc.2006.06.063.
McArthur J.W., Sachs J.D. 2001. The Growth Competitiveness Index: Measuring Technological Advancement and the Stages of Development. In The Global Competitiveness Report 2001-2002. Oxford University Pres for the World Economic Forum, New York
Neumayer, E. 2001. The Human Development Index and Sustainability-A Constructive Proposal. Ecological Economics, 39, 101-114.
Porter M.E. 1990. The Competitive Advantage of Nations. Macmillan, London
Ranis, G., Stewart, F., Ramirez, A. 2000. Economic Growth and Human Development. World Development, 28(2), 197-219.
Retzlaff-Roberts, D., Chang, C.F., Rubin, R.M. 2004. Technical efficiency in the use of health care resources: a comparison of OECD countries. Health Policy, 69(1), 55-72.
Sala-i-Martin X., Artadi E.V. 2004. The Global Competitiveness Index. In The Global Competitiveness Report 2004-2005. Oxford University Press for the World Economic Forum, New York.
Smith, K.A., Gupta, J.N.D., 2000. Neural networks in business: techniques and applications for the operations researcher. Computers & Operations Research, 27, 1023–1044.
Ulengin F., Onsel Sahin, S., Topcu I., Aktas, E., Kabak, O., 2006, A New Perspective in Competitiveness of Nations, EURO XXI, 21st European Conference on Operational Research, 2-5 July 2006, Reykjavik, Iceland, Abstract Book, 84.
UNDP, Human Development Report 1990, box 1.1, New York: Oxford University Pres.
WEF 2005. The Global Competitiveness Report, 2005-2006, September 2005, Palgrave Macmillan.
Zanakis, S.H., Becerra-Fernandez, I. 2005. Competitiveness of nations: a knowledge discovery examination. European Journal of Operational Research, 166(1), 185-211.
http://hdr.undp.org/hd/ http://www.imd.ch
http://www.sd.undp.org/HDR/HDR05e.pdf