Effect of Automation on the Productivity of a Coal Packaging Plant
Mehmet Nuri BAHŞİŞ
1, Yaşar KASAP
*2 1Mining Engineer, Silopi Control Directorate, Şırnak2Dumlupınar University, Faculty of Engineering, Department of Mining Enginering, Kütahya
Abstract
Automation provides direct contribution to a country's economy and inputs to the manufacturing sector, and by means of automation taking place in many areas of mining industry, a safe, economical and efficient production can be realized for the sector in concern. Using the Malmquist index total factor productivity, this manuscript focused on and investigated the change in operational productivity of Western Lignite Corporation (WLC) as a result of the conversion of the packaging plant into a fully automated system. The results indicated that the productivity score would increase by 16.1% due to the conversion of the current system into a fully automated system. The operational productivity is also expected to increase considering the reductions in the amount of energy used, the number of workers employed and the number of production losses.
Keywords: Coal packaging, Automation, Productivity, Malmquist total factor productivity
Kömür Torbalama Tesisi Verimliliğinde Otomasyonunun Etkileri
Öz
Ülke ekonomisine doğrudan yaptığı katkılar, imalat sektörüne sağladığı girdiler nedeniyle büyük öneme sahip olan madencilik sektörünün birçok alanında geliştirilen otomasyonlar ile emniyetli, ekonomik ve verimli üretim gerçekleştirilebilmektedir. Bu çalışmada Garp Linyitleri İşletmesi kömür torbalama tesisinin tam otomatik sisteme dönüştürülmesi neticesinde işletme verimliliğindeki değişim incelenmeye çalışılmıştır. Elde edilen sonuçlara göre torbalama tesisinin, tam otomatik sisteme çevrilmesi ile verimlilik değerinde %16,1’lik bir artış olacağı tespit edilmiştir. Kullanılan enerji miktarlarındaki, çalıştırılan işçi sayılarındaki ve üretim kayıplarındaki azalmalar dikkate alındığında işletme verimliliğinde de artış olacağı düşünülmektedir.
Anahtar Kelimeler: Kömür torbalama, Otomasyon, Verimlilik, Malmquist toplam faktör verimliliği
*Sorumlu yazar (Corresponding author): Yaşar KASAP, [email protected]
1. INTRODUCTION
Since the day human beings came into existence, they have always been in pursuit of new discoveries, worked hard to go one step further regardless of the era they lived in, and, after a certain point, started to seek ways of obtaining more gains with less effort and larger profits with smaller budgets. All the inventions that can be considered as the results of this quest actually make up the concept of automation.
Automation can be described as a process in which tasks in the industrial sector, scientific research and the field of management are performed without human labor by machines. Although the benefits of automation include high performance and job security, low operational cost, more efficient use of space and machinery, organizational convenience, and error-free, high quality and standardized production, there are some disadvantages of automation such as people being replaced by machines, system failure, system complexity, and high investment cost [1].
Due to technological advancements over the last decades, significant changes have occurred in both production (e.g. high production rate, work safety, low operating costs, high quality and standardized products, etc.) and in the structure of labor force. Developments in science and technology and demand for the increase in staff qualifications and the quality of products have given priority to productivity. Productivity involves achieving production in higher quantity and quality with less cost and less equipment. There is a great deal of research on the positive effects of automation on efficiency [2-5].
Efforts to increase productivity primarily involve corporations, which make up the core of the economy of a country, and their production units, which make up the backbone of these corporations. By means of adapting evolving technology to businesses, efforts to increase productivity bring about numerous benefits such as increased production and work safety, and reduced operating cost. There is considerable research on the positive contributions of automation for safe and
economical production thanks to the developments observed in recent years in measurement and control systems related to mining technology [6-10].
With the use of advanced technology in the mining sector, large capacity excavators and draglines are now used in open-pit mining. Conveyor belts in thousands of kilometers in length are an indispensable means of transport in open-pit mining. Giant trucks are used for transportation where conveyor belts are not used. The use of fully mechanized production systems in underground mining applications is increasing day by day. For example, plow or drum cutter-loaders are now used for excavation, shield support are used for fortification, and chain and belt conveyors are used as a means of effective and efficient transport in underground mining. Almost all of these ground and underground tasks can be operated automatically or remotely [11].
U.S. National Institute of Standards and Technology has been working on mining automation systems in the Department of Robotic Systems. Their system project involves continuous observation in underground mining, the use of machines remotely, performing various measurements, management of production, productivity and fortifications. The best example of automation in surface mining is expert system guided automated truck system. With this system, loading, transportation and unloading operations are performed without human intervention. An intelligent drilling machine based on artificial intelligence, which was developed to be used in gas and oil searches, detects all the parameters depending on the drilled environment, uses drilling machine automatically, instantly measure the wear occurring in drill bits, and gives information about the cost of drilling.
More importantly, high-tech applications can improve workers’ health and safety in the mining sector, which has always had the worst working safety conditions [11].
The aim of this study is to investigate the change in operational productivity of Western Lignite
Corporation (WLC) as a result of the conversion of the packaging plant into a fully automated system by using the Malmquist index total factor productivity. Approximately 85% of the lignite production in WLC is from opencasts and 15% is from underground mining plants. The annual production capacity is about 6.3 million tons, and 1 million tons of this amount is from underground production. This study aims to estimate the effect of the conversion of the current packaging plant into a fully automated system on productivity changes and operational productivity.
2. METHODOLOGY
Parametric efficiency measurements assume that the production functions of fully efficient units are known. Since the production function is never known in practice, Farrell [12] suggested that the function can be estimated from sample data. The first proposal was evaluated by Charnes, et all. [13].
The first step in nonparametric approach to measurement of efficiency, which is used for comparative efficiency analysis, is to determine enveloped surfaces (efficient frontier) that cover the linear combinations and efficient observations of the decision making units (DMU) which carry out the same production activities. Then the efficiency scores and radial distances (from the center) of inefficient units within the enveloped surface are calculated [14].
In order to calculate the Technical Efficiency (TE) for kth DMU (the decision making unit in question), the following linear programming model is used. k min (1) rk Y rj s rj Y n j j 1 (r = 1,2,....,s), (2) ik X k ij s ij X n j j 1 (i=1,2,....,m) (3) 0 , ,sij srj j (j=1,2,....,n). (4)
In the model that is established for efficiency measurement to be performed under input minimization, the objective is to keep outputs constant but inputs at a minimum level (Equation 1).
Equation 2 sets involve comparison of the outputs kept constant in DEA (Data Envelopment Analysis) carried out under input minimization. With this constraint, rth output of each j DMU will not be greater than the maximum linear combination of the units constituting the efficient frontier. The constraints where minimization is sought for the inputs in inefficient DMUs are shown in the Equation 3. Equation 4 represents the constraints to be non negative [15].
In order for a DMU to be considered efficient, optimal
k has to be equal to 1 all slack variable scores have to be zero (sik,srk 0).
The symbols used in the formulation of non-parametric linear programming are defined below:
n the number of decision-making units involved
in comparison,
s the number of outputs gained from the
production,
m the number of inputs used in the production, j = (1,2,….,n) set of all decision-making units,
k = (1,2,….,n) set of decision-making units
taken into consideration,
r = (1,2,….,s) set of all outputs, i = (1,2,….,m) set of all inputs,
y R+s vector of outputs (y1, y2,…,ys) = sn x R+
λ the vector of density variables giving inputs-outputs weight averages = k1
jk the relative (compared to other units, j) weight
value of “k” decision unit measured for efficiency in input-oriented,
k the scaler variable (efficiency score) trying to
decrease all inputs of k DMU, which is considered to obtain the best frontier,
Yrj the rth output amount produced by decision unit
j,
Yrk the rth output amount produced by decision unit
k,
Xij the ith input amount used by decision unit j,
Xik the ith input amount used by decision unit k,
As a form of static analysis, Data Envelopment Analysis performs analyses using data from decision making units in a single period. However, a decision making unit which was identified to be efficient before may lose its efficiency and reference quality. In this respect, in efficiency evaluation process, the MPI (Malmquist Total Factor Productivity Index) was developed to examine the changes that may occur over time. The MPI, which was obtained by adding the functions of distance to the Farrell [12] measure of technical efficiency, measures the variation in two units’ total factor productivities as the proportion of the distances from a common technology. Distance function is used to define multi-input and multi-output production technologies without specifying objectives such as cost minimization or profit maximization. The input distance function considers a production technology by looking at a minimal proportional contraction of input vector, given an output vector, while the output distance function characterizes it a maximal proportional expansion of the output vector, given an input vector [16]. This study used the output distance function because it was suitable for the analysis which was conducted to investigate the efficiency changes of the decision making units in the considered years [12,16].
Grifell-Tatje and Lovell [17] showed that using the assumption of variable returns to scale when calculating the distance functions required for MPI (Malmquist Total Factor Productivity Index) would not accurately measure the changes (gain or loss of productivity) in Total Factor Productivity (TFP) index. For this reason, the index needs to be calculated under the assumption of constant returns to scale [17].
Input based analysis is appropriate since the production of coal bagging plants is made according to the demand of the production market. The input distance function is
max θ:(x,y) L y y x, i D (5)If y vector is an element of the possible production set of L(y) efficient frontier, the distance function Di(x,y) will have a value smaller than or equal to one. According to the input between t period and the subsequent (t+1) period and within the framework of distance function, MPI is calculated as
t t 1 t 1 t 1 t 1 t 1 D yi , x Di y , x MPI t t t t 1 t t D y , xi Di y , x (6) where (x,y) iD represents the distance of t period to t+1 period technology. An MPI value greater than 1 indicates that there is an expansion of total factor productivity from t period to t+1 period while an MPI value smaller than 1 shows a contraction in total factor productivity [18].
MPI considers changes in productivity according to two separate components: technical efficiency change and technological change. Technical efficiency change (TE) provides an assessment of the process in which decision-making units approach the efficient frontier whereas technological change (TC) provides the change of the efficient frontier over time [17,19].
When Equation (6) is revised,
t x , t y 1 t i D t x , t y t i D 1 t x , 1 t y 1 t i D 1 t x , 1 t y t i D t x , t y t i D 1 t x , 1 t y 1 t i D MPI (7)where the ratio outside the square brackets measures the change in the output-oriented measure of Farrell technical efficiency between periods t and t+1. In other words, the efficiency change is equivalent to the ratio of the technical efficiency in period t+1 to the technical efficiency in period t. The remaining part of the index in Equation 7 is a measure of technical change. It is the geometric mean of the shift in technology between the two periods, evaluated at xt+1 and also at xt [16].
MPI = TE TC (8)
Non-parametric linear programming method is the most popular method which is used to estimate the distance functions that are required to form MPI. When there is a suitable panel data set, the required distances can be calculated by using non-parametric linear programs by means of this method. Four distance functions must be calculated to measure the changes TFP between the two periods for any ith input and this requires the solution of four Linear Programming (LP) problems. The LPs required under the assumption of constant returns to scale are
t 1
1 j y , 1 t j x 1 t i D 0 1 t jk λ 1 t ij x 1 t ij x n 1 j 1 t jk λ k .θ 1 t rk y n 1 j 1 t rj y 1 t jk λ k maxθ (9)
t
1 j y , t j x t i D 0 t jk λ t ij x t ij x n 1 j t jk λ k .θ t rk y n 1 j t rj y t jk λ k maxθ (10)
t
1 j y , t j x 1 t i D 0 1 t jk λ t ij x 1 t ij x n 1 j 1 t jk λ k .θ t rk y n 1 j 1 t rj y 1 t jk λ k maxθ (11)
t 1
1 j y , 1 t j x t i D 0 t jk λ 1 t ij x t ij x n 1 j t jk λ k .θ 1 t rk y n 1 j t rj y t jk λ k maxθ (12)Determining these defined distance values by using Equations 9-12 for all time periods and years requires the solution of n
3t2
, where n represents the number DMUs and t shows the number of periods, linear programming models [18]. Since there were 2 parameters analyzed and 12 months (as periods of time) in this study, a total of 68 linear programming models were solved so that the analyses could be carried out.3. APPLICATION
There are three packaging plants in WLC. Currently, however, only Tunçbilek plant is used because the capacity of Tunçbilek packaging plant is already compatible with the amount of production.
The plant offers pure and dust-free products to customers by washing the run of mine coal coming from the WLC casts in the coal washing plants and packaging it.
The coal 18-100 mm in size is weighed in the amount of 25 kg by the electronic scales. When the coal in a scale reaches 25 kg, the coal is poured from the scale into the filling reducer. After a worker places an empty coal bag to the reducer, the coal in the scale is poured into the reducer by means of a switch and, from here, it is filled into the empty coal bag.
(TC) (TE)
It takes approximately 12 seconds for a reducer to fill a coal bag. In order to increase production, there are two scales mounted on each coal-filling reducer. When the worker responsible for the coal-filling reducers unloads the coal in one of the scales into an empty coal bag by means a reducer, the other scale is loaded with coal. This increases coal-filling rate.
The bags loaded with coal are sent to the sewing belt and a worker sews these bags with a sewing machine. After that, the bags are loaded to trucks through the loading line.
There are currently 24 coal filling reduction and 24 sewing machines in the WLC Coal Packaging Unit, which requires assigning 48 workers. Together with these 48 workers, there should be a total of 80 workers in a shift including eight loaders, four cleaners, three electricians, two welders, four maintenance workers, one technician, one shift superintendent, four truck drivers, 2 loader operators, one sweeper operator, one shunter, and sewing machine worker. Therefore, the unit needs a total of 240 workers for the three shifts in a day. On the other hand, there could also be variations in the coal filling reduction, which is operated according to the daily demand for bagged coal. This consequently causes a change in the number of workers in the plant at a specific time.
The amount of electric power used in the coal packaging units depends on production and, therefore, energy consumption increases depending on the number of units that are run when the amount of bagged coal increases.
Thanks to the advances in technology and automation, fully automated packaging systems could bring about significant benefits in all sectors as well as mining industry in terms of increasing efficiency. Fully automated packaging systems can be used in packaging materials such as agricultural materials (e.g. seeds, beans, grains, corn, grass seed, and organic pellet fertilizer), food (e.g. wheat, corn, rice, cereals, semolina, wheat flour, sugar, salt, and coffee), fodder (e.g. animal feed),
inorganic fertilizers (e.g. urea and rock phosphate), petrochemicals (e.g. plastic granules, resin powder, etc.), building materials (e.g. sand and gravel), and fuel (e.g. coal and wood pellets). The primary objective of fully automated packaging systems is to increase efficiency by achieving high-speed production (i.e. 30 bags per minute) and reducing losses occurring due to low production [20]. In this study, the authors analyzed the data about the cost and production of a fully automated packaging plant designed for a sugar factory in Turkey. They found based on this data that the cost of a fully automated coal packaging system to be built for WLC would be lower than the cost of the current coal packaging system in the last two years (WLC has been paying contractors for coal packaging since 2004).
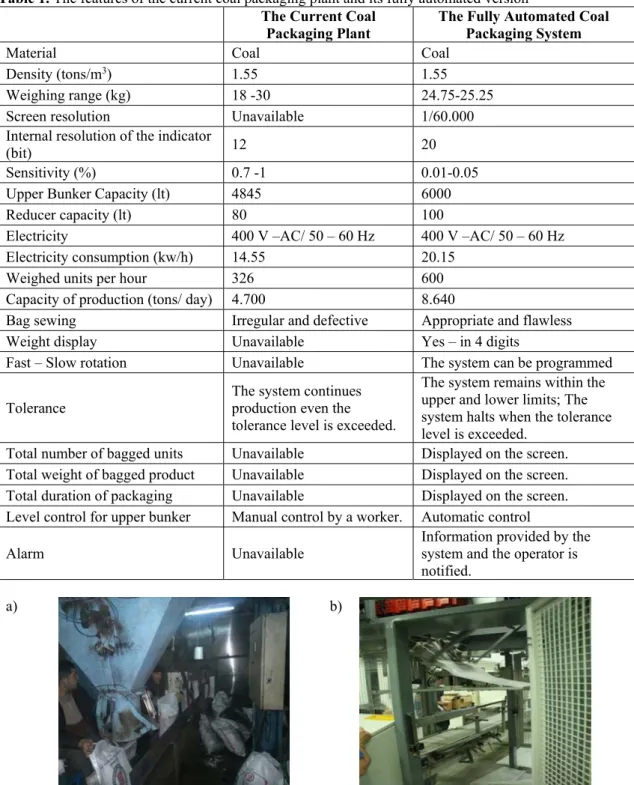
The fully automated packaging system described in Table 1 is capable of automatically weighing (25 kg) the coal fed to the unit bunker from the crusher and then feeding it to the production reducer. The vacuum arms of the machine automatically receive the bags in the bunker and insert them in the filling reducer. After the bags are filled with coal and transferred to the sewing belt, two mechanical arms take them to the sewing machine. After they are sewn, they are loaded onto trucks by means of the loading belt. Figure 1, Figure 2, and Figure 3 show pictures taken during bag placing, bag filling and bag sewing processes for the current system against the fully automated system.
The fully automated version of the bagging unit does not require any staff for the processes. However, about 10 workers per shift are needed for cleaning the unit and for placing new empty bags to the bag container. Therefore, a total of 30 workers will be needed because the corporation operates on three shifts. In the current system, the total number of employees varies between 38 and 238 depending on the demand for coal. Therefore, the fully automated version of the bagging unit will reduce the cost of labor, which is the largest item among the inputs, by 80%.
Table 1. The features of the current coal packaging plant and its fully automated version The Current Coal
Packaging Plant The Fully Automated Coal Packaging System
Material Coal Coal
Density (tons/m3) 1.55 1.55
Weighing range (kg) 18 -30 24.75-25.25
Screen resolution Unavailable 1/60.000
Internal resolution of the indicator
(bit) 12 20
Sensitivity (%) 0.7 -1 0.01-0.05
Upper Bunker Capacity (lt) 4845 6000
Reducer capacity (lt) 80 100
Electricity 400 V –AC/ 50 – 60 Hz 400 V –AC/ 50 – 60 Hz Electricity consumption (kw/h) 14.55 20.15
Weighed units per hour 326 600
Capacity of production (tons/ day) 4.700 8.640
Bag sewing Irregular and defective Appropriate and flawless
Weight display Unavailable Yes – in 4 digits
Fast – Slow rotation Unavailable The system can be programmed
Tolerance The system continues production even the tolerance level is exceeded.
The system remains within the upper and lower limits; The system halts when the tolerance level is exceeded.
Total number of bagged units Unavailable Displayed on the screen. Total weight of bagged product Unavailable Displayed on the screen. Total duration of packaging Unavailable Displayed on the screen. Level control for upper bunker Manual control by a worker. Automatic control
Alarm Unavailable Information provided by the system and the operator is notified.
a) b)
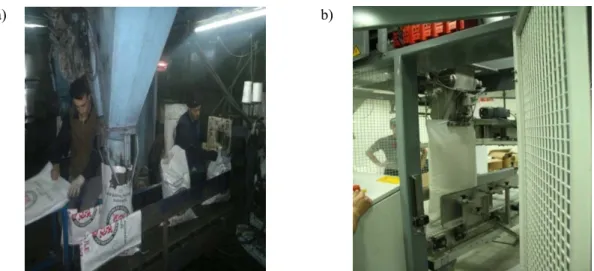
Figure 1. a) Bag placing process in the current packaging plant. b) Bag placing process in the fully automated system
a) b)
Figure 2. a) Bag filling process in the current packaging plant. b) Bag filling process in the fully automated system
a) b)
Figure 3. a) Bag sewing process in the current packaging plant. b) Bag sewing process in the fully automated system
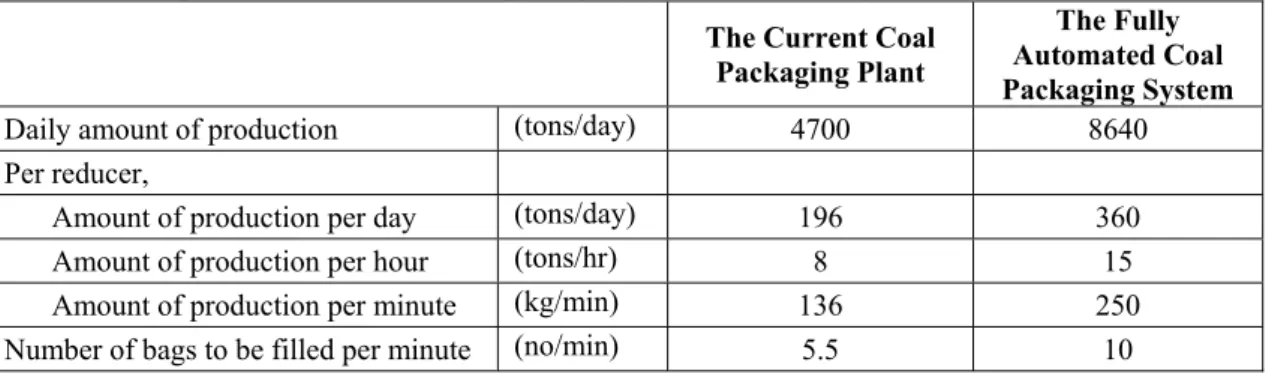
The maximum possible quantity of production performed by the 24 production reducers in the current coal bagging plant is 4700 ton/day. The amount of production in a production reducer is 196 tons per day (4700/24) and 8.1597 tons per hour (196/24). This amount of production is equal to 136 kg/min (81597/60). Because each coal bag
is 25 kg, 5-6 coal bags can be prepared per minute (136/25).
In the proposed fully automated version of the bagging system, on the other hand, 10 bags of coal can be produced in a reducer per minute. The amount of production in a production reducer will
be about 250 kg per minute (25 × 10) and approximately 15 tons per hour (60 × 250).
Because there are 24 production reducers in the unit, hourly production will be 360 tons and daily
production will be 8640 tons. This results in an increase in the production capacity by 83.8% (Table 2).
Table 2. The capacities of the current coal packaging system and the fully automated version The Current Coal
Packaging Plant
The Fully Automated Coal Packaging System
Daily amount of production (tons/day) 4700 8640
Per reducer,
Amount of production per day (tons/day) 196 360
Amount of production per hour (tons/hr) 8 15
Amount of production per minute (kg/min) 136 250
Number of bags to be filled per minute (no/min) 5.5 10
It is estimated that the amount of production realized in 24 hours in the current coal packaging plant could be realized in 13 hours in the fully automated version of the system. In terms of the amount of energy used in the unit, there will be a reduction in the daily amount of energy used by approximately 46%, which is expected to improve the energy efficiency of the corporation.
3.1. Data Used in Analysis
Although fully automated packaging systems are used in many industries, our country does not have such a system in the coal industry. The authors analyzed the data about the cost and production of a fully automated packaging plant designed for a sugar factory in Turkey to estimate the possible changes in the productivity of the current coal packaging system of WLC.
The productivity of the current packaging plant and the fully automated packaging system was analyzed using the Malmquist TFP based on the data from the year 2012. In this analysis, the decision-making units (DMUs) considered were the current packaging plant and the fully automated packaging system. The periods of time taken into consideration were the 12 months of 2012 (January, …, December). In the current
packaging plant, there are losses of coal production occurring due to improperly sewn, or torn or incorrectly loaded coal bags. However, it is estimated that there will be little or no losses of production in the fully automated packaging system.
The amount of coal fed to the packaging units, the number of workers hired in the packaging units, and the amount of energy used in the packaging units were considered as the inputs, and the amount of bags of coal that were produced was considered as the output.
While outputs can be kept constant in order to increase productivity in the non-parametric efficiency analysis, inputs can be kept constant in order to increase outputs as well. Although the Malmquist TFP index examines the efficiency changes of DMUs without input minimization or output maximization, because it is based on the non-parametric efficiency analysis, an increase in productivity is possible by reducing the amount of the coal fed to the plant, which is considered as an input. However, reducing the amount of the coal fed to the plant is not option so that the plant can operate at full capacity. Determining the inputs that are compatible with the structure of the models used is critical for obtaining accurate
results. For this reason, the amount of coal that is fed to the plant were negated (1/The Amount of the Coal Fed) and included in the analysis.
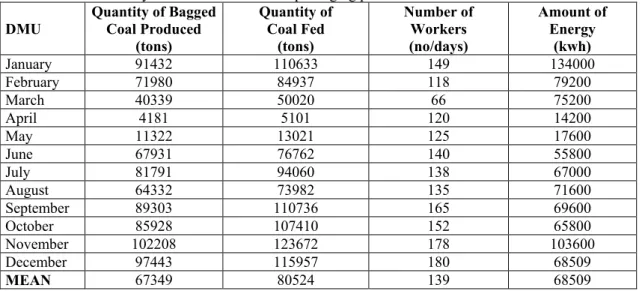
Table 3 shows the data from the year 2012 for the current packaging plant.
Table 3. Data from the year 2012 for the current packaging plant DMU Quantity of Bagged Coal Produced (tons) Quantity of Coal Fed (tons) Number of Workers (no/days) Amount of Energy (kwh) January 91432 110633 149 134000 February 71980 84937 118 79200 March 40339 50020 66 75200 April 4181 5101 120 14200 May 11322 13021 125 17600 June 67931 76762 140 55800 July 81791 94060 138 67000 August 64332 73982 135 71600 September 89303 110736 165 69600 October 85928 107410 152 65800 November 102208 123672 178 103600 December 97443 115957 180 68509 MEAN 67349 80524 139 68509
The proposed fully automated coal packaging system will perform production according to the demand per unit of time and it will stop automatically when the demand is met. Therefore, there will a reduction in energy consumption. What is more, there will no longer be a need for hiring a large labor force to operate the unit and the unit will be operated with a total of 25 workers per day. In the current system, the number of workers could vary depending on the demand (Table 4). A maximum level of production will be achieved along with decreasing amount of energy and the number of workers. It will be possible to
simultaneously run the 24 coal filling reducers and to realize production during 24 hours of the day. The current circumstances require that tasks should be organized in advance and the workers to be hired for each of the coal filling reducers (e.g. filling workers, sewing machine workers, and loaders) need to be provided with clearly described tasks. In addition, it is impossible for these workers to work non-stop for 8 hours in a shift. These workers can work for 6.5-7 hours due to reasons such as changing shifts, lunch break, and so on.
Table 4. The amount of energy to be consumed by the fully automated coal packaging system in the year 2012
Task Amount of the Energy to be Consumed (kwh)
Activating Bunker Upper Belt 1.50
Running Bunker Upper Belt 4.00
Bunker Feeding Belt 7.50
Automated Coal Packaging 20.15
Total Amount of Energy to Be Used in One Unit 33.15 Total Amount of Energy to Be Used in Three Units 99.45 Amount of Energy to Be Used Daily 2386.80
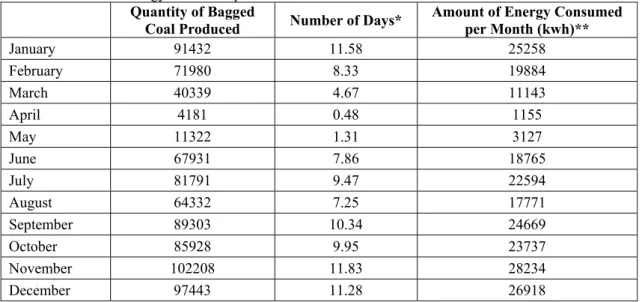
Table 5. Amount of energy consumed per month in 2012 Quantity of Bagged
Coal Produced Number of Days* Amount of Energy Consumed per Month (kwh)**
January 91432 11.58 25258 February 71980 8.33 19884 March 40339 4.67 11143 April 4181 0.48 1155 May 11322 1.31 3127 June 67931 7.86 18765 July 81791 9.47 22594 August 64332 7.25 17771 September 89303 10.34 24669 October 85928 9.95 23737 November 102208 11.83 28234 December 97443 11.28 26918
* Number of Days When Coal is Produced in the Corresponding Month = Quantity of Bagged Coal Produced /8640 (daily amount of production)
** Amount of Energy Consumed per Month = 2386.8 (amount of energy consumed per day) × Number of Days
Among the data taken into consideration, the amount of coal produced and the amount of coal fed were considered equal because the fully automated packaging system is expected to have no coal losses. In such a system, it is estimated that the unit will operate with 25 employees on a daily average since the systems operates in only one shift per day in February, March, and April due to the low coal demand in these months and production is performed in three shifts per day depending on demand during the other months. The amount of energy that would have been consumed is calculated according to the amount of the coal fed (the amount of the bagged coal produced) and shown in Table 5 and Table 6. 3.2. Productivity Change in the Packaging
System
The sets and parameters used in the efficiency analyses are defined below:
n coal packaging units (the current plant and the
proposed fully automated system),
s the number of outputs gained from the
production (the quantity of bagged coal produced in the packaging units),
m the number of inputs used in the production
(the quantity of coal fed to the packaging units, the number of workers in the packaging units, the amount of energy used in the packaging units),
k {1,2} set of decision-making units taken into consideration,
j {1,2} set of all decision-making units,
r {1} set of all outputs, i {1,2,3} set of all inputs,
t 12 months in a year (January, February, …….,
December)
The productivity change of the packaging systems was evaluated using the Malmquist TFP index. DEAP 2.1 was used in the analyses.
Data from the fully automated coal packaging system given in Table 6 and data from the current coal packaging unit given in Table 3 for the year 2012 were compared and contrasted on a monthly
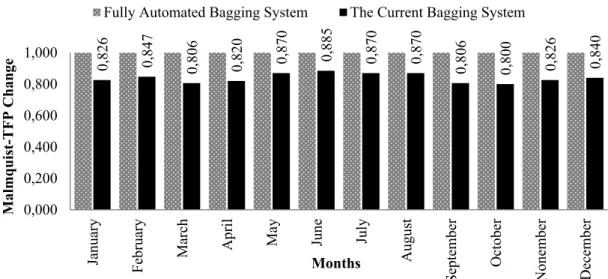
basis using the Malmquist total factor productivity method. Figure 4 shows the results obtained. The productivity score was expected to be high considering the fact that there would not be any variation in the number of workers as coal packaging would be performed by machines in the fully automated packaging system, less energy would be consumed as equipment compatible with the amount of coal would be utilized, and there would not be any production losses in this system. In fact, in comparison with the fully automated coal packaging system, the mean efficiency scores of the current system was calculated as 83.9%. The coal losses during the packaging process, the number of extra workers, and overconsumption of energy could be effective on this inefficiency. Conversion of the current GCL packaging plant into a fully automated system is expected to cause an increase in productivity by 16.1%. Considering the reductions in the energy consumption, the number of workers hired, and the losses in bagged
coal production in the unit, as well as in the entire facility, the overall operational productivity of the corporation will be improved as well. On the other hand, more comprehensive research is required to be able to clearly identify the increase ratio in the operational productivity of the corporation. In this study, it was not possible to determine the increase ratio in the operational productivity of the corporation because WLC has been paying contractors for coal packaging process since 2004, there was not enough reliable data at the time of this study, and there was not a team of researchers capable of conducting a comprehensive study on this issue. However, when we compare the cost of hiring contractors for the coal packaging process to the cost of establishing a fully automated coal packaging system, and we consider the positive effect of the fully automated version, we can clearly suggest that the proposed fully automated system will make a positive contribution to the operational productivity of the entire corporation.
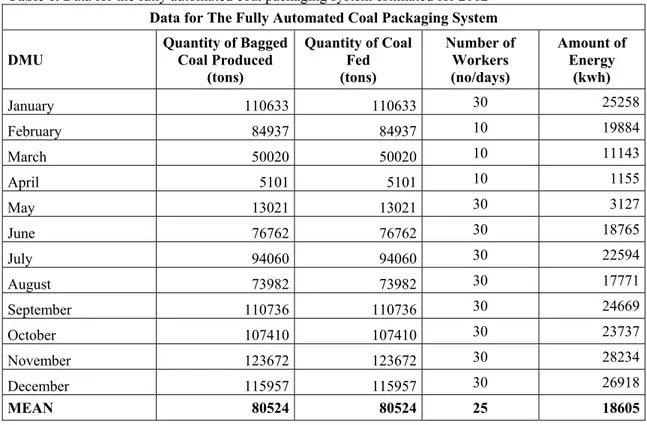
Table 6. Data for the fully automated coal packaging system estimated for 2012 Data for The Fully Automated Coal Packaging System
DMU Quantity of Bagged Coal Produced
(tons) Quantity of Coal Fed (tons) Number of Workers (no/days) Amount of Energy (kwh) January 110633 110633 30 25258 February 84937 84937 10 19884 March 50020 50020 10 11143 April 5101 5101 10 1155 May 13021 13021 30 3127 June 76762 76762 30 18765 July 94060 94060 30 22594 August 73982 73982 30 17771 September 110736 110736 30 24669 October 107410 107410 30 23737 November 123672 123672 30 28234 December 115957 115957 30 26918 MEAN 80524 80524 25 18605
Figure 4. Efficiency comparison of the current coal packaging unit and the fully automated coal packaging system for the year 2012
4. CONCLUSION AND RECOMMENDATIONS
In order to be able to run the companies in the mining sector with modern facilities, low cost and high efficiency, existing operational processes must be automated professionally and the technology used must respond to the highest standards.
Considering the fact that every sector needs labor with peculiar qualifications, particularly the decline in lignite mining has a negative impact on the trained and experienced work force demanded by the mining sector. The WLC coal packaging plant has been producing bagged coal since the 2000s. Currently the plant, which was designed according to the technology back then, requires too much labor and the plant consumes too much energy because it is required to be running even when there is no production. Also, there are inevitable production losses because the plant cannot have enough qualified workers when necessary as a result of hiring workers depending on the demand for coal in certain periods.
An efficient staff policy and dealing with the problems of the staff efficiently would play a key
role in increasing the productivity of the plant. However, it seems currently unlikely to develop an efficient staff policy as the coal packaging plant does not hire a constant number of workers, workers are hired depending on the need at a specific time, and there is not sufficient qualified labor in general. The production capacity of the current WLC packaging plant is 6000 tons/day. On the other hand, an analysis of data regarding the period between the years 2006 and 2012 reveals that the coal packaging units have never operated at full capacity due to insufficient qualified labor force.
The study found that the maximum possible quantity of production would be 4700 tons/day provided that the packaging units were run 24 hours a day with all of their equipment. This value indicates that the plant operates approximately at 75% productivity. In fact, 28 conveyor belts, three vibrating screens, and three roll crushers are active even when there is no production. Also, their depreciation expenses should be taken into consideration as well as the energy they consume.
This study investigated the productivity changes due to the conversion of the current coal packaging
0,826 0,847 0,806 0,820 0,870 0,885 0,870 0,870 0,806 0,800 0,826 0,840 0,000 0,200 0,400 0,600 0,800 1,000 January Febr uary Mar ch Ap ri l
May June July
Au gust September Oct ober No nember December Malmquist-TFP Change Months
plant into a fully automated packaging system with respect to the positive effects of automation on productivity. The analyses were carried out under the assumption that the number of workers to be hired in the fully automated packaging system will be constant every year and in every month of the year, energy will be consumed as long as there is a packaging process ongoing, and the system will be free of production losses. The results revealed that while the fully automated packaging plant would achieve full efficiency (100%), the average efficiency of the current packaging plant was 83.9%. The productivity score of the plant, and of the entire corporation therefore, is expected to be high considering the fact that there will not be any variation in the number of workers, less energy will be consumed, and there will not be any production losses in this system.
More comprehensive research is needed to be able to clearly identify the increase ratio in the operational productivity of the corporation. Future studies to be conducted by appropriate teams of researchers can accurately collect data about each of the units of the corporation and definitely determine the effect of a fully automated coal packaging plant on the operational productivity of the entire corporation.
5. ACKNOWLEDGEMENT
We would like to acknowledge Western Lignites Corporation Directory for their invaluable support for this study.
6. REFERENCES
1. CMEKS Endüstriyel Kontrol Sistemleri San. Ve Tic. Ltd. Şti., Otomasyon Nedir?, www.cmeks.com/otomasyon-nedir,
02.05.2013, 2012
2. Alexander, JR., 1985. Productivity Through Automation, Telematics and Informatics, 141-149.
3. Hutchinson G., Nalk B., 1991. Pflughoeft K., Productivity of Programmable Automation A Simulation-Based Analysis of a Robotic
System for Component Insertion, Journal of Manufacturing Systems, 146-157.
4. Rosenfeld, Y., Shapira, A., 1998. Automation of Existing Tower Cranes: Economic and Technological Feasibility, Automation in Construction, 285–298.
5. Pullig, J., Maxham G., Joseph F., Hair, JR., 2002. Salesforce Automation Systems an Exploratory Examination of Organizational Factors Associated with Effective Implementation and Salesforce Productivity, Journal of Business Research , 401–415.
6. Surrey, J., 1992. Technical Change and Productivity Growth in the British Coal Industry, 1974-1990, Technovation. 12(1), 15-39.
7. Plessmann, K.W., Dlckhaus B., Scheytt S., 1993. A System for the Automation of Mining Machines, Control Eng. Practice, 1(3), 457-462.
8. Couch, G. 1996. Coal Preparation-Automation and Control, Fuel and Energy Abstracts, 37(3), 172-172(1)
9. Jamsa-Jounela, S.L., 2001. Current Status and Future Trends in the Automation of Mineral and Metal Processing, Control Engineering Practic, 1021–1035
10. Feng Q., Chen H., 2013. The Safety-level Gap Between China and the US in View of the Interaction Between Coal Production and Safety Management, Safety Science, 80–86. 11. Kızıl, M.S., Kızıl, G., Tatar, Ç., Köse, H.,
1995. Madencilikte İleri Teknolojinin Kullanımı, Madencilik, Maden Mühendisleri Odası.
12. Farrel, M.J., 1957. The Measurement of Productivity Efficiency, Journal of The Royal Statistical Society, 120, 253-290.
13. Charnes, A., Cooper, W., Rhodes, E., 1978. Measuring the Efficiency of Decision Making Units European Journal of Operational Research, 2(6), 29-444.
14. Muniz, M.A., 2002. Separating Managerial Inefficiency and External Conditions in Data Envelopment Analysis, European Journal of Operational Research, 143, 625-643.
15. Kasap, Y., 2008. Türkiye Kömür Madenciliğinde Etkinlik ve Verimlilik Gelişimi: Veri Zarflama Analizi.
16. Coelli, T.J., Rao, D.S.P., G.E., Battese, 1998. An Introduction to Efficiency and Productivity
Analysis, Kluwer, Boston, http://books.google.com.
17. Grifell, T., Lovell, C.A.K, 1995. A Note on the Malmquist Productivity Index, Economics Letters, 47, 169–175.
18. Färe, R., Grosskopf, S., Lovell, C.A.K. 1994. Production Frontiers. New York and Cambridge: Cambridge University Press.
19. Mahadevan, R., 2002. A DEA Approach to Understanding the Productivity Growth of Malaysia’s Manufacturing Industries, Asia Pacific Journal of Management, 19, 587-600. 20. IMECO, Electronic Twin Weighing Hopper
Process Weigher,
www.imeco.org/products/bulk-weighers/cse, 07.05.2013.