HARMONIC CANTILEVERS FOR NANOMECHANICAL SENSING OF ELASTIC
PROPERTIES
0. Shin''), G. Yaralioglu"', R. Grow"', S. F. Zappe(i', A. Atalar'", C . Quate"' and 0. Solgaard'" (I' E. L. Ginzton Laboratory, Stanford University, Califomia 94305-4085
e-mail: [email protected]
'T'
Bilkent University, Ankara, 06533 TurkeyABSTRACT
We present a micromachined scanning probe cantilever, in which a specific higher order flexural mode is designed to be resonant at an exact integer multiple of the fundamental resonance frequency. We have demonstrated that such cantilevers enable sensing of nonlinear mechanical interactions between the atomically sharp tip at the free end of the cantilever and a surface with unknown mechanical properties in tapping-mode atomic force microscopy.
INTRODUCTION
Atomic force microscope (AFM) has proven to be an exceptionally useful tool for mapping the topography
of surfaces at the nanoscale. I n an AFM, a flexible cantilever with an atomically sharp tip is brought to the vicinity of a sample surface and the deflections of the cantilever as a result of the attractive and repulsive forces between the tip and the sample are monitored while the cantilever is scanned across the surface.
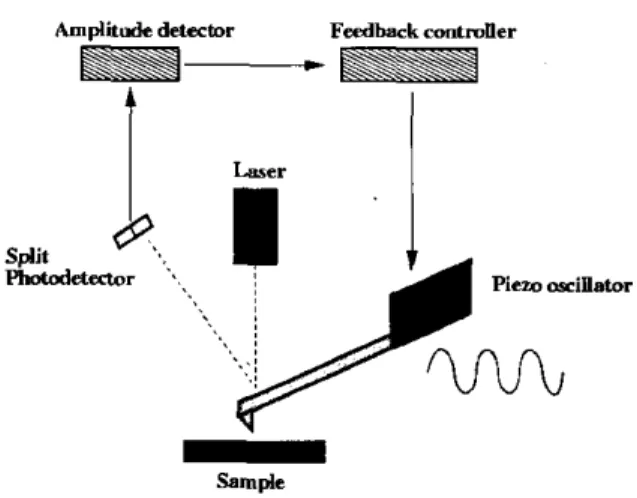
The earliest AFM imaging tecliniques required continuous contact between the tip and sample, which resulted in frictional forces that damage both the tip and the sample. To overcome this issue, dynamic imaging techniques that do not require continuous tip-sample contact have been introduced. Among these, tapping- mode atomic force microscope (TM-AFM) has become the most widely used. In TM-AFM (Fig. l), the cantilever is vibrated at
a
frequency close to one of its flexural resonances in vicinity of the surface under test so that the tip makes intermittent contacts (tapping) with the surface once in every oscillation period. During the scan across the surface, the amplitude of vibration is maintained at a constant value through a feedback loop that adjusts the height of the cantilever base.The
feedback signal therefore reflects the topography of the surface.Apart from high-resolution topography imaging, there has been a great deal of interest in using AFM as a tool to probe the hardness and elasticity at the nanoscale. Imaging of elastic properties enables detection of variations in chemical composition across the surface, characterization of thin films, and studies of nanomechanical structures in general. With an AFM one can measure the contact stiffness between the nano-tip and the sample, which is
a
measure of the elasticity of the material in the vicinity of the contact [1-4]. To our best knowledge, the proposed techniques so far requirecontinuous tip-sample contact and therefore, they pose the same problems with the contact-mode imaging. Such techniques are not suitable for imaging soft samples like biological samples and polymers. The systems that have been demonstrated also have not achieved sufficient sensitivity for practical imaging.
sample
Figure 1. Schematic of tapping mode operation. A cantilever with a lip is vibrated with a piezo-element and its deflection amplitude is monitored and kept constant with an optical lever detection system and a feedback controller.
Studies of cantilever dynamics in TM-AFM have shown that the vibration spectrum of tapping cantilevers exhibit peaks at integer multiples (higher harmonics) of the excitation frequency [ 5 ] . These harmonics are generated by the nonlinearity of the tip-sample interaction and cany information about the mechanical properties o f the sample on a nanometer spatial scale. Imaging with these higher harmonics has been demonstrated and the result has shown good contrast based on material properties [6]. Unfortunately, the vibration amplitudes of traditional AFM cantilevers at higher harmonics are too small for practical AFM imaging [7]. Here we report
a
new micromachined cantilever, the harmonic cantilever, which will enable practical and non-destructive measurement of elasticity on both soft and hard samples with a good accuracy by enhancing the non-linear energy transfer to higher harmonics in TM-AFM.THEORY
In TM-AFM the cantilever is vibrated at its fundamental resonance frequency with sufficiently large
TRANSDUCERS '03
The 12th lnlernationai Conference on Salid State Sensors Actuators and Micmsystems, eosmn, June 8 - l Z . 2003
383.5
amplitudes (10-100
nm)
to avoid sticking. The distance between the sample surface and the rest position of the tip is kept shorter than the free vibration amplitude so that tip hits the surface once every period. Therefore, the amplitude of the cantilever vibration is reduced to the tip- sample separation. The duration of the intermittent contacts can be as long as 15 % of the oscillation period, depending on the hardness of the sample. On softer samples tip can indent the sample surface more and spend more time in contact. Other than the repulsive forces that appear when the tip indents the surface, there are also attractive forces hetween the tip and the sample. The origins of these forces are mainly the capillary forces and Van der Waals forces. They appear when the tip gets closer to the surtace. An illustration of the interaction forces and tip displacement is given in Fig. 2 . In general, the attractive forces are higher when the tip retracts. Thisis either due to a hysteresis in Van der Waals forces or due to formation and disruption of a liquid neck.
I o m i a o m a o u o w a w m a c o
sngk GI up position (degnar) .I1
Figure 2. Tip position (a) with respect to sample surface in TM- AFM and tip-sample interaction forces @). Negative tip displacement means that tip indents the sample surface.
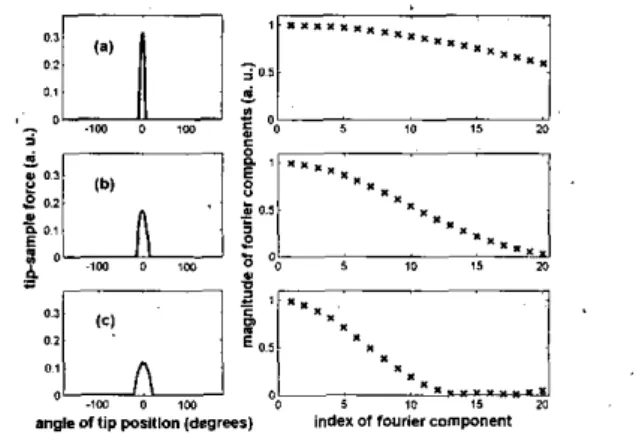
The periodic nature of tip-sample forces results in higher order Fourier components (harmonics) which have frequencies exactly at the integer multiples of the vibration frequency of the cantilever. The magnitudes of these harmonics mainly depend on the contact time and peak force. For illustrative purposes we modeled the sample with a linear spring and neglected the attractive forces. Then, the interaction forces become a clipped sine wave. In Fig. 3, we plotted the magnitudes of the harmonic forces calculated with this model for three different contact times, 4%, 8% and 12%. In order to compare the three different cases, we assumed that the average force (Oth order Fourier component) is same in all of them. Then we normalized the magnitudes of the harmonics to the 0' order Fourier component. These plots show that the higher order components, especially the ones around 15Ih harmonic in our example, depend highly on the contact time. Therefore, one can argue that in TM-
AFM the information ahout the sample elasticity is in the higher harmonics of the tip sample interaction forces.
mgkoftip p~riiion (degrees) index of rDvnerccv"nent
Figure 3. Tip sample interaction forces and corresponding Fourier spectrum of forces for (a) 4 %, @) 8 %, (c) 12 %,
contact times. The average forces are normalized to I in all three cases.
The higher harmonics are all driven by forces on the cantilever tip. The actual cantilever displacements at these frequencies therefore depend on the transfer function relating displacement to the tip force. That is, the higher harmonic forces, which have frequencies close to resonances of the cantilever, will generate larger vibration amplitudes. Figure 4 gives the transfer function of a rectangular cantilever whose fundamental resonance frequency is normalized to 1. The higher harmonics that are closest to the resonance peaks are also marked on the curve. Typical quality factors of each resonance are on the order of several hundreds. For a randomly picked cantilever it is therefore very unlikely that one of the higher harmonics coincide with one of the resonances of the cantilever. AS a result of this, none of the higher harmonics of a typical cantilever makes use of the high
transfer function at resonance.
rrequency(n0rmallZed to nrst reMHIa"cc)
Figure 4. Transfer function of a typical AFM cantilever. The
cross marks point the location of the harmonic forces that are closest to the resonance fiequencies.
TRANSDUCERS '03
The 12th International Conference on Solid State Sensors. Actuators and Microsyslms, Boston. June 8-12, 2003
383.5
RESULTS AND DISCUSSION
HARMONIC CANTILEVER
We have designed and fabricated an AFM
cantilever with increased vibration amplitude at higher harmonics by matching a higher-order natural resonance to an integer multiple of the fundamental resonance frequency. Specifically, we matched the third order flexural resonance frequency to the 16" harmonic of the fundamental. Note that the 16Lh harmonic is very sensitive to contact time variations (see Fig. 3). Tuning the resonance frequency of the third order mode is achieved by appropriately removing mass from regions where the cantilever has high mechanical stress in that particular mode, thereby reducing elastic energy and the resonance frequency of the mode. This is shown in Fig. 5. The hole in the cantilever is designed to give the correct value for the resonance frequency of the third order flexural mode. A series of cantilevers were fabricated with slightly different hole sizes (2 pm steps in width) to allow for dimensional variation due to the fabrication process.
Figure 5 . SEM image of a harmonic cantilever. Width, length and thichess of the cantilever are 50, 300, and 2.2 um
respectively. The rectangular opening is 22 by 18 um and centered 190 um away from the cantilever base.
The fabrication of harmonic cantilever is a three- mask process. First, the tip masks are transferred to an oxideinitride hard mask on'the device layer of an SO1
wafer. Tips are plasma etched and oxide sharpened. The second mask defines the cantilever geometry, including the holes. The cantilevers are formed in a plasma etch. The front side of the wafer is then covered with nitride, and the hack side is patterned for KOH etching. AAer etching through the wafers, the cantilevers are released by removing the protective nitride layer in a plasma etch and removing the oxide in a buffered oxide etch.
The non-uniform etch rates resulted in variations in
cantilever thicknesses, which in tum translated into variations in the resonance frequencies. Fortunately, the ratio of the third and fundamental resonances did not change significantly, so we were able to match the resonances in spite'of the fabrication variations. At this time we do not have enough cantilevers to test the repeatability of this behavior.
We performed our experiments with a commercial AFM system (Dimension 3 100, Nanoscope 111, Veeco, Santa Barbara, CA) equipped with an external RF lock-in amplifier (SRX44). An external lock-in amplifier is used to detect the signals at the 16th harmonic of the driving frequency. Additionally we used a spectrum analyzer to monitor the vibration spectrum of the cantilever.
-
-106
-20-
7 -30W
-40 6 -50 cH
-80 I -70 -90 0 200 400 600 800 vibration frequency (KHz)Figure 6. Vibration spectrum of a harmonic cantilever in
tapping-mode AFM. The cantilever is driven at its fundamental resonance frequency (37.4 KHz), and higher-harmonics generation is observed. The second (240 KHz) and third (598
KHz) harmonics coincides with higher resonances and have relatively large signal power.
0 . ~ ~ ~ ~ ~ ~ ~ ~ ~ ~ . ~ ~ ~ ~ ~ ~ ~ ~ ~ ~ ~ ~ ~ ~ ~ ~ ~ ~
-
E -20 -30'F
-50 -e
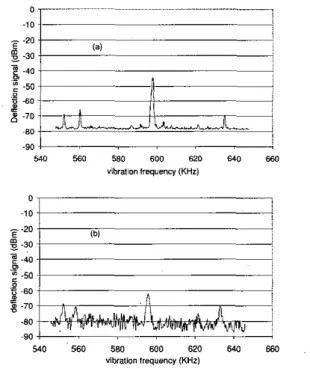
-40 p -60 .. = .70 - 4 0 -90 540 560 580 600 620 MO 660 vibration frequency (KHz1 540 560 580 600 620 MO 660 vibration frequency (KHz)Figure 7. Spectrum of the vibrations of a hannonic cantilever around 15-17'h harmonics of the driving frequency in tapping- mode atomic force microscopy. (a) 16* harmonic is exactly equal to the third resonance frequency of the cantilever, recorded at 300 Hz bandwidth, (h) 16' harmonic is slightly less than the third resonance frequency (596KHz instead of
598KHz), recorded at 1 KHz bandwidth.
TRANSDUCERS '03
The 12th International Conference on Solid Slate Sensors, ACtualors and MicrosystemS. Boston, June 8-12.2003
383.5
In Fig. 6 the vibration spectrum of a harmonic cantilever in TM-AFM is given. Apart from the signal at the drive frequency, two peaks (#6 and #16) have relatively large signal level compared to their neighbors. These are the harmonics that are closest to the resonance frequencies of the harmonic cantilever. Especially the 16‘’ harmonic has relatively higher signal level compared to its neighbors. That is because the frequency of that particular harmonic matches the third resonance frequency of the harmonic cantilever. In Fig. 7, the spectrum around the 15‘‘ to 17” harmonics is given when third resonance frequency is exactly equal to 16 times the driving frequency (a) and when there is a slight mismatch
@). This result shows that our correctly-designed cantilevers improve the higher-harmonic signal by 15- 20dB.
c_,Ym-
-
.“r”-
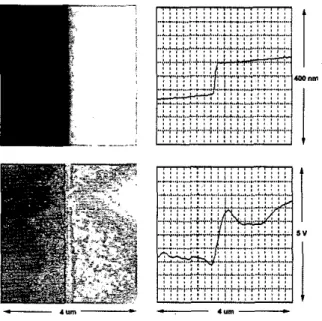
Figure 8. Images of chrome edge on a photomask. The left half of the images is the glass substrate and the right half is the chrome layer. Top: TM-AFM topography image of the surface. Bottom: Image of the same area at the 16” harmonic of the driving frequency. The oscilloscope traces horizontally scan the topography and the 16” harmonic signals.
In order to demonstrate the sensitivity of imaging at the higher harmonics with harmonic cantilevers, we recorded images on the surface of a photomask with a surface composed of borosilicate glass (Modulus of Elasticity = 63 GPa) and chromium (Modulus of Elasticity = 248GPa). In Fig. 8 the TM-AFM topography image (top) and the image at the 161h harmonic (bottom) is depicted together with the oscilloscope traces of the topography and 16Ih harmonic signal. These figures show that imaging at 16” harmonic can distinguish between the two materials to a good degree. These images are taken simultaneously and the left side of each image is the glass side and right side is the chromium side.
Since the chromium is stiffer then the borosilicate glass, we expect the contact time to he shorter on chrome side. Fig. 3 suggests that shorter contact time results in larger signals at the 16“ harmonic. The oscilloscope traces in Fig. 8 show that the signal at the 16” harmonic is higher on the chrome side as predicted. Additionally, metal traces andor dust particles on the glass side are quite visible in the 16” harmonic image, demonstrating a better signal-to-noise than in the topographical image. This illustrates a potential additional advantage of higher- harmonic imaging: The signal is shifted to higher frequencies with lower llf noise, resulting in better signal-to-noise.
CONCLUSION
Measurement of elasticity of surfaces at the nanoscale has attracted ’a lot of interest after the introduction of the AFM. The micromachined cantilever presented in this report enahles a sensitive technique, higher harmonic imaging, and thereby provides a non- destructive and practical way to map elasticity variations across a surface.
AKNOWLEDGEDGEMENTS
This work was supported hy the birdseed fund of Stanford University Office of Technology Licensing. 0. Sahin acknowledges support from a T. J. Rodgers Stanford Graduate Fellowship.
REFERENCES
[l] K. Yamanaka, H. Ogiso, 0. Kosolov, “Ultrasonic force microscopy for nanometer resolution subsurface imaging”, Applied Physics Letters, 64,178 (1994) [2], K. B. Crozier, G. G. Yaralioglu, F. L. Degertekin, J.
D. Adams;S. C. Minne, C. F. Quate, “Thin film characterization by atomic force microscopy at ultrasonic frequencies”, Applied physics letters, 76, 1950 (2000) [3] K. Yamanaka, T. Tsuji, A. Noguchi, T. Koike, T.
Mihara, “Nanoscale elasticity measurement with in situ tip shape estimation in atomic force microscopy”, Review
of Scientific Instruments, 71,2403 (2000)
[4] K. Yamanaka, Y. Maruyama, T. Tsuji, K. Nakamoto, “Resonance frequency and Q factor mapping by ultrasonic atomic force microscopy”, Applied Physics letters, 78, 1939 (2001)
[5] M. Stark, R. W. Stark, W. M. Heckl, R.
Guckenherger, “Spectroscopy of anharmonic cantilever oscillations in tapping-mode atomic-force microscopy”, Applied Physics Letters,
77,
3293 (2000)[6] R. Hillenhrand, M. Stark and R. Guckenberger, “Higher-harmonics generation in tapping-mode atomic force microscopy: Insights into tip-sample interaction”, Applied Physics Letters, 76, 3478 (2000)
[7] T.R. Rodriguez and R. Garcia, “Tip motion in amplitude modulation (tapping mode) atomic force microscopy: Comparison between continuous and point mass models”, Applied Physics Letters, 80, 1646 (2002)
TRANSDUCERS ’03
The 12th International Conference on Salid State Senson, Actuators and MicrosystemS. Boston, June 8-12. 2003