ё ж
0 n á ^ - i» iM«Í' J^ A mitíta jT ^ y ^ ^ e ¿ Λ - «i,#'.i«^«Úv& м J. ' j¿ «Ж <í^*»>'> «4«.. >«.* w
7* .3»-;»τ·?·««νΝ |ΐ7;?η Λ i і*--::іх::>1э ,r-i77**^·? ÍT*1V^·. гя»Р7**-5 '.Г "7ΐ · TJrrs ■*'» г* Т/ •^.Т γ> r*j ' î^T*î' *5'С* ТТ»;'**‘С?С‘* С^'·' '^‘.7 ^Т **'·'* 7'^'‘“’•"“' ν ’ ' ' '^^■7 7*'·, Lmt'-Λ·*^ '«J^*MI »мГООі·^ '*/> <¿7b· il *ИМІ і:«^ ^чм/'іІГа *'>1^'Ѵі>^ ilaJ м ΐϋ*>> '«J м ¿'І і«ік· •ГО·«^'^ *л · Оммм ъ м-крі' .і м'->0 7"Ί у7 777 Т77^71^ 7^ »7372737 ' ’ ·: 7 ' —; " · Т ^ Т 'іД * ’’ *7 7 τ η * ¥ ·^ “ *ϋ “r s T ? 7 7 т - 7 7 і^ * ~ Г 'Т і . 7 4 7 ^ ;'* n 7 '^ ^ ,-^ : « · , « * : ;<*, < г» « -ч -к :·^ ·;» л ’■ • • • ^ .ѵ ;-/·;·,’ ■. ^ ■ I 2 ^ ^ 7 ^ ^** ¿ ·■ ■' ■ ' Ѵ о Л і і 1'4 ■'' ' ‘^ ' *"*' ^ '■' ^ ■· "'■ ''*^ ■ . * · ·. ■^ 7 7 7^ г р » r jr 77 *Г4^ ч!^; .f^ : 747777 . < '.77: М Ѵ.11.^ «il і< Х «U л O lí мм/ 'Ѵмі''М L Л4^ &JMÎ W.·· м.
*.■.. ? Т С‘ *'^Т?‘«Г? Τ·ί ï*"'^’ C*'’’ ? ѵ 7 " ^ ^ ‘%**Ѵ']) ^ "•^'•'70 ’^-"і^
rfı.OOOiO* м OiMtiı Ji 'w/ «ài («о ’мУ іО^мм U «іміІм«> S '¿1M«/ «иѴ'мміы. ',: ...İM«' я. Ш мОО «L «« <^<ЁаУ лл 'я
С А Н М Ш А Т А 1А А 31Л А
CAN WE MEASURE SERVICE QUALITY ?
A THESIS
SUBMITTED TO THE DEPARTMENT OF MANAGEMENT AND GRADUATE SCHOOL OF BUSINESS ADMINISTRATION
OF BILKENT UNIVERSITY
IN PARTIAL FULFILLMENT OF THE REQUIREMENTS FOR THE DEGREE OF
MASTER OF BUSINESS ADMINISTRATION
By
CAN MURAT ALPASLAN June, 1995
H f
В
I c ertify that I have read this thesis and that in my opinion it is fully adequate, in scope and in q uality, as a thesis for the degree o f M aster of B usiness o f A dm inistration.
A ssistan t P ro fesso r Selçuk K arabati
I c ertify that I have read this thesis and that in my opinion it is fully adequate, in scope and in q uality, as a thesis for the degree o f M aster o f B usiness o f A dm inistration.
A ssistan t P rofessor Serpil Sayın
I c ertify that I have read this thesis and that in my opinion it is fully adequate, in scope and in quality, as a thesis for the degree o f M aster o f
B usiness o f A d m in istratio n .
A ssistan t P ro fesso r M urat M ercan
A pproved by D ean o f the G raduate School o f B usiness A d m in istratio n
P ro fesso r Sübidey Togan
ABSTRACT
CAN WE MEASURE SERVICE QUALITY ?
CAN MURAT ALPASLAN
M .B.A.
SU PERV ISO R : ASSISTA N T PROFESSOR SELÇUK KARABATI JUNE 1995
Affected by the motto "you cannot improve what you cannot measure" and joining the enthusiasm of TQM movement, service companies are trying to measure their service
quality. SERVQUAL is an intrument to measure service quality quantitatively. This
study attempts to test the validity of SERVQUAL instrument. Three qualitative
techniques in addition to SERVQUAL are used and all the four questionaires are applied to 12 different services in Bilkent University. The aim of the study is not only
to criticize the deficiencies of SERVQUAL instrument but also to make the reader
ÖZET
HİZMET KALİTESİNİ ÖLÇEBİLİR MİYİZ ?
CAN MURAT ALPASLAN
YÜKSEK LİSANS TEZİ, İŞLETM E FAKÜLTESİ TEZ Y Ö N ETİCİSİ : YARD. DOÇ. SELÇUK KARABATI
HAZİRAN 1995
"Ölçemediğin bir şeyi daha iyi bir hale getiremezsin," deyişinden etkilenen ve TKY
hareketinin coşkusuna katılan hizmet sektöründeki şirketler de artık hizmetlerinin kalitesini ölçmeye çalışmaktadırlar. SERVQUAL hizmet kalitesini sayısal olarak ölçen bir yöntemdir. Bu çalışma ise SERVQUAL yönteminin geçerliliğini test etmeye
yöneliktir. Hizmet kalitesini ölçmek için üç adet sözel anket, SERVQUAL anketiyle beraber Bilkent Üniversitesindeki 12 değişik servis sektörüne uygulanmıştır. Bu
çalışmanın amacı SERVQUAL yöntemini eleştirmenin yanısıra, konuyla
ilgilenenlerin de hizmet kalitesini ölçmenin ne kadar karmaşık olduğunu görmelerini sağlamaktır.
ACKNOWLEDGEMENTS
I gratefully acknowledge the patient supervision, continuous support and the helpful comments of Assistant Professor Selçuk Karabati, throughout the preparation of this study. 1 would like to express thanks to Assistant Professor Serpil Sayın and Assistant Professor Murat Mercan. I would also like to thank to Dr. Mehmet Paşa for his valuable support from the beginning of the study, until he left Bilkent University.
Special thanks goes to my friends Alptekin Aksan, Research Assistant Selçuk Avcı
and my girlfriend Ayça Gelgeç for their continuous moral support.
Finally, 1 am very lucky to have the support of a wonderful family.
TABLE OF CONTENTS ABSTRACT... i ÖZET... ii ACKNOWLEDGEMENTS... iii TABLE OF CONTENTS... 1 LIST OF TABLES...3 LIST OF FIGURES...4 1. INTRODUCTION... 6 2. SERVICE CONCEPT... 9 2.1. What is a Service ? ... 9
2.2. Some Common Characteristics of Services...11
2.3. Classification of Services... 13
2.4. Definition of Quality... 16
2.5. Definition of Service Quality... 17
3. SERVQUAL...19
3.1. Parasuraman, Zeithaml and Berry's (PZB) Definition of Service Quality...19
3.2. SERVQUAL Instrument... 22
3.3. Computing the SERVQUAL Gap Scores... 23
3.4. Applications of SERVQUAL... 25
4. LITERATURE SURVEY... 27
5. STUDY...33
6. FINDINGS...38
6.1. Can SERVQUAL Really Measure ? ... 38
6.2. The Relation Between Types of Services and SERVQUAL's Measuring Capability... 45
6.4. Added Quality Dimensions...48
6.5. Dimensions Aggregates and Averages of More Than One Statement... 49
6.5.1. tangibles dimension... ... 50
6.5.2. reliability dimension... 51
6.5.3. responsiveness dimension... 52
6.5.4. access dimension... 53
6.5.5. understanding the customer dimension...54
6.6. Implications of the Relationship Between SERVQUAL Score & Relative Importance of Service Quality Dimensions...55
6.7. Implications of Demographic Analysis...62
7. CONCLUSION... 65
8. APPENDICES... 67
LIST OF TABLES
Table 1-1 Employment in Serviee Sector
Table 2-2 Differences Between Physical Goods & Services Table 2-3 Service Classification Scheme
Table 3-la Service Quality Dimensions
Table 3-lb Consolidated Service Quality Dimensions
Table 3-2 Statements Pertaining To SERVQUAL Dimensions Table 4-7 Service Quality Determinants
Table 5-a Relationships with Customers Table 5-b Method of Service Delivery
Table 5-c Nature of Demand for the Service Relative to Supply Table 5-d Customization and Judgment in Service Delivery
Table 5-e Nature of the Service Act
Table 6-3a Number of Problems Collected
Table 6-3b Number of Problems Not Related to SERVQUAL
Table 6-3c Problems Unrelated to SERVQUAL Dimensions
Table 6-4 Added Quality Dimensions
Table 6-5 Dimensions Comprised of More Than One Statements
Table 6-5-1 SERVQUAL Scores For Each Tangibles Statement Table 6-5-2 SERVQUAL Scores For Each Reliability Statement Table 6-5-3 SERVQUAL Scores For Each Responsiveness Statement
Table 6-5-4 SERVQUAL Scores For Each Access Statement
LIST OF FIGURES
Figure 1-1 Sectoral GNP Shares
Figure 3-1 Service Quality Framework of PZB Figure 4-7 Service Quality Framework
Figure 6- lb Problem Frequency,ys SERVQUAL Score in Library
Figure 6-lc Problem Frequency vs SERVQUAL Score in Transportation Services Figure 6- Id Problem Frequency vs SERVQUAL Score in Food Service
Figure 6-1 e Problem Frequency vs SERVQUAL Score in Donnitory
Figure 6-1 f Problem Frequency vs SERVQUAL Score in Telephone Center Figure 6-lg Problem Frequency vs SERVQUAL Score in Cleaning Services
Figure 6-lh Problem Frequency vs SERVQUAL Score in Security Services Figure 6-1 i Problem Frequency vs SERVQUAL Score in Sports Facilities
Figure 6- Ij Problem Frequency vs SERVQUAL Score in Bank
Figure 6- Ik Problem Frequency vs SERVQUAL Score in Taxi Services
Figure 6-11 Problem Frequency vs SERVQUAL Score in Photocopy Center Figure 6-6a SERVQUAL Score vs Relative Importance in Library
Figure 6-6b SERVQUAL Score vs Relative Importance in Transportation Services Figure 6-6c SERVQUAL Score vs Relative Importance in Food Center
Figure 6-6d SERVQUAL Score vs Relative Importance in Dormitories
Figure 6-6e SERVQUAL Score vs Relative Importance in Telephone Center
Figure 6-6f SERVQUAL Score vs Relative Importance in Cleaner
Figure 6-6g SERVQUAL Score vs Relative Importance in Security Services
Figure 6-6h SERVQUAL Score vs Relative Importance in Career Development
Figure 6-61 SERVQUAL Score vs Relative Importance in Photocopy Center Figure 6-7a SERVQUAL Scores Reflecting Demographical Differences in Library Figure 6-7b SERVQUAL Scores Reflecting Demographical Differences in Security Figure 6-7c SERVQUAL Scores Reflecting Demographical Differences in Taxi
1. INTRODUCTION
Services are becoming a source of wealth nowadays. Service sector increases wealth
and employment in the society. According to many academicians and practitioners, we have entered this stage of the service economy or service society (Grdnroos, 1990). The share of service sector in GNP of nations is increasing rapidly. Figure 1-1 shows
the Turkish case.
SECTORAL GNP SHARES
1923 1948 46% 43% 11% 13% 1960 1991 16% 46% 57% 27%16% B A g ric u ltu re S I In d u s try B S e rv ic e
Source : T.C. Prime Ministry, State Institute of Statistics, 1923-1991
Figure 1-1 Sectoral GNP Shares
In addition to that, the rate of labor force employed in service sector is increasing all
around the world. More and more people are working in service sector. Table 1-1
presents the employment level of service sector as the percentage of the total labor force.
Table 1-1 Employment in Serviee Sector
EMPLoM bNT i n s e r v ic e SECTOR
(As the percentage of total labor force)
1970 1980 1986 % % % OECD (All) 49.4 56.4 60.9 OECD (Europe) 42.9 50.1 55.4 USA 61.1 65.9 69.3 France 47.2 55.4 r 61.3 West Germany 42.9 50.3 53.7 Japan 46.9 54.5 57.1
Source ' Managing Services, Christopher Lovelock (1994).
The implication of the preceding observations is that the service sector is in a state of rapid change, reflecting a variety of factors from globalization to the use of new technologies (Lovelock, 1994). Since our subject is Turkey, a country which is about
to be included in customs union with EC members, we are confronted with an increased competition not only in manufacturing but also in services. This brings the need for effective management skills, which involves in it the ability to see the
different aspects of service management, not only taken-for-granted managerial skills.
In service sector, the customer awareness and the competition to satisfy their needs are increasing. Service companies have to deliver quality service tin order to survive.
Similar to its conceptualization in manufacturing, quality is the key to success in
service sector.
TQM applications begin to take place not only in industrial settings but also in service
settings. While it is relatively easy to measure quality in manufacturing, it is difficult to attain the same level of ease in services. This thesis approaches the problem of
measuring service quality by testing the validity of a measurement methodology, SERVQUAL, developed by Parasuraman A., Zeithaml V., and Berry L. (PZB, 1990).
In the following chapter, we first define the concepts of service, quality, service quality, types of services, the differences between services and physical goods. The next chapter deals with the SERVQUAL methodology, its conceptualization of service quality and its applications. The literature survey pertaining to some deficiencies in SERVQUAL methodology is discussed in Chapter 3. In Chapter 4, we present our approach and the survey that took place in Bilkent University. The results of the study and our interpretations are presented in Chapter 5. The conclusion summarizes our
2. SERVICE CONCEPT
2.1. What is a Service ?
There are many different kinds of services. The definitions of these services vary as well. Here are some of the definitions of the services in the literature (Gronroos 1990) :
"Service - Activities, benefits, or satisfactions which are offered for sale, or provided in connection with the sale of goods" (American Marketing Association 1960, p. 21).
"Services represent either intangibles yielding satisfactions directly (transportation, housing), or intangibles yielding satisfactions jointly when purchased either with commodities or other services (credit, delivery)" (Regan 1963, p. 57).
"Marketed Services - A market transaction by an enterprise or entrepreneur where the object of the market transaction is other than the transfer of ownership (or title, if any) of a tangible commodity" (Judd 1964, p. 59).
"For the consumer, services are any activities offered for sale that provide valuable
benefits or satisfactions; activities that he cannot perform for himself or that he
chooses not to perform for himself" (Bessom 1973, p. 9).
"A service is an activity offered for sale which yields benefits and satisfactions without leading to a physical change in the form of a good" (Blois 1974, p. 157).
"Services (are) separately identifiable, intangible activities which provide want satisfaction when marketed to consumers and/or industrial users and which are not necessarily tied to the sale of a product or another service" (Stanton 1974, p. 545).
"A service is an activity or a series of activities which take place in interactions with a contact person or a physical machine and provides consumer satisfaction" (Lehtinen
1983, p. 21).
"Service are any intangible benefit, which is paid for directly or indirectly, and which
often includes a larger or smaller physical or technical component" (Andersen et al 1983, p. 6).
"A service is any activity or benefit that one party can offer to another that is
essentially intangible and does not result in the ownership of anything. Its production may or may not be tied to a physical product" (Kotler & Bloom 1984, p.l47 and Kotler
1991,p.455).
"The meeting of customer expectations in the course of selling and post-sales activity through providing a series of functions which match or better the competition in a way
which provides an incremental profit for the supplier" (Free 1987, p. 75).
"Services is something which can be bought and sold but which you cannot drop on
your foot" (Gummesson 1987b, p. 22; referring to an unidentified source).
After listing these definitions, Gronroos points out the that these definitions are too
limited and proposes himself a definition, which he says a blend of the ones suggested in Lehtinen, Kotler and Bloom and Gummesson :
"A service is an activity or series of activities of more or less intangible nature that normally, but not necessarily, take place in interactions between the customer and service employees and/or physical resources or goods and/or systems of the service provider, which are provided as solutions to the customer problems. (Gronroos 1990, p. 27).
2.2. Some Common Characteristics of Services
Table 2-2 shows the most frequently mentioned characteristics of services and physical goods stressing on the basic differences between them (Grdnroos 1990).
Table 2-2 Differences Between Physical Goods & Services
Physical Goods
'(Services,·.'
•Tangible • Intangible
•Homogeneous • Heterogeneous
• Production and distribution separated •Production and distribution and
from consumption consumption simultaneous processes • A thing •A n activity or processes
• Core value produces in factory • Core value produces in buyer-seller • Customers do not formally interactions
participate in the production • Customers participate in production
process process
• Can be kept in stock • Cannot be kept in stock •Transfer of ownership •No transfer of ownership
In addition to the ones described above, Lovelock (1992, p. 6) distinguishes three more
differences between services and physical goods :
1. Importance O f The Time Factor : Many services are delivered in real-time.
Delivery of service needs the customers and the front-line employees to be present
(e.g. transportation, health care and haircut services). The time spent in the delivery of the service becomes an attribute which will be an effective criterion that
2. Quality Control Problems : Contrary to manufactured goods, the conformance to requirements of services cannot be controlled as effectively due to the difference in the nature of services and physical goods. The delivery of a service is a real-time application. The delivery and consumption take place at the same time making it more difficult for the company to conceal the mistakes and shortcomings. The consistency of the service delivered is affected by the existence of factors related to human beings involved in the process.
3. Different Distribution Channels : The distribution channels are not only used for physical goods. Service providers also have to make their output available and accessible for the segments they have targeted. Service businesses can deliver their
services either using electronic channels or, depending on the type of service, creating places in which the delivery and consumption take place simultaneously.
This makes the design of the operations phase more complex and dynamic.
After analyzing the basic differences of physical goods and services, we can summarize the characteristics of service as sueh (Gronroos 1990, p. 29):
1. Services are more or less intangible.
2. Services are activities or series of activities rather than things.
3. Services are at least to some extent produced and consumed simultaneously. 4. The customer participates in the production process at least to some extent.
The definition proposed by Gronroos shows us that in order to manage services
effectively and decide what types of resources should be used, one must understand the
nature of the service he is involved with. This brings with it the need for the analysis of
several types of classifications of services in the literature and identifying the particular service in one or several of the classifications discussed below.
2.3. Classification of Services
If we want to classify services, we will immediately notice that there is a diversity of them. For example, the service barber's shop offers is extremely different than the service offered by the long-distance telephone operator. The diversity of the service sector makes it difficult to draw generalizations which may be of practical utility for managers. The importance of classification lies here that, developing ways to analyze services, highlighting the characteristics that services have in common, enables us to examine the implications for marketing services or managing quality (Lovelock, 1992).
Table 2-3, developed by Lovelock (1983) and with some new classifications added by
Table 2-3 Service Classification Scheme Author Proposed Classification Scheme Comment
Judd(1964)
2 .
3.
Rented goods serviees (right to own and use a good for a defined period)
Owned goods serviees (custom ereation, repair or improvement o f goods owned by the
customer) ?
Nongoods services (personal experienees or "experiential possession")__________________
First two are fairly speeifie, but third eategory is very broad and ignores serviees sueh as insuranee, banking, legal adviee and aeeounting. Rathmell (1974) 1. Type o f seller 2. Type o f buyer 3. Buying motives 4. Buying praetice 5. Degree o f regulation No speeifie applieation to services-could apply equally well to goods. Shosiack (1977) Sasset et al. (1978) Mill (1977) Thomas (1978)
Proportion o f physieal goods and intangible services contained within eaeh produet "paekage"
Offers opportunities for multi attribute modeling. Emphasizes that there are few pure goods or pure serviees.
Services affecting persons vs. those affecting goods
Permanent vs. temporary effects o f the service Reversibility vs. nonreversibility o f these effects
Physical effects vs. mental effects Individual vs. collective services
Emphasizes nature o f serviee benefits and (in 5) variations in the serviee delivery/eonsumption environment.
1. Primarily equipment based
a. Automated (e.g. car wash)
b. Monitored by unskilled operators (e.g. movie theater)
c. Operated by skilled personnel (e.g. airline personnel)
2 . Primarily people based
a. Unskilled labor (e.g. lawn care) b. vSkillcd labor (e.g. repair work)
c. Professional staff (e.g. lawyers, dentists)
Although operational rather than marketing in orientation, provides a useful way o f understanding produet attributes.
Chase (1978)
Extent o f customer contact required in service delivery
a. High contact (e.g. health care, hotels,
restaurants)
b. Low contact (c.g. postal service, wholesaling)
Recognizes that product variability is harder to control in high contact services because customer exert more influence on timing o f demand and service features, due to their greater involvement in the service process.______________________ (irönroos (1979) 1. Type o f service a. Professional services b. Other services 2. Type o f customers a. Individuals b. Organizations
Notices that the same services c.g., insurance and financial, may be rendered to both individuals and organizations.
Kotlcr (1980)
1. People based vs. equipment based
2. Extent to which client's presence is necessary
3. Meets personal needs vs. business needs
4. Public vs. private, for-profit vs. nonprofit
Synthesizes previous work, recognizes differences in purpose o f service organizations
Lovelock (1980)
1. Basic demand characteristics
-Object served (persons vs. property) -Extent o f demand/supply imbalances -Discrete vs. continuous relationships between customers and providers
2. Service content and benefits
-Extent o f physical goods content -Extent o f personal service content -Single service vs. bundle o f services - Timing and duration o f benefits
3. Service delivery procedures
-Multisite vs. single site delivery
-Allocation o f capacity (reservations vs. first come, first served)
-Independent vs. collective consumption -Time defined vs. task defines transactions -Extent to which customers must be present during
service delivery
Synthesizes previous
classifications and adds several new schemes. Proposes several categories within each classification. Concludes that defining object served is m ost. fundamental classification scheme. Suggests that valuable marketing insights would come from combining two or more classification schemes in a matrix.
Schmenner (1986)
1. Degree o f interaction and customization
a. Low b. High
2. Degree o f labor intensity
a. Low
b. High_______________________________
Recognizes that some services may be more customized and involve a higher degree o f labor intensity, and may help the reader to understand the strategic tactical options available. Lovelock
(1983)
1. The nature o f the service act
a. Tangible actions to people or things b. Intangible actions to people or things
2. Relationships with customers
a. Continuous delivery b. Discrete transactions c. "Membership" relationships d. No formal relationships
3. Customization and judgment in service
delivery
a. Judgment exercised by customer contact persons
Customization o f services
Nature o f demand in relation to supply Extent to which supply is constrained Extend o f demand fluctuations Method o f service delivery a. Single or multi-site delivery
b. Service delivered on provider’s or customer's premises______________________
Provides a series o f
classifications which together illustrate the complex nature o f services and provide useful background information for managerial purposes. b. 4. a. b. 5. Vandemerw 1. e& a. Chadwick b. (1989) 2. a. b. c.
Degree o f consumer/producer interaction Lower
Higher
Relative involvement o f goods "Pure" services
Services with some goods or delivered through goods
Services embodied in goods____________
Recognizes the importance and role o f goods components in service businesses.
Among the proposed schemes, the one we will use for our research purposes is from Lovelock, 1992. The scheme tries to answer the following five questions :
1. What is the nature of the service act ?
2. What type of relationship does the service organization have with its customers ? 3. How much room is there for customization and judgment on the part of the service
provider ?
4. What is the nature of demand and supply for the service ? 5. How is the service delivered ?
In the scope of this study, the classification above will be helpful in our search for the relationship between the methodology used for measuring services and the type of the service.
2.4. Definition of Quality
To measure and to improve the quality of a service, first of all, we have to define what quality is. Garvin identifies five alternative perspectives to quality (Garvin 1984):
1. The transcendent or philosophic approach which equates service quality to innate
excellence. This kind of approach finds its application in visual arts. It says that people learn to recognize quality only through experience gained from repeated
exposure.
2. The product-based approach argues that differences in quality reflect difference in
measurable attributes. Quality is precise and measurable. It implies that "more" or
"higher" or "faster" of an attribute is "better." This view is totally objective since
quality is viewed as an inherent characteristic of the product, rather than something
3. The user-based approach proposes that the quality lies in the eyes of the beholder. Quality is equal to maximum satisfaction. This subjective approach recognizes that different customers have different needs and wants.
4. The manufacturing-based approach defines quality as "conformance to requirements." Deviation from specifications implies a reduction in quality (in services, quality is operations driven). In services this is the result of recognizing the customer's interest in quality, for example : "making it right the first time". One important thing is that the requirements are internally developed.
5. The value-based approach defines quality in terms of value and price. A quality product is the one that provides performance at an acceptable cost.
2.5. Definition of Service Quality
Garvin's approach is manufacturing oriented and we should expect some differences
between definitions of product quality and service quality due to their different nature.
In some firms, service quality is "giving the customers what the customer wants." To
some others it is "to build enduring relationships with customers," which means that
service quality is the means to an end rather than the end itself Enduring relationships, in the sense they argue, is ensured if the transaction with the customer is satisfactory
from the customer's point of view and the firm is better than any competitive firm
(Bernhardt, Keller, Schmalensee, Vanecko 1988).
According to Grönroos, "quality is what customers perceive." In the firm, one has to define quality in the same way customers do. Grönroos says that the quality of a
service as it is perceived by customers has two dimensions, namely, a technical or
interested in what he/she is left with (technical quality) and how he/she receives service (functional quality) (Gronroos 1990).
In the literature, there are three alternative conceptualizations of service quality : attribute theory, customer satisfaction theory and interaction theory (Chase & Bowen, 1991). Grdnroos's definition partially lies in the customer satisfaction theory. Parasuraman, Berry and Zeithaml's (PZB) definition of service quality says that, the meaning, definition and evaluation of quality exist in customer's mind. Attribute theory places emphasis on the technical aspects of production, whereas customer satisfaction theory places importance on customer perception. PZB's definition of service quality will be examined in detail in section 3-1.
The last theory is interaction theory presented by Klaus (1985), who defines it as a "shared experience of gain" by all participants in the service encounter. Service quality, according to Klaus, emerges through the mutual need satisfaction of both employees
and customers.
The next section is about SERVQUAL instrument, created by PZB who are proponents
3. SERVQUAL
Parasuraman, Berry and Zeithaml (PZB, 1990), since beginning of their research in 1983 have been interested in three central questions;
1. What is service quality ?
2. What causes service quality problems ?
3. What can organizations do to solve these problems and improve their services ?
While our interest is focused on the first and second issues, implications of our conclusion will be useful for the discussions about the validity of SERVQUAL instrument and whether the third issue is reachable through first and second conceptualizations.
PZB offer the SERVQUAL scale, very simply, to provide the managers with a useful framework that makes easier for them to understand service quality issues and to initiate specific and practical solutions to improve it.
They claim that their framework is not only for staff executives but also for line
executives and is for all types of service organizations whether for profit or not-for-
profit.
3.1. PZB's Definition of Service Quality
According to PZB, the key to ensure good service quality is meeting or exceeding what customers expect from the service. So, service quality, as perceived by customers, can
perceptions. In Figure 3-1, we see PZB's framework to represent the customers' assessment of service quality.
Dimesions of Service Quality Tangibles Reliability Responsiveness Competence Courtesy Credibility Security Access Communication Understanding the Customer Word of Mouth Personal Needs Past Experience External Communi cations Perceived Service Quality
Figure 3-1 Service Quality Framework of PZB
Factors influencing expectations are:
• Word-of-mouth communications, what customers hear from other customers. • Personal needs, the customers' individual characteristics and circumstances.
•Past experience, the influence of previously lived events.
•External communications, direct or indirect messages conveyed by firms to
customers.
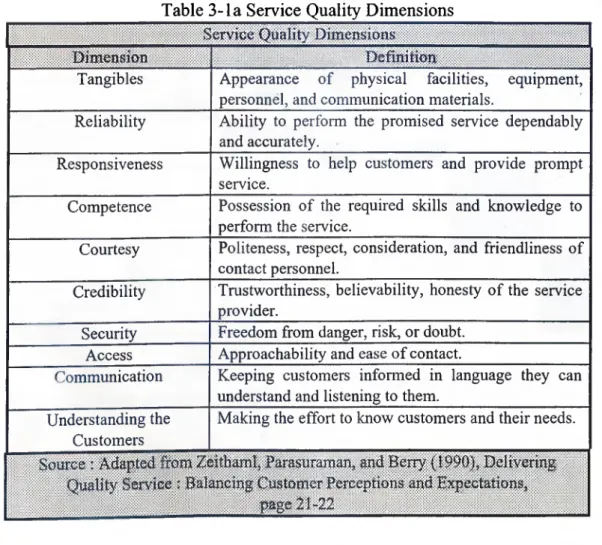
The most revealing and most unique insight emerging from their research, they assert,
concern the criteria customers use to judge the service quality. Table 3-1 a presents the ten dimensions of service quality, which will be the base for building service quality
Table 3-1 a Service Quality Dimensions Service Quality Dimeasious
Dimeusion Definition
Tangibles Appearance of physical facilities, equipment, personnel, and communication materials.
Reliability Ability to perform the promised service dependably and accurately.
Responsiveness Willingness to help customers and provide prompt service.
Competence Possession of the required skills and knowledge to perform the service.
Courtesy Politeness, respect, consideration, and friendliness of contact personnel.
Credibility Tmstworthiness, believability, honesty of the service provider.
Security Freedom from danger, risk, or doubt. Access Approachability and ease of contact.
Communication Keeping customers informed in language they can understand and listening to them.
Understanding the Customers
Making the effort to know customers and their needs.
Source : Adapted from Zeithaml, Parasurarpan, and Berry (1990), Delivering Quality Service : Balancing Customer Perceptions and BjcpectationSi
page 21-22
The ten initial service quality dimensions were then consolidated in to five dimensions since various statistical analyses conducted in constructing SERVQUAL revealed
considerable correlation between some of the dimensions. Table 3-lb shows the
correspondence between original ten dimensions and SERVQUAL's five dimensions.
As it is noticed, the first three dimension is kept untouched while last seven items were grouped in assurance and empathy, first four in one and rest in other, respectively.
Assurance is defined as knowledge and courtesy of employees and their ability to
convey trust and confidence. Empathy is defined as caring, individualized attention the
The service quality construct of PZB can be summarized by the following equation :
Service Quality = Expected Service Quality - Perceived Service Quality
3.2. SERVOUAL Instrument
SERVQUAL is a multiple-item scale. It contains an expectations section of 22
questions consisting of 22 statements and a perceptions section consisting of a matching set of statements. It also contains a section to ascertain customers' assessment
of the relative importance of the five dimensions. This section is placed between the expectations and perceptions section. The expectation and perception statements of
responsiveness dimension applied to library services are seen below (see Appendix 1
for SERVQUAL questionnaire):
Expectation statement
12. Employees in excellent libraries will always be
Perception statement
12. Employees of Bilkent Library are always willing to help students.
The SERVQUAL statements (in both sections) are grouped into the five dimensions as follows :
Table 3-2 Statements Pertaining To SERVQUAL Dimensions
Dimension
Statements Pertaining to the
Dimension
Tangibles 1-4 Reliability 5-9 Responsiveness 10-13 Assurance 14-17 Empathy 18-223.3. Computing the SERVQUAL Gap Scores
Assessing the quality of service involves computing the difference between ratings customers, or students in our case, assign to the paired expectation and perception
statements.
SERVQUAL Score = Perception Score - Expectation Score
If N customers responded to a SERVQUAL survey, the average SERVQUAL score
along each dimension is obtained through the following two steps :
1. For each customer, add the SERVQUAL scores on the statements pertaining to the dimension and divide the sum by the number of the statements making up the
2. Add the quantity obtained in step 1 across all N customers and divide the total by
N.
The SERVQUAL scores for five dimensions obtained can themselves be averaged to obtain an overall measure of service quality. This is an equal weight SERVQUAL score because it does not take into account the relative importance that customers attach to the various dimensions. If one wants to obtain a weighted SERVQUAL score then he has to take into consideration the relative importance of various dimensions. This can be achieved in three steps :
Step I : For each customer, compute the average SERVQUAL score for each dim ension.
SQ^y = ((P2;y-E2y)+(P■ ¿ i ... + (P2;y-E2y)) / (# of x)
SQ^y = y^^ customer, dimension score, z = tangibles, reliability,..., empathy E^y = y^^ customer, expectation statement x pertaining to dimension z.
Pzy = y^h customer, perception statement x pertaining to dimension z.
Step 2 : For each customer, m ultiply the SERVQUAL score for each dimension (obtained in step 2) by the importance weight assigned by the customer to that dimension.
SQay - ((kiy SQl) + (k2y SQ2) + (ksy SQ3) + (k4y SQ4) + (ksV SQs))/5
SQ^y = Weighted SERVQUAL score for customer y
kjy = i^k dimension relative importance coefficient for customer y, i = 1,2,3,4,5
Step 3 .· A d d the scores obtained in step 2 and divide by the number o f customers.
SQz - (SQ
i^SQ
2^ ... + SQn^yn
SQ2 = dimension SERVQUAL score n = Total number of customers
Step 4 : A d d all the scores obtained in step 3 and divide by 5 to obtain an overall weighted service quality measure.
SQ° = (SQtangibles'*'SQreliability·*· ···■*■ SQempathyV^
SQ® = Weighted SERVQUAL overall score
3.4. Applications of SERVOUAL
PZB asserts that SERVQUAL instrument can be used to compute service quality gap scores at different levels of detail : for each statement pair, for each dimension, or combines across all dimensions. They state that by examining these various gap scores
a company cannot only assess its overall quality of service but also identify the k ey
dimensions, and facets within those dimensions, on which it should focus its quality improvement efforts (emphasis put by author). The emphasized part in the previous
sentence draws the outline of what this thesis aims to probe.
The SERVQUAL instrument and the data generated by it can also be used in a variety
of other ways such as :
1. Comparing customers' expectations and perceptions over time
3. Examining customer segments with different quality perceptions 4. Assessing quality perceptions of internal customers
In our study, we added questions concerning the demographic structure of the students
4. LITERATURE SURVEY
This section tries to put forward the criticisms that SERVQUAL instrument is subject to. There are, basically, seven different criticisms. PZB responded to some of them, and they did not respond to some. The following paragraphs summarize the debate.
Although the SERVQUAL instrument is very popular, several people have suggested that there are serious shortcomings that limit its usefulness. Carman (1990) argues that the PZB dimensions are not generic, in other words, SERVQUAL instrument needs to be customized to the service in question. Based on criteria of face validity and factor analysis eigenvalues greater than one. Carman suggests that more dimensions than the five currently used are needed.
Another concern of Carman is about the measurement of expectations. He states that
expectations measurement is very important and he proposes some alternatives to replace the methodology used in SERVQUAL instrument. These are ;
1. to collect data in terms of perceptions-expectations difference directly
rather than to ask questions about each separately,
2. to consider the question of how much experience the respondent should
have with the service before answering expectations part.
The second proposition is backed up with their research which suggests expectations
change with familiarity.
Since SERVQUAL is a difference score (i.e. perceptions - expectations), the criticism
of Brown, Churchill and Peter (1993) focuses on this aspect. BCP review and empirically investigate in their paper the serious problems in conceptualizing
SERVQUAL. In this section, we will first go over BCP's criticisms and PZB’s
BCP's three problems associated with the use of difference scores to measure the service quality include : reliability, discrimination and variance restriction.
BCP state that any positive correlation between the. component scores attenuates reliability of the resulting difference score and add that as
a) the correlation between the component scores increases or, b) the reliability of either component score decreases,
the reliability of the difference score itself decreases. The supporting rationale behind this assertion is that when two responses are taken from the same respondent, the difference score components (perception and expectation scores are the components) will be positively correlated.
PZB (1993) say that the conditions (a) and (b) are not likely to be serious threats. In regarding the condition (a), PZB put forward that while the expectations component of
SERVQUAL pertains to customers' normative standards -i.e., the service level customers believe excellent companies in a sector must deliver, the pereeptions
component pertains to customers' pereeptions of a given company's service within the sector and there is no conceptual reason for these two to correlate. As an example, if
Customer A have higher SERVQUAL expectations for the appearance of Bilkent Food
Center than Customer B, it does not necessarily follow that Customer A will rate its
appearance higher than Customer B.
The reply to condition (b) simply draws on the findings of both BCP's and PZB's
studies which show very strong reliabilities for the two components (0.94 for
expectations and 0.96 for perceptions.)
BCP define discriminant validity as the degree to which measures of theoretically
unrelated constructs do not correlate too highly with another. The two potential problems they identify are (a) attenuation of correlation between constructs by low
measure reliability, (b) the degree to which the difference score measure can be discriminated from one or both of the component measures used to obtain difference. Related to condition (b), they state that in practice, the difference will always be correlated with at least, and thus not distinct from, one of the component measures and this will cast doubt on the constmct validity of difference scores.
PZB reply to condition (a) again simply by referring to the reliability values obtained by both PZB and BCP (0.87 to 0.92 in PZB 1988 and 0.94 in BCP 1993). Since the values are consistently high, PZB reject the problem stated in condition (a).
PZB, here, refer to BCP's definition of discriminant validity that "the degree to which measures of t h e o r e t i c a l l y u n r e l a t e d c o n s t r u c t s do not correlate too highly with one another." They say that nowhere in their conceptualization (PZB 1985) or operationalization (PZB 1988) of service quality do they imply that service quality
construct is theoretically uiu’elated to expectations and perceptions, moreover, they state (PZB 1990) that the service quality is a function of the discrepancy between customers' expectations and perceptions.
Variance restriction occurs when one of the components scores used to calculate the difference score is consistently higher than the other component. This is typically the
case when one variable is a "motherhood" variable for which more is always better. According to Wall & Payne (1973), when people respond to "what is desirable" in
contrast to "what there is now", they seldom rate the former lower than the latter. BCP
relying on these, state that this is the case with SERVQUAL.
For example, a respondent who perceives service to be poor (and circles 1) has a
potential range, on the difference score, of 0 to -6, depending on the expectations of his, which can vary between 1 and 7. Another respondent who perceives the service to
SERVQUAL score as 0 and -1. This, says BCP, will create some problems in many types of statistical analysis that require equality of variances.
PZB accepts the assertion of BCP that the high mean value and low standard deviation for the expectations component of SERVQUAL relative to perceptions component will restrict the variance of the difference score at higher level of service quality. However, that say that the relevance and seriousness of their problem depend on how the difference scores are used. The problem will be an issue when the difference scores are used in multivariate analysis, however, it will not be an issue when they are used for diagnostic purposes to pinpoint the most serious shortfalls along the general SERVQUAL dimensions or specific service attributes. This is where our research fits : we arc concerned with the practical utility of SERVQUAL instrument and trying to
measure its usefulness in real life.
Babakus & Mangold (1989) suggest that SERVQUAL items represent only one factor rather than five. They also decreased the number of the questions from 22 to 15, and likert-7 scale to likert-5 scale. They claim that their observations indicate the need for
further work on the dimensionality level of the service quality construct. Here, they cite Gromoos 1984, Hedvall & Paltschik 1989, Lehtinen & Lehtinen 1982 for two- or
three-dimensional definitions. Finally, they point out that SERVQUAL is designed to measure functional quality only (defined as the manner in which the health care service
is delivered to the patient).
Cronin & Taylor (1992) conclude that perceptions-minus-expectations is an
inappropriate basis for use in the measurement of quality. Their contention is that measuring perceptions is sufficient. They support their argument by referring to the
marketing literature which, C&T assert, offers considerable support for the superiority
of simple performance-based measures of service quality (SERVPERF). PZB respond
provides strong support for defining service quality as the discrepancy between customers' expectations and perceptions. PZB, by using the same cited articles that are cited by C&T, state that C&T's claim is rather surprising and questionable. Moreover, PZB add that the second citation C&T use to back up their assertion is from an article that neither dealt with service quality nor tested performance-based measures incorporating expectations.
Using confirmatory factor analysis procedures and the LISREL model, Finn & Lamb (1991), find that the SERVQUAL model is not appropriate for a retail store setting, so they conclude that retailers and consumer researchers should not treat SERVQUAL as an off-the-shelf measure of service quality. They think that much refinement is needed
for specific companies and industries.
Teas (1993) raise some issues about the interpretation of the expectations standard. He
states two interpretations for expectations in (Perceptions - Expectations) service quality construct, (a) E as classical attitudinal model ideal point, (b) E as feasible ideal point. (P - E) specification will be problematic when a service attribute is type (a), i.e.,
one on which customer's ideal point is at a finite level and, therefore, performance
beyond that point will displease the customer (e.g. the friendliness of a salesperson in a retailer). What Teas implies here is that the increasing (P - E) scores may not always
correspond to increasing levels of perceived quality.
Chase & Bowen's service quality determinants are different than PZB's. Chase &
Se rvi ce Firm Strategy
S e r v i c e D e l i v e r y S y s t e m
Figure 4-7 Service Quality Framework
The following attributes are the service quality determinants that service literature indicates are important (Chase & Bowen 1991).
_________ Table 4-7 Service Quality Determinants Planning of the service encounter
Back office/front office coordination Reliability of service
Consistency of service Effective use of technology 6. Right degree of standardization 7. Facility - location, adequacy,
atmosphere
8. Logical, consistent business hours 9. Handling non-routine demands
10. Handling emergency situations 11. Provisions for customer privacy
during the service encounter
12. Provisions for the privacy of records 13. Rational approach for managing the
queues
14. Adhering to customer schedules 15. Shifting capacity when needed 16. Materials available when and where
needed
17. Understandable processes and procedures
18. Customer orientation and training 19. Points of service marketing 20. Gathering customer feedback 21. Acting on customer feedback 22. Employee selection
23. Employee skill training 24. Employee attitudes
25. Supervisor-employee relations 26. Correct worker-task assignment 27. Correct amount of self-service
As it is seen from the 27 determinants. Chase & Bowen’s conception gives importance
to firms' point of view as well as customer's. They articulate that the determinants may
look incomplete if you are looking from point of view of other theories such as
5. STUDY
The focus of this study is testing the claim of PZB (1990) that SERVQUAL instrument identifies the key dimensions, facets within those dimensions and on which dimensions managers should focus their quality improvement efforts. In other words, their assertion is that results of the SERVQUAL instmment will point to the problematic areas in that particular service setting.
This study has one major and three minor parts. The major part of our study aims to develop a complementary approach to measuring service quality by both trying to measure the validity of SERVQUAL instrument and seeking to find a proper place for itself in service quality considerations. The three minor parts of the study tries to find :
1. A relationship between SERVQUAL's performance and types of services
2. A relationship between relative importance of SERVQUAL dimensions and
SERVQUAL scores
3. A relationship between student segments and their service quality perceptions
In the major part of the study, we use three methods :
• We directly ask the respondents what the three most important
problems that they have encountered are (see Appendix 2).
• We ask them a bad incident that they remember (see Appendix 3). • We ask them problematic other service quality dimensions that they
would like to add to original PZB dimensions (see Appendix 4).
In the first one, we try to classify the observed problems into SERVQUAL dimensions,
whereas in the second, we apply the same procedure after deciding on what the
problem was b y ourselves. In the third one, the respondents directly decide on the
The first method reached satisfying results but many of the students did not answer the second part or they, instead of critical incidents, responded with writing problems again. In the third one, the questionnaire was testing SERVQUAL dimensions. It asked
about whether there were any more dimensions or determinants of service quality that respondents would like to add to PZB's dimensions. After evaluating the results, the problems which we could not correspond with SERVQUAL dimensions revealed the dimensions SERVQUAL fail to cover. These three studies, together, constitute the
major part of the study.
Taking into account that there are a variety of services and that the classification scheme articulated in section 2-3, we postulated that the ability of SERVQUAL to identify problems is closely related to the type of the service that is in question. For this reason, using the classification scheme of Lovelock (1992), we identified 13
different services in Bilkent University to apply the questionnaires. The services were chosen in such a way that there is at least one service in any one of the matrix dimensions. In the following pages, the distribution of Bilkent University services according to classification of Lovelock is seen. This minor part of the study consisted
of analyzing the results by searching a relationship between SERVQUAL's problem
Table 5-a - Relationships with Customers
Type of relationship between service
organization and its customers
Nature o f service
delivery
Membership relationship No formal relationship Continuos delivery of service Bank Dormitories Security Cleaners Discrete transactions Health center Career development Transportation Sports facilities Library Taxi Photocopy center Food center Telephone centerTable 5-b - Method of Service Delivery
Availability of service outlets
Interaction between
the firms and the
customer
Single Site Multiple Site
Customer goes to service firm Health center Dormitories Library Sports facilities Career development Transportation Food center Bank Photocopy center
Service firms goes to customer
Taxi Cleaners Customer and service
firm transact from a distance
Table 5-c - Nature of Demand for the Service Relative to Supply
Extent o f demand fluctuations
Extent to which
supply is
constrained
Wide Narrow
Peak demand can be met without major delay Transportation Security Dormitories Cleaners Peak demand regularly exceeds capacity Health center Food center Career development Bank Photocdj)y center Library Taxi Dormitories telephone center Sports facilities
Table 5-d - Nature of the Service Act
Who or what is the direct recipient of the
service ?
What
i fservice act ?
People PossessionsTangible actions Service directed at people's bodies Health center Transportation Food center Dormitories Taxi Sports facilities
Service directed at goods & other physical
possessions
Photocopy center Cleaners
Intangible actions
Service directed at Service directed at people's minds intangible assets
Security < > Career development Library
Security Bank
Table 5-e - Customization and Judgment in Service Delivery
Customization
Judgment
High LowHigh Health center Taxi Career development Security Low Bank Transportation Food center Telephone center Photocopy center Cleaners Sports facilities Dormitories Library
Having a database has various usage in terms of segmenting the customers. Since we would be planning to deal with huge amounts of data, we thought it would be
interesting to see the relationships between students' demographic structure and
perceptions of service quality. The demographic variables are about their department, year, sex, tuition and whether they stay in the dormitory or they have off-campus housing. In the following sections, we will present the findings about how the demographic differences affected the service quality scores.
Last minor part of the study is about the average relative importance of SERVQUAL
dimensions and their relations with SERVQUAL scores. This study will aim to observe if higher relative importance of a SERVQUAL dimension leads to a bigger
6. FINDINGS
6.1 ■ Can SERVOUAL Really Measure ?
To examine SERVQUAL's measuring performance in a healthy way, we disaggregated the five SERVQUAL dimensions back into ten original dimensions. In one of the questionnaire, we ask about the problems of the service in question. In the analysis of these gathered data, we first collected all problems together and grouped them according to PZB's dimensions. During this study, some part of the problems could not be categorized into PZB service quality dimensions (these findings are interpreted in Section 6.3). With the grouped data, we summed all of the problems of ten groups and made a frequency analysis. The next step was to compare the results of frequency analysis with the SERVQUAL scores. To see the relationship between figures, we
made an arrangement which brought all data to the same order of magnitude. The
results can be seen in the following graphs.
Heoitlicenta· I A ' SO Difference Score i i! Problem Frequency 0.00 E o o t3 o o Figure 6- la
Problem Frequency vs SERVQUAL Score in Library
F=ood Center 4.50 4.00 I II 3.50 1 5.00 ^ 2.50 ; i 2.00 · 1.50 ' 1.00 0.50 0.00 ^ SO Difference Score ' ■ Problem Frequency Figure 6- Id
Problem Frequency vs SERVQUAL Score in Food Service
4 50 4.00 5.50 3.00 2.50 2.00 1.50 1.00 0.50 0.00 D o n rito ry ^ so Difference Score '' Problem Frequency a E o Figure 6-le
Problem Frequency vs SERVQUAL Score in Telephone Center
10 0 ^ Secuity ^ so Difference Score Problem Frequency E o u Figure 6-lh
Problem Frequency vs SERVQUAL Score in Security Services
9.00 8.00 7.00 6.00 5.00 4.00 3.00 2.00 1.00 0.00 S p o rts Facilities ^ so Difference Score Problem Frequency Figure 6-li
Problem Frequency vs SERVQUAL Score in Bank
Photocopy Center
^ SO Difference Score ‘ Problem Frequency
Figure 6-11
Problem Frequency vs SERVQUAL Score in Photocopy Center
As it is easily seen form the graphs, the frequency of problems or distribution of them
are not consistent with the SERVQUAL scores (tabulated SERVQUAL scores can be seen in Appendix 5). If we sort the dimensions from the most frequent to the least, i.e. in an descending order, we see that SERVQUAL scores do not follow in the same manner. In other words, the most and the least problematic dimensions that are found
at the end of the two analysis arc not the same ones. This is not the case only in two of
the services : Security and Cleaning Services.
While directly asking the problem targets at more operational aspects of the service
delivery system, using SERVQUAL instrument helps us to uncover problem areas
which do not surface at the first glance or which customers are not even aware before articulation of through the statements. If the postulation of customer satisfaction
theorists, that the most important measure of quality exists in the mind of the customers is true than we have to pay attention to both operational aspects and
6.2. The Relation Between Types of Services and SERVQUAL's Measuring Capability
In the previous chapter we postulated that there is a relationship between types of services and SERVQUAL's performance in them. Now, we can search for that relationship in security and cleaning sector. If we take a close look to the classification schemes, we will observe that security and cleaning service, in two of the five classifications, appear in the same quadrant and, in two of the five classifications, appear in the same row. Since the observed relationship is not satisfactory in academic and practical terms, we come to a conclusion that instead of being adversarial methods, its more fruitful for SERVQUAL and our method (directly asking the problem areas)
to be complementary methods.
One direct impact of using the two methods complementarily is that if the problem
asking method is used first, it will be helpful in determining the statements which SERVQUAL instrument will comprise o f Including some themes of the operational
side of the service delivery system in statements while applying SERVQUAL
instrument will result in more reliable results.
6.3. Problems Not Related To SERVOUAL Dimensions
During the classification of problems into SERVQUAL dimensions, some of the
problems did not fit. By the help of the article of Chase & Bowen (1991), which detailed the attributes of service delivery that service literature indicates are important
determinants of service quality, we were able to cover these unfitting problems. Table
6-3a shows in each sector the number of problems collected, the ones related to
Table 6-3a - Number of Problems Collected SERVICE # o f Problems Collected # of Problems Related To SERVQUAL Dimensions % Telephone Center 39 16 41 Sport Facilities 30 16 53 Library 55 33 60 Dormitories 52 32 62 Bank 48 31 65 Photocopy 51 34 67 Food Center 67 49 73 Health Center 10 85 77 Taxi 12 10 83 Transportation 67 56 84 Security 35 34 97 Cleaner 21 21 100
As seen in Table 6-3a, the last four services -particularly the last two- are successfully
covered by the SERVQUAL dimensions. The classification of services (see Table 2-3) may be of some help to understand the reasons. The last three services, transportation, security and cleaners are services in which peak demand can be met without a major delay, while for the rest it regularly exceed capacity. In another classification scheme,
if the delivery of seiwice is continuous and there is no formal relationship between
service organization and its customers, like in security and cleaner, the percentage of
covered problems by SERVQUAL dimension is the highest.
The following table shows the percentage of total number of problems not related to
SERVQUAL dimensions over total number of problems collected. This aggregate
figure is important because 29% is rather high for an instrument claiming to measure service quality. SERVQUAL instrument, according to results based on our study,
Table 6-3b
Total # o f Problems Total # of Problems Abf Related To
Collected SERVQUAL Dimensions %
587 170 29
In Table 6-3b, we see the most salient problems that surfaced at the end of our study. Among them, the most important one that deserves attention is related to sufficiency of capacity, which is an important determinant of service quality but not covered by SERVQUAL dimensions. We, in almost all of the services, encountered with insufficient capacity problem. The most salient services problems were encountered
were : bank, telephone center, health center, library, transportation and photocopy
center.
Table 6-3c Problems Unrelated to SERVQUAL Dimensions PROBLEMS UNRELATED TO #O F
SERVQUAL DIMENSIONS PROBLEMS
Insufficient capacity 85
Rational approach to managing queue 22
Price 15
Quality of product related to service 10
Low variety of service 9
Handling of non routine demands 5
Irrational approach to managing queue is the problem of the bank, food center and the
health center. High price and bad quality products related to service are problems
encountered in food center and photocopy center service settings. These two problem areas are confirmed with our study targeted at identifying problem areas not covered
by SERVQUAL dimensions. Quality of products related to service in photocopy center
is the quality of Xerox copied papers and in food center is the quality of the food served. One interesting point here is that, in four service classification tables.
food and photocopy centers are all in the same quadrants. In fact, in the same quadrants, there are at least two other services in which price and product problems are not encountered. This may imply that food and photocopy centers have something different in common which is that the proportion o f physical goods contained in the service is high (see Table 2-3).
6.4. Added Quality Dimensions
After the analysis of information gathered with the use of the third questionnaire that was dealing with whether any other dimensions than SERVQUAL dimensions existed, the results show that the significant need for new service quality dimensions arises in three sectors ; Photocopy Center, Food Center and Bank.
While the need for new dimension focuses on insufficiency of the bank's services, in photocopy and food center, the emphasis is on the quality of copies and food and the price of the service. Table 6-4 summarizes the new necessary dimensions in each
sector.
Table 6-4 - Added Quality Dimensions
Service
Added Quality Dimension
Photocopy Center Quality of Copies Priee Insufficiency of machines Food Center Quality of food Price Variety of food
Rational approach to queue Bank Insufficient capacity of the unit
Insuffieient number of ATMs
By having the table as the point of departure, we can come to a conclusion in two