Development of fluorescence‑based optical sensors
for detection of Cr(III) ions in water by using quantum
nanocrystals
Canan Baslak1
Received: 17 April 2018 / Accepted: 28 September 2018 / Published online: 3 October 2018 © Springer Nature B.V. 2018
Abstract
In this study, CdTeS nanocrystals, which are known as quantum dots, were col-loidally synthesized in water-dispersible form. Analysis and characterization of the obtained nanocrystals were carried out by UV–Vis and fluorescence spectro-photometry, TEM, XRD, SEM–EDX, XRF, Raman spectroscopy and FTIR tech-niques. These particles have had facility of application in electronic and biologi-cal areas where they are used to detect some pollutants with sensor applications. Their fluorescence properties can be changed by interaction with some materials. The obtained CdTeS nanocrystals were used in the detection of heavy metal ions such as Cr(III), Mn(II), Ni(II), Zn(II), Pb(II), Hg(II), Cu(II), Ag(I), V(II), Cd(II), Co(II), Fe(II), Al(III), Sn(II) for designing optic sensors. According to the obtained findings, the highest quenching effect was observed in the presence of Cr(III) ions.
Keywords CdTeS nanocrystals · Quantum dots · Optic sensors · Fluorescence
spectroscopy
Introduction
Cr(III) ion is a heavy metal that is widely distributed in nature and the most common type of chromium ion. It widely exists in soils, water, rocks, and gases and has been used in various processing industries [1]. Chromium is also very important for body metabolism of humans as an essential element and vital nutrient that plays a key role in various biochemical phenomena [2–4]. However, an excess of Cr(III) ions leads to
Electronic supplementary material The online version of this article (https ://doi.org/10.1007/s1116 4-018-3615-6) contains supplementary material, which is available to authorized users.
* Canan Baslak
[email protected]; [email protected]
1 Science Faculty, Chemistry Department, Selcuk University, Campus, 42075 Selcuklu, Konya,
toxic effects in the human body and it can cause many diseases such as cancer and destruction of the nervous system [5, 6]. Because of their psychological and toxic effects, determination of amounts of Cr(III) ions have a great importance [7].
Most analytical methods such as chromatography [8], spectrophotometry [9–11], electrochemical methods [12], flame atomic absorption spectrometry [13, 14], induc-tively coupled plasma-atomic emission spectrometry (ICP-AES) [15], inductively cou-pled plasma mass spectrometry (ICP-MS) [16] are used to detect Cr(III) ions. However, the high cost of analyzing and the complicated techniques are an important problem of many research laboratories.
Among the known analytical techniques, fluorescence spectroscopy is generally pre-ferred due to its ease of application, study in low concentration and exact result [17]. For this reason, many organic dyes and fluorescent molecules have been used to detect chromium ion species [18, 19]. In this context, fluorogenic and chromogenic types of sensors are made for detection of these type of heavy metal ions [19–23]. For exam-ple, Mao et al. [24] synthesized a rhodamine-based probe (RC) to recognize and deter-mine Cr(III) at biological pH value in aqueous solution, depending on a fluorescence “off–on” mode. In another work, Afshani et al. [25] developed a fluorescence sensor based on imino-crown ether for the determination of chromium and mercury ions.
The detection techniques are limited by some problems such as photobleaching effect, broad photoluminescence (PL) emission bands, aggregation phenomenon and low signal intensities of fluorescent molecules [19]. These problems do not occur when nanoparticles are used for this type of study. This is because nanoparticles have more superior properties such as long-life and high photostability, narrow pho-toluminescence emission bands and large absorption area [26–28]. Sensor studies based on nanoparticles have been generally performed due to attractive sensing pur-poses [29–31]. Elavarasi et al. [32] developed a fluorescence-based method for the determination of both Cr(III) and Cr(VI) forms of chromium in aqueous solutions using unmodified gold nanoparticles. However, the use of fluorescence quantum dots is rarely studied for detection of chromium in the literature [33–35].
In this work, CdTeS nanocrystals, which are known as quantum dots, were colloi-dally synthesized in water-dispersible form. The analysis and characterization of the obtained quantum dots were carried out by UV–Vis and fluorescence spectroscopy, TEM, XRD, SEM–EDX, XRF, Raman spectroscopy and FTIR techniques. Because these particles have fluorescence properties, the obtained CdTeS nanocrystals were used to detect heavy metal ions such as Cr(III), Mn(II), Ni(II), Zn(II), Pb(II), Hg(II), Cu(II), Ag(I), V(II), Cd(II), Co(II), Fe(II), Al(III), Sn(II) in development of optic sensors. According to the obtained findings, the highest quenching effect was observed in presence of Cr(III) ions.
Experimental Chemicals
Sodium borohydride (NaBH4, 99.99%), cadmium chloride (CdCl2·5/2H2O,
potassium hydroxide (KOH), ethanol (99.5%) and propanol (99.9%) were obtained from Sigma-Aldrich.
The metals used for the fluorescence sensor; As salts of silver nitrate (AgNO3),
aluminum sulfate hexadecahydrate ((Al2(SO4)3·16H2O), cobalt(II) chloride (CoCl2),
nickel(II) sulfate (NiSO4), cadmium(II) nitrate (Cd(NO3)2), chromium(III) nitrate
(Cr(NO3)3 and iron(III) chloride (FeCl3), cupper(II) nitrate (Cu(NO3)2), mercury(II)
nitrate (Hg(NO3)2), manganese(II) sulfate (MnSO4), lead(II) nitrate (Pb(NO3)2), tin(II)
chloride (SnCl2·2H2O), vanadium(II) sulfate (VSO4), zinc (II) nitrate (Zn(NO3)2)
sup-plied from Sigma-Aldrich.
Synthesis of QD
Nanocrystal syntheses have been performed based on the previous method given in the literature [36, 37]. In these reactions, 3-mercaptopropionic acid (MPA), which is shown in Fig. 1, is used as the surfactant. As a source of cadmium, water-soluble cad-mium chloride salt has been used. Te powder and sulfur (thiourea) were used as anionic initiators.
Colloidal solutions of 10 mg/mL were firstly prepared in Millipore pure water as stock. This stock solution was diluted to 0.05 mg/mL CdTeS nanocrystal solutions with distilled water.
Apparatus and characterization and sensor process
A WiseStir magnetic stirrer was used for solution preparation and pH adjustment. Many devices have been used in the characterization of the obtained nanocrystals. A Bruker New Advance D8, Rigaku X-ray Diffractometer-Small Angle X-ray Scatter-ing (XRD-SAXS), Jeol Mark Transmission Electron Microscope (TEM), ScannScatter-ing Electron Microscope–Energy Dispersive X-Ray Analyzer (SEM–EDX), X-ray fluores-cence spectroscopy (XRF), Raman spectroscopy and Fourier transform infrared (FT-IR) spectroscopy were used for the structural characterization of the crystals. ZEISS brand EVO/LS10 model scanning electron microscope (SEM) and Bruker 123 eV EDX (Energy Dispersive X-Ray Analyzer) detector were used for elemental analysis of the crystals. For elemental analysis, Rigaku Nexcg model X-ray fluorescence spectros-copy (XRF) was also used. X-rays created by using aluminum, molybdenum, copper and RX9 targets were used for XRF measurements. Also, for analysis of the crystals, A RENISHAW inVia Confocal Raman Spectrometer was used. The measurements were taken by 532 nm wavelength green light laser and in wave number range from 120 to 800 cm−1 Raman shift. FT-IR spectra were acquired using BRUCKER FT-IR
spectrometer.
Fig. 1 Structure of 3-mercapto-propionic acid (MPA)
A 365 nm wavelength UV lamp was used to demonstrate that they emit fluo-rescence by stimulating nanocrystals. Optical absorption measurements were per-formed on a Biochrom Libra S22 UV–Vis spectrophotometer and photolumines-cence measurement and sensor studies were performed on a HITACHI F-7000 fluorescence spectrophotometer.
Heavy metal ions such as Cr(III), Mn(II), Ni(II), Zn(II), Pb(II), Hg(II), Cu(II), Ag(I), V(II), Cd(II), Co(II), Fe(II), Al(III), Sn(II) have been used as quenchers for fluorescence quenching studies. From the salts of these ions 10−3 M stock standard
solutions were prepared in distilled water.
Quenchers were added to CdTeS nanocrystals in different volume amounts (100–1000 μL) and changes in the fluorescence intensity of the nanocrystals were observed. All work was carried out at room temperature (25 ± 1 °C).
Results and discussion Properties of nanocrystals
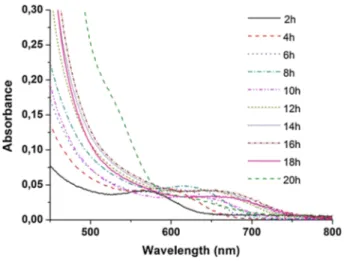
Figure 2 shows the absorption spectra of MPA-coated CdTeS nanocrystals taken from reaction media at different reflux times. As the reaction time progressed from 2 to 20 h, the absorption wavelength of the crystals increased from about 560 nm to about 680–700 nm. As understood from this, the particle size of the crystals increased. In Fig. 3, the fluorescence spectrum of the aqueous solutions of CdTeS nanocrystals was obtained and when solutions were excited by the UV lamp, and the emission colors are visible. As the reaction progressed, the emission of the particles shifted from 600 to near 750 nm (near the infrared region).
For the 2-h synthesis, the fluorescence peak half-wave width was narrower than around 50 nm or even 50 nm, while the half-wave peak width of the fluorescence
peaks with the progressive reaction time showed a small increase, and the peaks were obtained very symmetrically and sharply (Fig. 3). It is possible to grow alloyed quan-tum nanocrystals to higher wavelengths than the binary core particles forming it. As can be seen from the figures, MPA-coated nanocrystals appear to give wide bands slid-ing to long wavelengths. It is believed that such broad bands are related to the chain length of the surfactants present in the crystal surface. The reason for the broad bands, which are usually formed in the fluorescence spectrum, can be explained by the atomic holes that form on the surface of the crystals.
It can be easily understood from the fluorescence spectrum that there are atomic holes on the surface, although it is not clear in the absorption spectrum. When long-chain surfactants are used for synthesis of crystals, the reactions are faster and the pos-sibility of defect on the crystal surface is higher. The results of the structural characteri-zation are in the Supplementary Information File (Figure S1, S2, S3, S4, S5 and S6) [38–42].
Results of fluorescence sensor operation
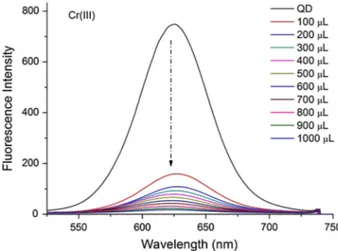
In this study, as can be seen in Fig. 4, the most quenching was obtained for Cr(III) ions. According to these results, selectivity was obtained only for Cr(III) ions in a series of heavy metal ions [1]. In the experiments performed in aqueous solutions, the spectra as seen in Figure S7 were obtained (Figure S7 is in Supplementary Information File).
For the calculation of the quenching constant, the following Stern–Volmer equation is used (Eq. 1):
(1)
F0
F = 1 +KSV[Q]
F0 ve F exhibit fluorescence intensities when quencher is absent and present. KSV
Stern–Volmer quenching constant while [Q] shows the quencher concentration, respectively. Figure 5 shows the Stern–Volmer graph drawn according to Eq. 1 for the CdTeS solution when Cr(III) is added in different amounts.
As can be seen in the Stern–Volmer graph, a linear increase is observed for Cr(III) (Fig. 5). By plotting the fluorescence intensity changes against the metal ions, the column graph shown in Fig. 6 was obtained.
The limit of detection (LOD) for Cr(III) ions is calculated, and the value of LOD for Cr(III) ions is 2.0 μg L−1.
Fig. 4 Influence of Cr(III) ions on the fluorescence intensity of CdTeS nanocrystals
Fig. 5 Stern–Volmer graph obtained when Cr(III) was added in different amounts on 0.05 mg/mL CdTeS (y = 78.22x + 0.7983)
Conclusions
As can be seen from these graphs, the maximum quenching and change in fluores-cence intensity occurs for Cr(III) ions. The Stern–Volmer graph drawn by using Eq. 1 shows a linear increase for Cr(III) (Fig. 5). The Stern–Volmer graph for the Cr(III) ions and the quenching constant (KSV) calculated from the equation were found to be 78.22. As is clear from the results, collision (collisional-dynamic) quenching occurs according to Stern–Volmer curve.
Acknowledgements This work was supported by Selcuk University Coordination Scientific Research Projects Unit. Project No: BAP-15401113.
References
1. J. Han, X. Bu, D. Zhou, H. Zhang, B. Yang, RSC Adv. 4, 32946 (2014)
2. E. Leese, J. Morton, P.H.E. Gardinerb, V.A. Carolan, J. Anal. At. Spectrom. 31, 924 (2016) 3. M. Wang, J. Wang, W. Xue, A. Wu, Dyes Pigm. 97, 47 (2013)
4. H. Wu, P. Zhou, J. Wang, L. Zhao, C. Duan, New J. Chem. 33, 653 (2009) 5. L.V. Tan, T.Q. Hieu, N.V. Cuong, J. Anal. Methods Chem. 2015, 1 (2015) 6. F. Hu, B. Zheng, D. Wang, M. Liu, J. Du, D. Xiao, Analyst 139, 3607 (2014) 7. A. Saini, A.K.K. Bhasin, N. Singh, N. Kaur, New J. Chem. 40, 278 (2016) 8. Q. Hu, G. Yang, J. Yang, J. Yin, J. Environ. Monit. 4, 956 (2002)
9. L.G. Danielsson, B. Magnusson, S. Westerlund, Anal. Chim. Acta 98, 47 (1978) 10. U. Divrikli, A.A. Kartal, M. Soylak, L. Elci, J. Hazard. Mater. 145, 459 (2007) 11. M. Sperling, S. Xu, B. Welz, Anal. Chem. 64, 3101 (1992)
12. W. Lorenz, F. Mansfeld, Corros. Sci. 21, 647 (1981)
13. M. Soylak, S. Saracoglu, U. Divrikli, L. Elci, Talanta 66, 1098 (2005)
14. R. Cespon-Romero, M. Yebra-Biurrun, M. Bermejo-Barrera, Anal. Chim. Acta 327, 37 (1996) 15. J.K. Huber, Analyst 124, 657 (1999)
16. H. Gürleyük, D. Wallschläger, J. Anal. At. Spectrom. 16, 926 (2001)
17. S.J. Toal, K.A. Jones, D. Magde, W.C. Trogler, J. Am. Chem. Soc. 127, 11661 (2005) 18. J. Sun, J. Zhang, Y.D.J. Yin, Mater. Chem. C 1, 138 (2013)
19. L.Y. Wang, L. Wang, T.T. Xia, L. Dong, G.R. Bian, H.Q. Chen, Anal. Sci. 20, 1013 (2004) 20. M. Zhao, L. Mab, M. Zhang, W. Cao, L. Yang, L.J. Ma, Spectrochim. Acta A Mol. Biomol.
Spec-trosc. 116, 460 (2013)
21. D. Karak, A. Banerjee, A. Sahana, S. Guha, S. Lohar, S.S. Adhikari, D. Das, J. Hazard. Mater. 188, 274 (2011)
22. A.Y. Obalı, M.S. Yilmaz, H.I. Ucan, J. Mol. Struct. 10(5), 192 (2017)
23. M. Sulak, A.N. Kursunlu, B. Girgin, O.O. Karakus, E. Guler, J. Photochem. Photobiol. A 349, 129 (2017)
24. J. Mao, Q. He, W. Liu, Anal. Bioanal. Chem. 396, 1197 (2010)
25. J. Afshani, A. Badiei, M. Karimi, N. Lashgari, G.M. Ziarani, J. Fluoresc. 26, 263 (2016) 26. X.F. Zhang, Z.G. Liu, W. Shen, S. Gurunathan, Int. J. Mol. Sci. 17(9), 1534 (2016) 27. H. Montón, C. Nogués, E. Rossinyol, O. Castell, M. Roldán, J. Nanobiotechnol. 7, 4 (2009) 28. M. Stanisavljevic, S. Krizkova, M. Vaculovicova, R. Kizek, V. Adam, Biosens. Bioelectron. 74, 562
(2015)
29. L. Zhao, Y. Jin, Z. Yan, Y. Liu, H. Zhu, Anal. Chim. Acta 731, 75 (2012)
30. X. Zhang, X. Zhang, L. Tao, Z. Chi, J. Xu, Y.J. Wei, Mater. Chem. B 2, 4398 (2014) 31. J. Liu, L. Zhang, C. Wang, H. Xu, X. Zhao, Mol. BioSyst. 6, 954 (2010)
32. M. Elavarasi, A.A. Sruthi, N. Chandrasekaran, A. Mukherjee, Anal. Methods 6, 9554 (2014) 33. P.T. Burks, A.D. Ostrowski, A.A. Mikhailovsky, E.M. Chan, P.S. Wagenknecht, P.C. Ford, J. Am.
Chem. Soc. 134(32), 13266 (2012)
34. D. Neuman, A.D. Ostrowski, A.A. Mikhailovsky, R.O. Absalonson, G.F. Strouse, P.C. Ford, J. Am. Chem. Soc. 130(1), 168 (2008)
35. F. Shi, Y. Zhang, W. Na, X. Zhang, Y. Li, X.J. Su, Mater. Chem. B 4, 3278 (2016) 36. C. Baslak, M. Kus, Y. Cengeloglu, M. Ersoz, J. Lumin. 153, 177 (2014) 37. C. Baslak, G. Arslan, M. Kus, Y. Cengeloglu, RSC Adv. 6(22), 18549 (2016)
38. P. Kunstman, J. Coulonc, O. Kolmykova, H. Moussaa, L. Baland, G. Medjahdie, J. Lulekb, R. Sch-neider, J. Lumin. 194, 760 (2018)
39. N. Piven, A.S. Susha, M. Döblinger, A.L. Rogach, J. Phys. Chem. C 112, 15253 (2008) 40. M. Ligang, W. Zelu, Z. Fengming, W. Xiaoshan, Superlattices Microstruct. 88, 536 (2015) 41. L. Xi, K.H. Chua, Y. Zhao, J. Zhang, Q. Xiong, Y.M. Lam, RSC Adv. 2, 5243 (2012)
42. Y. Medina-Gonzalez, W.Z. Xu, B. Chen, N. Farhanghi, P.A. Charpentier, Nanotechnology 22, 065603 (2011)