Importance of Delphian Lymph Node Evaluation in
Autoimmune Thyroiditis: Fact or Fiction?
Tugrul Ormeci
1ABCDEF, Mukaddes Çolakoğulları
2ABCDEF, İsrafil Orhan
3ABCDEF
1
Department of Radiology, Medipol University, Istanbul, Turkey
2
Department of Medical Biochemistry, Medipol University, Istanbul, Turkey
3Department of Otorhinolaryngology, Sütçü İmam University, Kahramanmaraş, Turkey
Author’s address: Tugrul Ormeci, Department of Radiology, Medipol University, Istanbul, Turkey,
e-mail: [email protected]
Summary
Background:
Our main objective was to evaluate the association between autoimmune thyroiditis and the Delphian lymph node during different stages of thyroiditis.Material/Methods:
The relationships between the ultrasonography (US) results of thyroiditis and characteristics of the Delphian lymph node in different stages of AT were evaluated. Thyroid hormone and antibody levels were assessed. A total of 126 patients were divided into four groups according to the thyroid US findings: Group 1: control cases; Group 2: indeterminate cases; Group 3: established thyroiditis cases; Group 4: advanced-late stage thyroiditis cases.Indeterminate cases attended a 1-year follow-up, and the cases with a sonographic finding matching thyroiditis formed Group 2.
Results:
The rate of Delphian lymph node presence in Group 4 was significantly higher than in Groups 1 and 2 (p<0.01). In addition, its presence was significantly higher in Group 3 than in Group 1 (p<0.05). Although there was a difference in Delphian lymph node presence between Groups 2 and 3, it was not significant (p=0.052), nor was there a significant difference between Groups 1 and 2 (p>0.05). Both the long and short axis measurements were significantly higher in Groups 2, 3, and 4 compared to those in the control group. However, the same increase was not observed in the long/ short axis ratio.Conclusions:
Both the presence and dimensions of the Delphian lymph node were highly correlated with the progress of autoimmune thyroiditis. Evaluating the Delphian lymph nodes might prevent missing a diagnosis of autoimmune thyroiditis.MeSH
Keywords: Local Lymph Node Assay • Thyroiditis, Autoimmune • Ultrasonography, Doppler, Color
PDF fi le: http://www.polradiol.com/abstract/index/idArt/895761
Received: 2015.08.24 Accepted: 2015.09.16 Published: 2016.02.26
Background
The Delphian lymph node (DLN) is the highest of the cen-tral (level 6) cervical lymph nodes. The classic DLN is ascribed to one or more lymph nodes above the isthmus of the thyroid gland between the cricoid and thyroid cartilage, although it also includes any midline node placed over the cricothyroid membrane, cricoid cartilage, or that lies ante-rior to the lower half of the thyroid cartilage [1,2].
Many reports show the involvement of the DLN in head-neck malignancies. These reports suggest that these lymph nodes are important during surgery and for the prognosis of thyroid, laryngeal, and glottis tumours [3–6].
Involvement of the DLN in autoimmune thyroiditis (AT) has gained wide acceptance, although it has been mentioned only superficially in some reference books [7,8]. Despite this common knowledge, an insufficient number of stud-ies have demonstrated an association between AT and the DLN. Some studies discuss the coexistence of subacute Authors’ Contribution: A Study Design B Data Collection C Statistical Analysis D Data Interpretation E Manuscript Preparation F Literature Search G Funds Collection O R I G I N A L A R T I C L E
DOI: 10.12659/PJR.895761
thyroiditis and the central cervical lymph node [9] and the coexistence of various AT stages and cervical lymph nodes [10]. However, that study did not include indetermi-nate cases, which may be an early phase of AT, as discussed in our study.
The diagnosis of AT is based on clinical findings and labora-tory tests, such as elevated thyroglobulin antibody (Tg Ab) and thyroid peroxidase antibody (TPO Ab). However, anti-thyroid antibodies can be negative in cases of anti-thyroiditis, as evidenced by a histological examination [11]. Some authors advocate use of ultrasonography (US) in cases of AT [12,13], whereas it was found to be useless by other authors [14]. The combination of US with clinical and serological assess-ments significantly improves sensitivity and specificity for diagnosing AT [15,16]. In addition, sonography is a non-invasive modality that provides information about the level of inflammatory activity [17] and the severity of thyroidi-tis [18].
The sonographic characteristics of AT are well defined and used during routine US examinations. However, some cases of early thyroiditis present with very superficial and subtle sonographic findings, making it extremely difficult to con-firm the thyroiditis diagnosis in these early cases by look-ing only at the US characteristics of the gland.
This study evaluated the association between autoimmune thyroiditis and the Delphian lymph node during different stages of thyroiditis.
Material and Methods
This study was approved by the university Ethics Committee. This study was conducted with 126 cases (90 females and 36 males) between June 2012 and February 2014. Among the patients referred for US evaluation, pregnant and breastfeeding women, paediatric cases and patients who had undergone surgery, and those with a known malignancy, short neck, marked goitre, thyroid
nodules, and cases with a recent history of viral or bacte-rial infection were excluded.
All patients underwent physical and US evaluations and laboratory tests. The cases were evaluated by a single radi-ologist who was blinded to the laboratory data.
The laboratory tests included free triiodothyronine (fT3), free thyroxine (fT4), thyroid-stimulating hormone (TSH), TPO Ab, and Tg Ab levels.
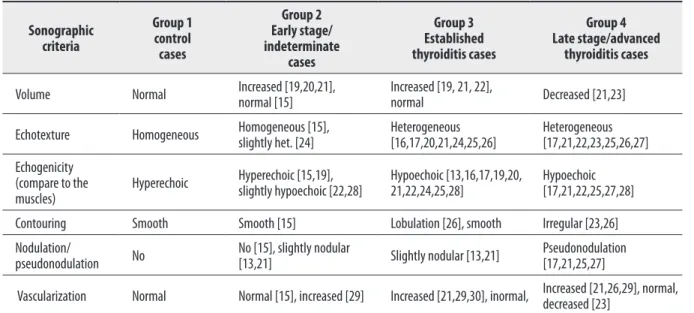
The histopathological findings and sonographic fea-tures in different stages of autoimmune thyroiditis have been reported and are used routinely in clinical practice [13,15–17,19–30] (Table 1). Diffuse enlargement, parenchy-mal hypoechogenicity and coarsening [13,16,19,21,25,30], diffuse reduction of echogenicity (compared to the sur-rounding muscles) [13,16,21,25,30], echogenic interlobu-lar septation on the heterogeneous hypoechoic basement, and a diffuse micronodular pattern [13,16,19,21,25,30] have been observed in patients with thyroiditis. Thyroid gland vascularity increases with the stage of thyroidi-tis [13,16,20,21,25,30]. As the disease advances, the septa increase in extent and become more echogenic, paren-chymal heterogeneity increases, and contour lobulation deepens. Pseudonodulation and gland shrinkage are also observed (Table 1).
According to Gutekunst et al., 5.4% of Hashimoto’s thy-roiditis cases have normal US findings [15]. Langer et al. reported that the variety in the sonographic features of AT match the phase and severity of the disease [24]. In a study of 2,267 cases, Kim et al. study evaluated different diffuse thyroid diseases, including Hashimoto’s thyroiditis, using echogenicity (iso-, hypo-, marked hypo-, hyperechoic), echo texture (fine, coarse, micronodular), dimensions and con-tour properties (smooth, macrolobular, microlobular) of the gland [26]. Willms et al. argued that it is possible to diag-nose Hashimoto’s thyroiditis from the sonographic findings and that these findings can be used to follow the disease.
Sonographic
criteria
Group 1
control
cases
Group 2
Early stage/
indeterminate
cases
Group 3
Established
thyroiditis cases
Group 4
Late stage/advanced
thyroiditis cases
Volume
Normal
Increased [19,20,21],
normal [15]
Increased [19, 21, 22],
normal
Decreased [21,23]
Echotexture
Homogeneous
Homogeneous [15],
slightly het. [24]
Heterogeneous
[16,17,20,21,24,25,26]
Heterogeneous
[17,21,22,23,25,26,27]
Echogenicity
(compare to the
muscles)
Hyperechoic
Hyperechoic [15,19],
slightly hypoechoic [22,28]
Hypoechoic [13,16,17,19,20,
21,22,24,25,28]
Hypoechoic
[17,21,22,25,27,28]
Contouring
Smooth
Smooth [15]
Lobulation [26], smooth
Irregular [23,26]
Nodulation/
pseudonodulation
No
No [15], slightly nodular
[13,21]
Slightly nodular [13,21]
Pseudonodulation
[17,21,25,27]
Vascularization
Normal
Normal [15], increased [29]
Increased [21,29,30], inormal, Increased [21,26,29], normal,
decreased [23]
Table 1. Sonographic features of the groups.
They developed the VESINC system (volume, echogenicity, sonographic texture, pseudo-nodular hypoechoic infiltra-tion, nodule presence, and cyst presence) to classify dif-ferent sonographic properties of the gland [17]. Except for nodule and cyst presence, the parameters of the other sono-graphic criteria were the same as those used in our study. We did not include cases with nodules since we did not evaluate the histopathology.
Our study used the sonographic criteria defined in the liter-ature for Hashimoto’s thyroiditis (Table 1), including those of Kim et al., Gutekunst et al., and Willms et al., to define the sonographic criteria of our cases to clarify the histo-pathological progression of the disease and its sonographic consequences [15,17,26].
Size, contour (regular or irregular), echo texture (homo-geneous or hetero(homo-geneous), echogenicity (hypoechoic or hyperechoic), presence of nodules or pseudo-nodules, thy-roid gland vascularity (decreased, normal, or increased), and the DLN (long- and short-axis diameters; long-axis/
short-axis ratios; absence or presence of the hilum) were evaluated by Doppler sonography (LOGIQ P6 Pro, GE Healthcare, Mannheim, Germany) with a linear 11 MHz probe, with the patients in a supine position with neck hyperextension.
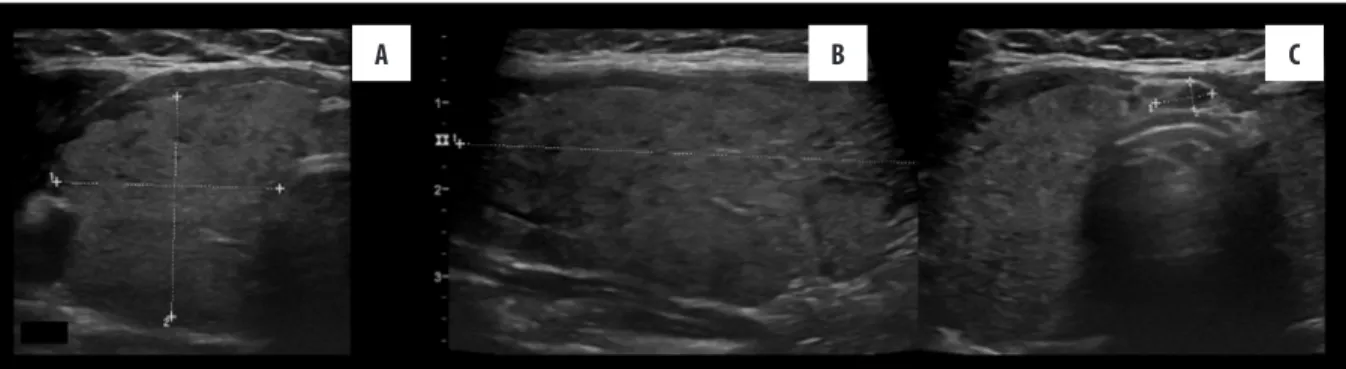
The patients were divided into four groups according to the US findings, which are defined above: 1-control cases, 2-indeterminate cases, 3-established thyroiditis cases, and 4-advanced-late stage thyroiditis cases. Group 1 (control cases) consisted of cases with normal US, clinical, and lab-oratory findings (Figure 1). Group 2 (indeterminate cases) comprised cases that were decided based on detecting early thyroiditis on a sonographic examination (Figure 2). Group 3 (established thyroiditis cases) consisted of cases with decreased parenchymal echogenicity, nonhomogeneous echo texture, and echogenic interlobular septa (Figure 3). Group 4 (advanced-late stage thyroiditis cases) was com-posed of cases with a more hypoechoic parenchyma and a marked nonhomogeneous echo texture, irregular contour, pseudo-nodules, and reduced size (Figure 4).
Figure 1. (A, B) Normal sonographic findings in Group 1 (control group).
A
B
Figure 2. Patients in Group 2 (indeterminate cases) had normal laboratory thyroid hormone levels (A) on longitudinal ultrasonography (US);
thus, it is difficult to say whether the parenchyma is slightly micronodular or not. No other US features of thyroiditis are seen, and gland
vascularity (not shown here) is normal (B), Delphian lymph node with a regular contour, oval shape, and hypoechoic is seen above the
isthmus but the echogenic hilum cannot be easily seen.
Groups 3 and 4 were combined to make a definite thy-roiditis group to compare between the control cases and AT cases. Clinical, laboratory, and radiological 1-year fol-low-ups were performed to clarify the indeterminate cases. At the beginning of the study, 49 cases were considered indeterminate based on sonographic characteristics. These cases were followed up; however, seven patients did not attend the 1-year follow-up visit. Among 42 cases, 33 with confirmed thyroiditis at the sonographic follow-up were included in the study as Group 2.
Electrochemiluminescence immunoassay kits were used to measure the fT3, fT4, TSH, Tg Ab, and TPO Ab levels. Statistical analyses were performed using Number Cruncher Statistical System 2007 & PASS 2008 Statistical Software (Kaysville, UT, USA). In addition to descriptive statistics (mean, standard deviation, median, frequency, ratio, and range), one-way analysis of variance was used to compare three or more groups with normally distribut-ed data. Tukey’s HSD test was usdistribut-ed to identify differenc-es. The Kruskal–Wallis test was used to compare three or more groups with data that were not normally distributed, and the Mann-Whitney U-test was used to detect differ-ences. Pearson’s chi-square test, Fisher’s exact test, Fisher-Freeman-Halton test, and Yates Continuity Correction test (chi-square with Yates correction) were used to compare qualitative data. Spearman’s correlation analysis was used to evaluate the relationship between parameters. A p<0.05 was considered significant.
Results
Study group characteristics
The mean age of the study subjects was 38.21±12.51 years (range, 18–73 years) (Table 2).
Of the patients, 71.4% were female (n=90) and 28.6% were male (n=36). Of the cases, 24% (n=30) were control cases (Group 1), 26% (n=33) were indeterminate cases (Group 2), 19% (n=24) were established thyroiditis cases (Group 3), and 30% (n=39) were advanced-late stage cases (Group 4).
Characteristics of the thyroid gland and Delphian lymph nodes
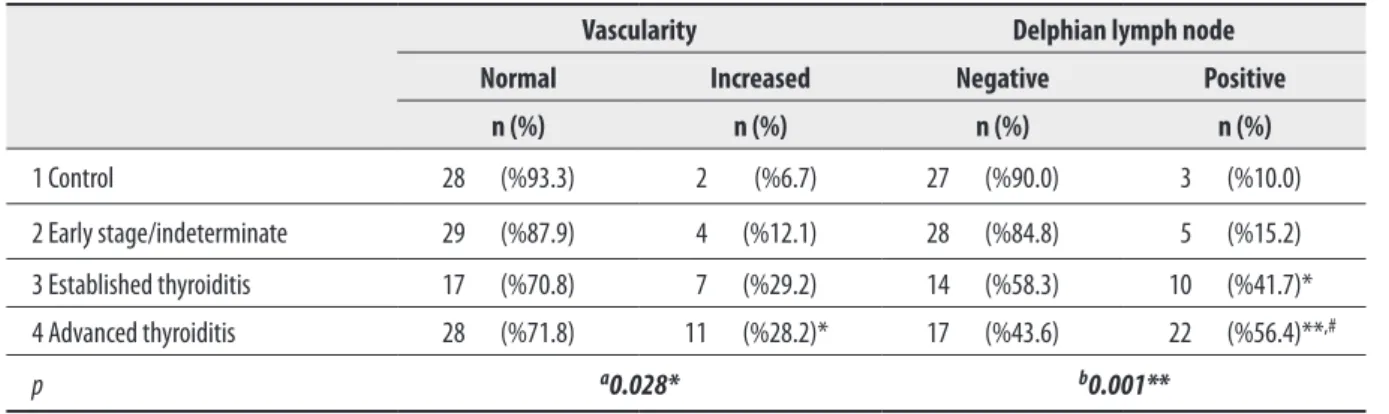
A significant difference was observed between the DLN detection rates of the groups (Pearson’s chi-square test, p=0.001) (Table 3).
The Delphian lymph node was found significantly more fre-quently in Group 4 than in Groups 1 and 2 (p<0.01) and significantly more frequently in Group 3 than in Group 1 (p<0.05). Although there was a difference between Groups 2 and 3, it was not significant. There was no significant dif-ference between Groups 1 and 2 (p>0.05).
Both the long and short axis measurements were signifi-cantly higher in Groups 2, 3, and 4 than those in the con-trol group (Mann-Whitney U-test; long axis: p=0.035, 0.028, and 0.007, respectively; short axis: 0.025, 0.014, and
Figure 3. Features of the thyroid glands in Group 3 (established thyroiditis), (A, B) show increased gland size, slightly irregular contour, and reduced
gland echogenicity (C), a more prominent Delphian lymph node is shown.
A
B
C
Figure 4. Group 4 cases (advanced-late stage thyroiditis). (A) Gland size is reduced and an irregular contour is more evident. Gland echogenicity is
reduced in a patchy fashion and even in a slightly pseudonodular form. (B) Gland vascularity increased minimally and in (C), Delphian
lymph node is seen clearly.
0.006, respectively). However, the same increase was not observed in the long/short axis ratio of the DLN (Table 4). The mean diameter of the long axis in the definite thy-roiditis group (Groups 3 and 4) was 6.5±1.8 mm. The mean diameter of the short axis was 2.7±0.7 mm, and the mean
ratio of the long-to-short-axis was 2.3±0.4. The diameter of the long axis was 2.2-fold higher and the diameter of the short axis was 1.9-fold higher in patients diagnosed with definite thyroiditis when the average DLN diameter was considered, compared with those in the control group.
N
Age
Gender
fT3
fT4
TSH
TG Ab
TPO Ab
1 Control case
30
16 F (%53.3)
14 M (%46.7)
Min-Max
(median)
2.14–3.60
(3)
0.92–1.93
(1.18)
0.45–9.59
(1.73)
10.0–58.4
(17)
5.0–63.5
(5.87)
Mean ±SD
35.60±11.60
2.99±0.42
1.23±0.25
2.11±1.69
18.97±10.88 10.8±13.37
2 Early stage/
indeterminate
cases
33
22 F (%66.7)
11 M (%33.3)
Min-Max
(median)
1.60–3.89
(3.18)
0.0–2.19
(1.24)
0.02–65.0
(1.72)
10.0–42.28
(20.15)
5–238
(7.98)
Mean ±SD
36.73±11.69
3.07±0.48
1.17±0.42
4.06±11.3
22.12±9.11 23.85±53.05
3 Established
thyroiditis cases
24
20 F (%83.3)
4 M (%16.7)
Min-Max
(median)
2.17–18.66
(2.99)
0.84–4.45
(1.04)
0.005–13.65
(5.5)**
,#14.24–1262.0
(353)**
,#(51.45)**
5–600
,#Mean ±SD
37.96±14.31
4.78±5.01
1.31±0.85
5.6±4.17
338.72
±349.93
±235.39
209.76
4 Late stage/
advanced
thyroiditis cases
39
32 F (%82.1)
7 M (%17.9)
Min-Max
(median)
2.15–7.58
(2.83)
0.30–13
(1.16)
0.005–100
(3.06)
16–1151
(128)
5–2550
(276)
Mean ±SD
37.87±11.55
3.22±1.14
1.49±2.02
10.58±23.9
235.39
±265.89 **
,#±512.11 **
376.24
,#p
Kruskal-Wallis
Test
a0.001**
b0.031
0.421
0.159
0.001**
0.001**
0.001**
Table 2. Characteristics of the subjects.
** p<0.01 compared to Control group by using Mann-Whitney U Test;
#p<0.01 compared to Indeterminate group by using Mann-Whitney U Test;
aOne-way ANOVA Test;
bPearson Chi-Square Test, ** p<0.01, * p<0.05.
Vascularity
Delphian lymph node
Normal
Increased
Negative
Positive
n (%)
n (%)
n (%)
n (%)
1 Control
28 (%93.3)
2 (%6.7)
27 (%90.0)
3 (%10.0)
2 Early stage/indeterminate
29 (%87.9)
4 (%12.1)
28 (%84.8)
5 (%15.2)
3 Established thyroiditis
17 (%70.8)
7 (%29.2)
14 (%58.3)
10 (%41.7)*
4 Advanced thyroiditis
28 (%71.8)
11 (%28.2)*
17 (%43.6)
22 (%56.4)**
,#p
a0.028*
b0.001**
Table 3. Assessment of DLNs and gland vascularity according to the groups .
a
Fisher-Freeman-Halton Test;
bPearson Chi-SquareTest, * p<0.05, ** p<0.01. * p<0.01 compared to Control group by using Mann -Whitney U Test;
The DLN detection rate was extremely low in the control group (10%), as expected; thus, the cut-off value, sensitiv-ity, and specificity could not be calculated.
An assessment of the hilum could not be performed due to the small size of the DLN. A significant difference in vascu-larisation of the parenchyma was observed between groups 1 and 4 (Yates’ Continuity Correction Test, p=0.049). A trend for increased vascularity of the thyroid gland was observed from control patients toward cases with definite thyroiditis (established [Group 3] and advanced-late thy-roiditis [group 4]) (6.7%, 12.1%, 29.2%, and 28.2%, respec-tively) (Table 3).
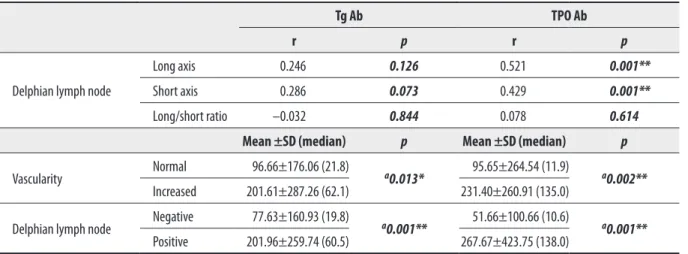
No significant differences in Tg Ab or TPO Ab levels were observed between the indeterminate and control cases (Table 2). Patients with DLN had significantly higher Tg Ab and TPO Ab levels than the patients without DLN (p=0.001, Mann-Whitney U-test).
A positive correlation was observed between the long and short axis of the DLN and TPO Ab level (TPO Ab increased with increasing DLN long axis and short axis measure-ments) (long axis: r=0.521; p=0.001; short axis: r=0.429; p=0.001) (Table 5). No association was observed between the long axis/short axis ratio of the DLN and TPO Ab level (Table 5).
Tg Ab and TPO Ab levels in cases with increased vascular-ity were significantly higher than those with normal vascu-larity (p=0.013 and p=0.002, respectively, Mann-Whitney U-test) (Table 5).
Discussion
Autoimmune thyroiditis develops as a result of lymphocytic infiltration into the thyroid gland. This infiltration destroys the parenchyma, resulting in decreased US echogenic-ity [28]. Several studies have indicated that US predicts parenchymal inflammation and destruction of the thyroid gland [31]. Rago et al. suggested that use of US in the early stages may help predict future development of thyroid dysfunction more readily than using thyroid autoantibod-ies [32]. However, it could be difficult to assess decreased echogenicity and coarsening or micronodulation of the echotexture in early cases of suspected AT (our early stage or indeterminate cases) and eventually reach a conclusion on involvement of the thyroid gland only by looking at the sonographic data.
A radiologist would like to refer to other thyroid gland characteristics, such as vascularity and serum thyroid anti-bodies. Gutekunst et al. argued that it is possible for expe-rienced radiologists to diagnose AT using high-resolution sonographic equipment despite the fact that the thyroid structures might be seen as normal [15].
According to our data, DLN dimensions increase during the early stage of thyroiditis but vascularity and serum anti-bodies did not increase during this indeterminate phase. The Tg Ab and TPO Ab levels were elevated significantly when prominent thyroid gland heterogeneity and increased vascularisation were detected (Table 5). Therefore, evaluat-ing the DLN becomes important durevaluat-ing the early (indeter-minate) stage (Figure 2).
Sonography can give information about the level of inflam-matory activity [17] and thyroiditis severity [18]. As thy-roiditis progresses, evaluating the gland with DLN provides
Delphian lymph node
long axis
Delphian lymph node
short axis
Delphian lymph node
long/short ratio
1 Control cases
N
3
3
3
Min-Max (median)
2–4.1 (2.7)
1.2–1.8 (1.3)
1.54–2.28 (2.25)
Mean ±SD
2.93±1.07
1.43±0.32
2.02±0.42
2 Early stage/
indeterminate cases
N
5
5
5
Min-Max (median)
4.1–10.0 (5.3) *
1.9–4.0 (2.8) *
1.60–2.52 (2.29)
Mean ±SD
6.22±2.26
2.82±0.86
2.21±0.37
3 Established thyroiditis
cases
N
10
10
10
Min-Max (median)
3.5–9.6 (5.6) *
1.8–4.0 (2.4) *
1.84–2.91 (2.44)
Mean ±SD
6.06±2.09
2.50±0.71
2.41±0.42
4 Late stage/advanced
thyroiditis cases
N
22
22
22
Min-Max (median)
4.1–10.0 (6.6) **
1.8–4.4 (3.05) **
1.63–3.81 (2.27)
Mean ±SD
6.94±1.65
3.08±0.76
2.31±0.5
p (Kruskal-Wallis Test)
0.020*
0.011*
0.483
Table 4. Assessment of DLNs according to the groups .
Tg Ab
TPO Ab
r
p
r
p
Delphian lymph node
Long axis
0.246
0.126
0.521
0.001**
Short axis
0.286
0.073
0.429
0.001**
Long/short ratio –0.032
0.844
0.078
0.614
Mean ±SD (median)
p
Mean ±SD (median)
p
Vascularity
Normal
96.66±176.06 (21.8)
a0.013*
95.65±264.54 (11.9)
a0.002**
Increased
201.61±287.26 (62.1)
231.40±260.91 (135.0)
Delphian lymph node
Negative
77.63±160.93 (19.8)
a0.001**
51.66±100.66 (10.6)
a0.001**
Positive
201.96±259.74 (60.5)
267.67±423.75 (138.0)
Table 5. Correlations among the DLNs, gland vascularity and Tg Ab and TPO Ab.
r = Spearman Correlation Coefficient,
aMann-Whitney U Test, * p<0.05; ** p<0.01.
more information about the different stages of AT. In the present study, the DLN was detected in only three of 30 control patients (10%). The DLN detection rates were 15.1% for indeterminate cases, 41.6% for established thy-roiditis cases, and 56.4% for advanced-late stage thyroidi-tis cases. According to the current data, the DLN detection rate increases as thyroiditis becomes more established. Giovagnorio et al. also observed an increase in the rate of DLN detection with advancing thyroiditis stage [10]. In their study, no significant difference in lymph node size was found among the groups; however, the presence and number of DLNs differed significantly across groups [10]. We found significant differences in the presence of the DLN, which became more significant with advancing thy-roiditis stage (Tables 3, 4). By contrast, we found that long and short axis measurements were significantly high-er in Groups 2, 3, and 4 compared to those in the control group. No significant difference in DLN size was observed between the indeterminate and definite thyroiditis (Groups 3 and 4) cases. Therefore, measuring the DLN dimensions might aid in the diagnosis of early AT.
Some studies have reported a minimal axial diameter of 8 mm for reactive lymph nodes, except for the subdigastric and submandibular nodes [33]; however, there is no com-monly accepted lymph node size associated with AT. The mean values for the long axis and short axis in Groups 3 and 4 (definite thyroiditis) were 6.5±1.8 and 2.7±0.7 mm, respectively. As the DLN detection rate was extremely low in the control group (10%), as expected, the cut-off value, sensitivity, and specificity could not be calculated. This is a limitation of this study. We suggest a cut-off value for the DLN (long axis: 3.95; short axis: 1.55), although these val-ues are not significant.
Giovagnorio et al. reported a mean long-axis of 7.5±3.8 mm, a mean short-axis of 3.7±0.6 mm, and a mean ratio of the long/short axis of 2±0.3 mm. However, no significant differences among the groups were observed in the long/ short axis ratio of the DLN in our study [10].
According to the generally accepted notion, normal appear-ing cervical lymph nodes are typically oval in shape. Even cervical lymph nodes enlarged due to a benign inflam-matory condition retain their oval shape (long/short axis >2) [18,34]. Albeit statistically insignificant, the DLN long-to-short-axis ratio tended to increase from the con-trol group toward the indeterminate and definite thyroid-itis groups (Groups 3 and 4) (mean±standard deviation= 2.0±0.4; 2.2±0.4; 2.4±0.4, and 2.3±0.5 respectively), and the lymph node acquired a more oval configuration (Table 4). This finding corresponds to the pattern observed during long-term inflammatory events. Giovagnorio et al. reported a ratio of 1.7±0.5 in patients with a recent thy-roiditis diagnosis and 1.6±0.4 in patients already diagnosed with thyroiditis [10].
We observed an increasing trend in vascularity with the progress of thyroiditis. Vascularity increased only slightly in the indeterminate group, which was not helpful for the diagnosis. Increased thyroid gland vascularity in response to inflammation and antibody titres was more prominent in Groups 3 and 4 than those in the control and indetermi-nate groups.
Thyroid gland vascularity tended to increase between the control and intermediate case groups (6.7% and 12.1%, respectively); however, the difference was not significant; therefore, vascularity cannot be used as a marker. There were also noticeable differences among Groups 2, 3, and 4 (12.1, 29.2, and 28.2%, respectively); however, the differ-ences were not significant. Gland vascularity varies in AT cases and is generally associated with the development of hypothyroidism [29]. This is consistent with our findings showing that increased vascularity was more common in advanced stages of AT (Group 4).
The TPO Ab level is closely associated with cell-medi-ated cytotoxicity, whereas the Tg Ab is not [35]. TPO Ab level is representative of current AT activity and associ-ated destruction of the thyroid gland [36]. TPO Ab levels were significantly correlated with the presence of the DLN and with the DLN measurements (long- and short-axis) (Table 5).
With the progression of AT, increased lymphocytic infiltra-tion eventually causes cell destrucinfiltra-tion. Moreover, the TPO Ab levels, which are related to cell-mediated cytotoxicity, increase accordingly. As the disease advances, the inflam-matory response increases and this causes secondary sono-graphic changes (shown in Table 1). The increased inflam-matory response is mainly responsible for the increase in parenchyma vascularisation and DLN dimensions.
The main limitation of this study was the relatively small number of cases in the series.
Conclusions
A thorough assessment of the Delphian lymph node can give valuable information for the diagnosis of autoimmune thyroiditis. Its importance increases with progression of the disease, and it might help to avoid missing the diagno-sis during early stages of the disease when the laboratory results are inconclusive and sonographic results are rela-tively weak.
Conflict of interest
None.
1. Olsen KD, DeSanto LW, Pearson BW: Positive Delphian lymph node: Clinical significance in laryngeal cancer. Laryngoscope, 1987; 97: 1033–37
2. Thaler ER, Montone K, Tucker J, Weinstein GS: Delphian lymph node in laryngeal carcinoma: A whole organ study. Laryngoscope, 1997; 107: 332–34
3. Wierzbicka M, Leszczyńska M, Młodkowska A et al: The impact of prelaryngeal node metastases on early glottic cancer treatment results. Eur Arch Otorhinolaryngol, 2012; 269(1): 193–99 4. Modrzejewski M, Sieradzki A, Tomik J, Strek P: The clinical
significance of metastatic cancer of the larynx to the Delphi node. Otolaryngol Pol, 1996; 50(2): 156–61
5. Kim WW, Yang SI, Kim JH et al:Experience and analysis of Delphian lymph node metastasis in patients with papillary thyroid carcinoma. World J Surg Oncol, 2012; 10: 226
6. Ferlito A, Shaha AR, Rinaldo A: Prognostic value of Delphian lymph node metastasis from laryngeal and hypopharyngeal cancer. Acta Otolaryngol, 2002; 122: 456–57
7. Rumack CM, Wilson SR, Charboneau JW (eds.), Diagnostic Ultrasound. 2nd ed. St. Louis: Mosby, 1998; 724
8. De Groot LJ, Larsen PR, Hennemann G (eds.), The Thyroid and Its Diseases. 6th ed. London: Churchill Livingstone; 1996; 307
9. Solivetti FM, Nasrollah N, Paganelli C, De Majo A:
[Lymphadenopathy as specific ultrasonography index of subacute thyroiditis. Preliminary data]. Radiol Med, 1998; 96(6): 596–98 [in Italian]
10. Giovagnorio F, Glorioso M, Brino MD: Sonographic evaluation of anterior cervical lymph nodes. J Med Ultrasonics, 2013; 40: 237–41 11. Kangi K, Tadako K, Kayoko H et al: Clinical significance of
measurements of antithyroid antibodies in the diagnosis of Hashimoto’s thyroiditis: comparison with histological findings. Thyroid, 1996; 6: 445–50
12. Raber W, Gessl A, Nowotny P, Vierhapper H: Thyroid ultrasound versus antithyroid peroxidase antibody determination: a cohort study of four hundred fifty-one subjects. Thyroid, 2002; 12(8): 725– 31
13. Pedersen OM, Aardal NP, Larssen TB et al: The value of
ultrasonography in predicting autoimmune thyroid disease. Thyroid, 2000; 10(3): 251–59
14. Dayan CM, Daniels GH: Chronic autoimmune thyroiditis. N Engl J Med, 1996; 335(2): 99–107
15. Gutekunst R, Hafermann W, Mansky T, Scriba PC: Ultrasonography related to clinical and laboratory findings in lymphocytic thyroidits. Acta Endocrinol (Copenh), 1989; 121: 129–35
16. Nordmeyer JP, Shafeh TA, Heckmann C: Thyroid sonography in autoimmune thyroiditis. A prospective study on 123 patients. Acta Endocrinol (Copenh), 1990; 122: 391–95
17. Willms A, Bieler D, Wieler H et al: Correlation between sonography and antibody activity in patients with Hashimoto thyroiditis. J Ultrasound Med, 2013; 32(11): 1979–86
References:
18. Serres-Créixams X, Castells-Fusté I, Pruna-Comella X et al: Paratracheal lymph nodes: a new sonographic finding in autoimmune thyroiditis. J Clin Ultrasound, 2008; 36(7): 418–21
19. Friedman M, Shimaoka K, Rao U et al: Diagnosis of chronic lymphocytic thyroiditis (nodular presentation) by needle aspiration. Acta Cytol, 1981; 25: 513–22
20. James EM, Charboneau JW, Hay ID: The thyroid. In: Rumack CM, Wilson SR, Charboneau JW (eds.), Diagnostic Ultrasound. St. Louis: Mosby-Year Book, 1991; 507
21. Chaudhary V, Bano S: Thyroid ultrasound. Indian J Endocrinol Metab, 2013; 17(2): 219–27
22. Marcocci C, Vitti P, Cetani F et al: Thyroid ultrasonography helps to identify patients with diffuse lymphocytic thyroiditis who are prone to develop hypothyroidism. J Clin Endocrinol Metab, 1991; 72(1): 209–13
23. Solbiati L, Charboneau JW, James EM, Hay ID: The Thyroid Gland. In: Rumack CM, Wilson SR, Charboneau JW (eds.), Diagnostic Ultrasound. Vol 1. St. Louis: Mosby. Inc., 1997; 724
24. Langer JE, Khan A, Nisenbaum HL et al: Sonographic appearance of focal thyroiditis. Am J Roentgenol, 2001; 176(3): 751–54
25. Yeh HC, Futterweit W, Gilbert P: Micronodulation: ultrasonographic sign of Hashimoto thyroiditis. J Ultrasound Med, 1996; 15: 813–19 26. Kim DW, Eun CK, In HS et al: Sonographic differentiation of
asymptomatic diffuse thyroid disease from normal thyroid: a prospective study. Am J Neuroradiol, 2010; 31(10): 1956–60 27. Yildirim D, Sanal HT, Kocaoglu M: Hyperechoic nodules in
Hashimoto’s thyroiditis: correlation with cytopathological findings; biopsy may not be necessary at all. Yeditepe Med J, 2009; 10: 183–87 28. Hayashi N, Tamaki N, Konishi J et al: Sonography of Hashimoto’s
thyroiditis. J Clin Ultrasound, 1986; 14(2): 123–26
29. Kerr L: High-resolution thyroid ultrasound: the value of color Doppler. Ultrasound Q, 1994; 12: 21–44
30. Butch RJ, Simeone JF, Mueller PR: Thyroid and parathyroid ultrasonography. Radiol Clin North Am, 1985; 23(1): 57–71 31. Wakita Y, Nagasaki T, Nagata Y et al: Thyroid heterogeneity, as
indicated by the CV of ultrasonographic intensities, correlates with anti-thyroid peroxidase antibodies in euthyroid Hashimoto’s thyroiditis. Thyroid Res, 2013; 23: 6(1): 5
32. Rago T, Chiovato L, Grasso L et al: Thyroid ultrasonography as a tool for detecting thyroid autoimmune diseases and predicting thyroid dysfunction in apparently healthy subjects. J Endocrinol Invest, 2001; 24(10): 763–69
33. Ahuja AT, Ying M: Sonographic evaluation of cervical lymph nodes. Am J Roentgenol, 2005; 184(5): 1691–99
34. Kuna SK, Bracic I, Tesic V et al: Ultrasonographic differentiation of benign from malignant neck lymphadenopathy in thyroid cancer. J Ultrasound Med, 2006; 25(12): 1531–37; quiz 1538–40
35. Iyer NG, Shaha AR, Ferlito A et al: Delphian node metastasis in head and neck cancers – oracle or myth? J Surg Oncol, 2010; 102(4): 354–58
36. Sinclair D: Clinical and laboratory aspects of thyroid autoantibodies. Ann Clin Biochem, 2006; 43: 173–83