Dergi web sayfası:
www.agri.ankara.edu.tr/dergi www.agri.ankara.edu.tr/journalJournal homepage:
TARIM BİLİMLERİ DERGİSİ
—
JOURNAL OF AGRICUL
TURAL SCIENCES
22 (2016) 422-432
Density and Biomass of Fish Populations in Kirmir Stream of Sakarya
River, Turkey
Özge ZENCİR TANIRa, A. Şeref KORKMAZb aErzincan University, Kemah Vocational School, Erzincan, TURKEY
bAnkara University, Faculty of Agriculture, Department of Aquaculture and Fisheries Engineering, Ankara, TURKEY ARTICLE INFO
Research Article
Corresponding Author: Özge ZENCİR, E-mail: [email protected], Tel: +90 (546) 447 06 77 Received: 02 February 2015, Received in Revised Form: 26 March.2015, Accepted: 30 March 2015
ABSTRACT
In this study, Zippin’s triple-catch removal method was used to estimate density and biomass of fish species in Kirmir Stream of Sakarya River, Central Anatolia Turkey. A total area of 1.5256 ha was sampled and 4167 fishes were caught using electrofishing between February 2007 and November 2007. A total of 9 fish species representing 2 families Cyprinidae and Cobitidae were recorded. Fish species identified are as follows: Chub (Leuciscus cephalus Linnaeus, 1758), barbel (Barbus plebelejus escherichi Heckel, 1843), Capoeta tinca Heckel, 1843, spirlin (Alburnoides bipunctatus Bloch, 1782), Capoeta capoeta sieboldi Steindachner, 1864, tirgis-nase (Chondrostoma regium Heckel, 1843), bleak (Alburnus orontis Sauvage, 1882), spined-loach (Cobitis taenia Linnaeus, 1758) and angora-loach (Noemacheilus angorae Steindachner, 1897). A. orontis was the most dominant species, constituting 1199 fish and 28.77% of the total fishes, followed by C. tinca (1173 fish and 28.15%), B. p. escherichi (584 fish and 14.01%), L. cephalus (454 fish and 10.90%), A. bipunctatus (322 fish and 7.73%), C. regium (245 fish and 5.88 %), N. angorae (107 fish and 2.57%) C. c. sieboldi (65 fish and 1.56%) and C. taenia (18 fish and 0.43%). The density and biomass values were estimated as 11456 fish ha-1 and 346.78 kg ha-1 in February 2007, 8982 fish ha-1 and279.82 kg ha-1 in May 2007, 6320 fish ha-1 and 251.52
kg ha-1 in August 2007 and 2887 fish ha-1 and 168.87 kg ha-1 in November 2007, respectively. The lowest density and
biomass values were observed in November 2007.
Keywords: Density; Biomass; Electrofishing; Kirmir stream; Ankara; Turkey
Sakarya Nehri’nin Kirmir Çayı’ndaki Balık Populasyonlarının
Yoğunluğu ve Biyoması
ESER BİLGİSİ Araştırma Makalesi
Sorumlu Yazar: Özge ZENCİR, E-posta: [email protected], Tel: +90 (546) 447 06 77 Geliş Tarihi: 02 Şubat 2015, Düzeltmelerin Gelişi: 26 Mart 2015, Kabul: 30 Mart 2015
ÖZET
Bu çalışmada, İç Anadolu Bölgesi’ndeki Sakarya Nehri’nin Kirmir Çayı’nda balık türlerinin yoğunluk ve biyomas değerlerini tahmin etmek için üç avlı ayrılmaya dayalı metot kullanılmıştır. 1.5256 ha’lık alanda örnekleme yapılmış ve
1. Introduction
A fish population is shaped by the geologic, chemical, physical, and biological factors within and surrounding the environment in which it lives. The relative quality of that environment affects the organisms living there, exerting positive or negative pressure on the population (Platts & McHenry 1988). The fluctuation of the fish population is really important for stock assessment and management. In this way, a major decline and rise in the population size or the population biomass can be detected, and appropriate management strategies can be adopted (Chen et al 2004). A relatively simple and inexpensive method of evaluating the health of lentic systems is to monitor the density and biomass of the fish population (Platts & McHenry 1988; Bohlin et al 1989).
Density and biomass estimates of targeted species by electrofishing capture data are most often generated using depletion (or sometimes referred to as removal) (Moran 1951; Zippin 1958; White et al 1982) or the mark-recapture method (Ricker 1975; Zubik & Fraley 1988). Because these methods are labour intensive, they have been recommended only when researchers require detailed knowledge of the target population. Typically, removal methods have been used in stream environments where fish capture is by electrofishing during two to four intensive sampling periods over a short time period (often within a day) (Kelso 1989).
It was clear that estimates of population density and biomass would be required if the interrelationships of the various species were to be evaluated (Williams 1965). Many authors in various regions of the world have been studied the density and biomass of fish or fishes per surface unit in rivers (Pires et al 1999; Penaz et al 2003; Dikov & Zivkov 2004; Namin & Spurny 2004; Vlach et al 2005; Kolev 2010). The principal aim of these investigations was to obtain population density and biomass estimates of most, if not all, of the fish species occurring at each site, and it is perhaps pertinent to consider the accuracy of the results obtained.
Little work has been done in Central Anatolia, Turkey on river populations parameters (i.e. density and biomass) of fish (Ölmez 1992; Korkmaz & Atay 1997; Korkmaz et al 1998; Korkmaz 2005). With this respect it is needed to establish the status of fish density and biomass in a number of localities and stream profiles in Central Anatolia, Turkey. As there is no data about density and biomass of fish in Kirmir Stream, the information obtained from Zippin’s triple-catch removal method by electrofishing in the stream sections could be important. The objectives of this study were to determine density and biomass estimates, and habitat structure for fish populations in Kirmir Stream and to assess correlations between density and biomass.
Şubat 2007-Kasım 2007 tarihleri arasında 4167 adet balık elektroşok metoduyla avlanmıştır. Elde edilen örneklemelerde 2 familyaya (Cyprinidae ve Cobitidae) ait 9 balık türü (tatlısu kefali (Leuciscus cephalus Linnaeus, 1758), bıyıklı balık (Barbus plebejus escherichi Heckel, 1843), siraz balığı (Capoeta tinca Heckel, 1843), inci balığı (Alburnoides bipunctatus Bloch, 1782), saçaklı siraz (Capoeta capoeta sieboldi Steindachner, 1864), karaburun (Chondrostoma regium Heckel, 1843), anadolu inci balığı (Alburnus orontis Sauvage, 1882), taş ısıran balığı (Cobitis taenia Linnaeus, 1758) ve çöpcü balığı (Nemachelius angorae Steindachner, 1897) avlanmıştır. A. orontis toplam populasyon içerisinde 1199 birey ve % 28.77 ile en yoğun türdür ve bu türü sırasıyla C. tinca (1173 birey ve % 28.15), B. p. escherichi (584 birey ve % 14.01), L. cephalus (454 birey ve % 10.90), A. bipunctatus (322 birey ve % 7.73), C. regium (245 birey ve % 5.88), N. angorae (107 birey ve % 2.57) C. c. sieboldi (65 birey ve % 1.56) and C. taenia (18 birey ve % 0.43) takip etmiştir. Yoğunluk ve biyomas değerleri sırasıyla Şubat 2007’de; 11456 adet ha-1 ve 346.78 kg ha-1, Mayıs 2007’de;
8982 adet ha-1 ve279.82 kg ha-1, Ağustos 2007’de; 6320 adet ha-1 ve 251.52 kg ha-1 ve Kasım 2007’de; 2887 adet ha-1 ve
168.87 kg ha-1 olarak tahmin edilmiştir. En düşük yoğunluk ve biyomas değerleri Kasım 2007’de gözlenmiştir.
Anahtar Kelimeler: Yoğunluk; Biyomas; Elektrikle avcılık; Kirmir çayı; Ankara; Türkiye
2. Material and Methods
2.1. Study area
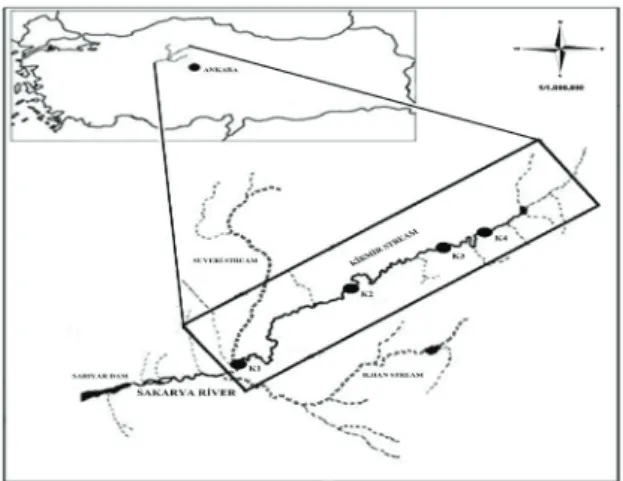
Kirmir Stream is a branch of the Sakarya River geographically located in the north-western part of the Central Anatolian Region of Turkey at 40-41° N and 32-33° E (Figure 1). The depth of the stream is generally shallow (30-50 cm), but reaches 2-3 m at some points. The bottom structure varies between sandy, stony and muddy (Kucuk & Alpaz 2008).
Figure 1- Study area and sampling sites Şekil 1- Araştırma alanı ve örnekleme yerleri
The bottom of site 1 was covered with small rocky (5-10 cm), and the banks were occasionally wooded; the bottom of site 2 was covered with rocky (20-30 cm), sandy and standing water, and the banks were un-wooded and rocky; the bottom of site 3 was covered with rocky (30-70 cm), and the banks were occasionally wooded and standing water; the bottom of site 4 was covered rocky (30-50 cm) and big rocky, and the its around was reeds.
This study was carried out in Kirmir Stream of Sakarya River. Four sampling sites were assigned on Kirmir Stream (130 km long) for taking fish samples, water samples and measuring water characteristics. These sampling sites in Kirmir Stream were selected according to habitat structure, depth, water velocity, size and structure of substratum (Hankin 1984). At each sampling site, we took the measurement per 10-20 m to determine the mean stream width (m) over a 200 m standard reach length. Some physical and chemical characteristics of sampling sites were shown in Table 1. Width and depth of the stream varies 3.16-6.12 m and 0.12-0.89 m, respectively.
2.2. Sampling methods
Fish populations in Kirmir Stream were sampled approximately every 3 months between February 2007 and November 2007 using electrofishing (500-Table 1- Some physical and chemical charecteristics of sampling sites
Çizelge 1- Örnekleme yerlerinin bazı fiziksel ve kimyasal özellikleri Sampling times and
sites pH Water Temperature (˚C) Dissolved Oxygen (mg L-1) Water velocity
(m sec -1) Conductivity (μmhos cm-1) Depth (m) Width (m) Area (ha)
February 2007 1 7.84±0.01 10.5±0.00 9.6±0.24 0.24±0.02 1540±1.70 0.63±0.08 5.16±0.05 0.1032 2 7.81±0.02 10.5±0.00 10.2±0.08 0.45±0.01 1580±1.82 0.17±0.04 5.80±0.06 0.1160 3 8.11±0.02 8.5±0.03 9.8±0.13 0.59±0.02 1696±1.73 0.51±0.04 3.33±0.06 0.0666 4 7.89±0.01 9.0±0.00 11.5±0.17 0.42±0.02 1674±1.29 0.41±0.07 5.66±0.05 0.1132 May 2007 1 7.50±0.02 21.5±0.00 6.0±0.17 0.25±0.01 1486±1.71 0.53±0.05 5.08±0.05 0.1016 2 7.51±0.02 23.5±0.03 8.8±0.17 0.45±0.02 1510±1.71 0.12±0.02 5.70±0.08 0.1140 3 7.69±0.03 24.5±0.00 8.7±0.13 0.71±0.03 1688±1.29 0.38±0.05 3.16±0.04 0.0632 4 8.07±0.02 25.0±0.00 7.7±0.15 0.50±0.01 1642±1.83 0.33±0.04 5.60±0.06 0.1120 August 2007 1 8.12±0.02 24.0±0.00 8.6±0.24 0.28±0.02 1897±1.29 0.29±0.05 3.27±0.07 0.0654 2 8.17±0.02 22.0±0.03 7.3±0.01 0.40±0.01 1584±1.29 0.46±0.08 4.25±0.07 0.0850 3 8.16±0.03 23.0±0.00 8.9±0.13 0.67±0.03 1966±1.83 0.37±0.06 3.28±0.07 0.0656 4 8.24±0.01 24.5±0.03 7.9±0.13 0.43±0.02 1786±2.16 0.30±0.06 5.45±0.06 0.1090 November 2007 1 7.62±0.02 7.5±0.00 9.8±0.01 0.27±0.02 1300±3.59 0.82±0.08 6.12±0.04 0.1224 2 7.76±0.02 5.0±0.00 10.1±0.18 0.50±0.02 1243±2.22 0.50±0.06 5.06±0.05 0.1012 3 7.56±0.02 6.5±0.00 10.5±0.18 0.67±0.03 1278±1.29 0.89±0.07 4.05±0.08 0.0810 4 7.83±0.01 7.2±0.03 9.7±0.18 0.53±0.02 1200±1.83 0.21±0.06 5.31±0.04 0.1062
700 V, 2 A, D.C). The electrofishing team consisted of three experienced crew members with one using the anode and the other two using dip nets to capture the fish. Each sampling site under study was closed at both ends with 8-10 mm mesh size nets (Lacroix 1989). Each fishing pass (with 1.5 hour) was carried out in an upstream direction. The time interval between passes was at least 30-60 minutes. Each sampling site was sampled three times with effort standardized among sampling. The depth and width of the sampling sites were measured per 10-20 m (Neves & Pardue 1983). Fish caught in each sample were anesthetized with MS 222 and mortality was not observed. Then, fishes were identified as to species and weighted (±0.01 g). Fish caught were returned to the water as alive in accordance with permission. In each sampling, the numbers and biomass of fish were determined. Then, in order to determine fish density (population size) according to species, it was used Zippin’s triple-catch removal method (Zippin 1956; Seber & Whale 1970). Zippin’s triple-catch removal method is described as in Equation 1.
) ˆ 1 ) ˆ 1 ˆ 1 2 3 k k ( -q C C C q -( T N = = + + (1)
Where; pˆ is the catch efficiency (pˆ= 1 -qˆ); T is total catch (C1+C2+C3); k is the numbers of removals; C1 ,C2 ,C3 are the catch in each consecutive removal; Nˆis population density. The sampling variance and standard error of Nˆwere estimated from the Equation 2 and 3, respectively.
1 2 2 ˆ 1 ˆ )1.(ˆ ). ˆ.ˆ ˆ -k 2. k k k N ( -q p.k ) q q q -( . N S = and S =Nˆ SN2ˆ (2)
An approximate 95 per cent confidence interval for Nˆis Nˆ± t.SNˆ. An estimator of qˆ isqˆ = (T - C1) / (T - Ck) (k=3). The validity of the Zippin method was tested by calculating R and T1, R = (C2 + 2.C3) / (C1+C2+C3), (If R=0 or R〉1 then the Zippin method is not applicable) and the goodness of fit statistic (T1< χ2 = 3.841 with k-2 degrees of freedom) for a multinomial distribution where the population size is not known (Seber 1973). The computation used for T1 was:
∑ = − = k i [(Ci Ei) /Ei] T 1 2 1 and (E =1 Nˆ.pˆ;E =2 Nˆ.pˆ.qˆ;E =3 Nˆ.pˆ.qˆ2) (3)
The biomass or standing crop (Bˆ) was estimated
by Bˆ= B. (Nˆ/ N). Where; B is the total weight of fish caught and N is the total number of fish caught. Values of density and biomass of fish per unit area where catches were estimated byNˆ/Aand Bˆ/A, respectively. Where A is area of sampling sites (in ha) (Bohlin et al 1989).
3. Results and Discussion
A total area of 1.5256 ha was sampled and 4167
fishes were caught from the Kirmir Stream between February 2007 and November 2007. A total of 9 fish species representing 2 families Cyprinidae and Cobitidae were recorded. Fish species identified are as follows: Chub (Leuciscus cephalus), barbel (Barbus plebelejus escherichi), Capoeta tinca, spirlin (Alburnoides bipunctatus), Capoeta capoeta
sieboldi, tirgis-nase (Chondrostoma regium), bleak
(Alburnus orontis), spined-loach (Cobitis taenia), angora-loach (Noemacheilus angorae).
Number of fish species of Kirmir Steam is fewer than the most studies such as Guadina Basin (Portugal, 16 species) (Pires et al 1999), Veleka River (Bulgaria, 16 species) (Dikov & Zıkov 2004), Bečva River (Czech Republic, 23 species) (Namin & Spurny 2004), Úpoř Brook (Czech Republic, 13 species) (Vlach et al 2005); more than Sakarya Basin (Turkey, 4 species) (Ölmez 1992), Sugul Brook (Turkey, 4 species) (Korkmaz & Atay 1997), Hatilla Brook (Turkey, 2 species) (Korkmaz et al 1998) and Kadıncık Brook (Turkey, 2 species) (Korkmaz 2005). In freshwater, comparisons of the difference between the numbers of species are difficult. Because the habitat structure of sampling sites and abiotic-biotic factors may vary. Small streams may be characterized by great changes in environmental conditions along the gradient of stream size and discharge (Vlach et al 2005).
A. orontis was the most dominant species,
constituting 1199 fish and 28.77% whilst C. taenia was the least species 18 fish and 0.43% (Table 2). Number of fish identified (4167 fish) in Kirmir Stream is fewer than 5548 fish Bečva River by Namin & Spurny (2004); more than 1303 fish Veleka
River by Dikov & Zikov (2004), 1166 fish Sakarya Basin by Ölmez (1992), 2943 fish Sugul Brook by Korkmaz & Atay (1997), 748 fish Hatila Brook by Korkmaz et al (1998) and 79 fish Kadıncık Brook
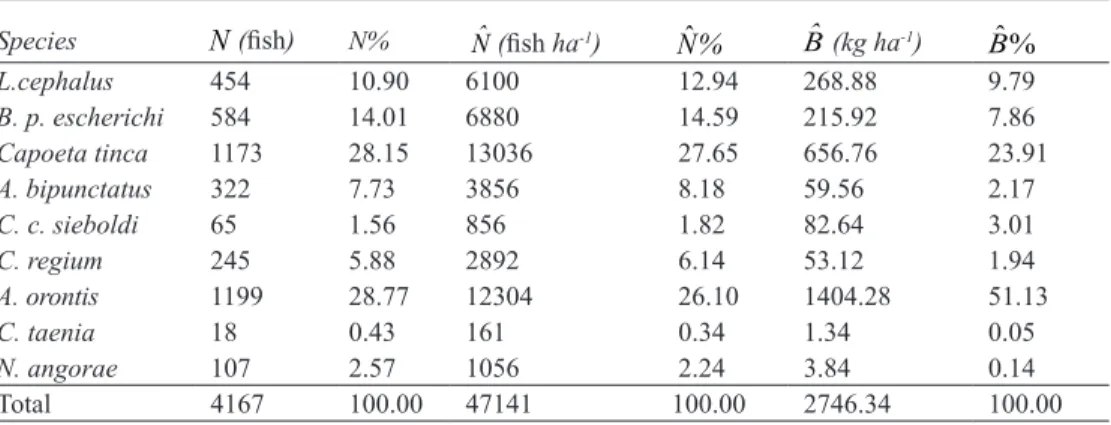
by Korkmaz (2005). These differences can be explained by both species diversity and the higher amount of fish in large rivers where it could be find alternative habitats according to small stream. Table 2- Population size, density and biomass % of each species in Kirmir Stream
Çizelge 2- Kirmir Çayı’nda türlerin sayısı, yoğunluğu, biyoması ve % değerleri
Species N(fish) N% Nˆ(fish ha-1) Nˆ% Bˆ(kg ha-1) ˆB%
L.cephalus 454 10.90 6100 12.94 268.88 9.79 B. p. escherichi 584 14.01 6880 14.59 215.92 7.86 Capoeta tinca 1173 28.15 13036 27.65 656.76 23.91 A. bipunctatus 322 7.73 3856 8.18 59.56 2.17 C. c. sieboldi 65 1.56 856 1.82 82.64 3.01 C. regium 245 5.88 2892 6.14 53.12 1.94 A. orontis 1199 28.77 12304 26.10 1404.28 51.13 C. taenia 18 0.43 161 0.34 1.34 0.05 N. angorae 107 2.57 1056 2.24 3.84 0.14 Total 4167 100.00 47141 100.00 2746.34 100.00
Total fish density in Kirmir Stream varied between 161 fish ha-1 and 3036 fish ha-1. C. tinca dominated with 27.65% (13036 fish ha-1) of the total density. A. orontis was also very abundant (26.10%, 12304 fish ha-1). B.p.plebejus, L.cephalus,
A.bipunctatus and C.regium accounted for 14.59%
(6880 fish ha-1), 12.94 % (6100 fish ha-1), 8.18% (3856 fish ha-1) and 6.14% (2892 fish ha-1), respectively. The density of other species reached the total value of 2073 fish ha-1 (<10%). The biomass of the fish assemblage estimated the value of 2746.34 kg ha-1. The dominant species were A. orontis (1404.28 kg ha-1) and C. tinca (656.76 kg ha-1) which accounted for 51.13% and 23.91% of the total biomass. Other species are as follows: L. cephalus created 9.79 % (268.88 kg ha-1), B. p. plebejus 7.86% (215.92 kg ha-1), and the remaining species < 5% (2.976.98 kg ha-1) (Table 2). If these results are referred to the components of the ichthyofauna, it can be stated that the highest density of fish and biomass states were estimated from locations in which the A. orontis and
C. tinca were present.
The comparative analyses of fish density and biomass in streams studied by Ölmez (1992),
Korkmaz & Atay (1997), Dikov & Zikov (2004), Namin & Spurny (2004), Vlach et al (2005), Korkmaz (2005) have shown that the fish density and biomass in the Kirmir Stream is >5338 fish ha-1 and 126.1 kg ha-1 for 16 species in Veleka River, 35452.2 fish ha-1 and 1728.9 fish ha-1 for 23 species in Bečva River, 1166 fish ha-1 and 319 kg ha-1 for 4 species obtained using mark-recapture in Sakarya Basin, 1009 fish ha-1 and 48.47 4.1 kg ha-1 for 4 species in Sugul Brook and 32 fish ha-1 and 4.1 kg ha-1 in Kadıncık Brook. However, values of the fish density and biomass 74074 fish ha-1 and 395 kg ha-1 for 13 species in Úpoř Brook were higher than our results. These differences can be said to be caused by the fact that selective fishing or catch efficiency. The variable catch efficiency is not only dependent on the characteristics and habits of fish populations but also on factors related to the design and implementation of the sampling and on the physical, chemical and environmental characteristics of the habitat (Bravo et al 1999).
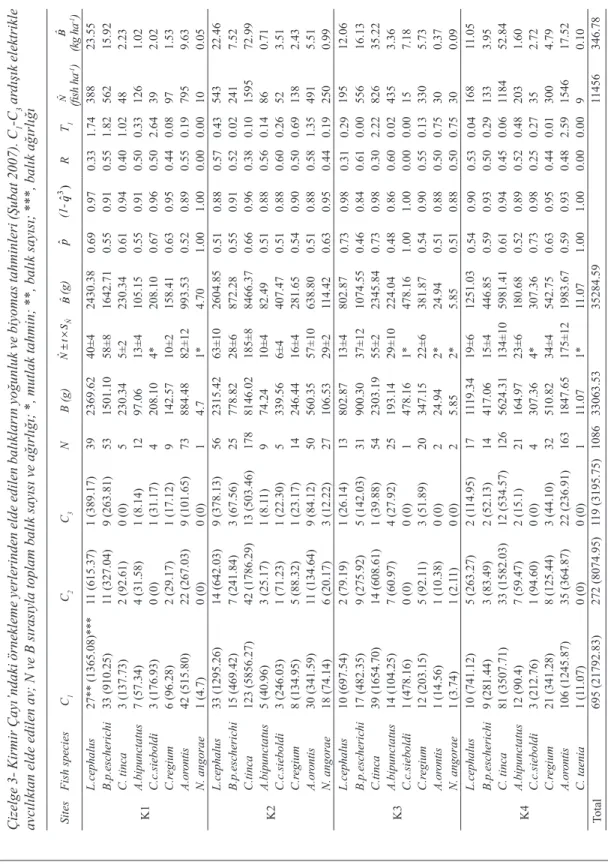
The results of successive electrofishing together with estimates of density and biomass at the four stations and sampling periods are presented in Tables 3-6.
Table 3- Stock density and biomass obtained fr om sampling sites in the Kirmir River , February 2007. C1 -C3 ar e the catch fr om successive electr ofishing; N and B ar
e total numbers and weights, r
espectively; *, absolute estimate; **, fish number; ***, fish weight
Çizelge 3- Kirmir Çayı’ndaki örnekleme yerlerinden elde edilen balıkların yoğunluk ve biyomas tahminleri (Şubat 2007). C1 -C3 ar dışık elektrikle
avcılıktan elde edilen av; N ve B sırasıyla toplam balık sayısı ve ağırlığı; *, mutlak tahmin; **, balık sayısı; ***, balık ağırlığı Sites
Fish species C1 C2 C3 N B (g) Nˆ S t Nˆ × ± Bˆ (g) pˆ (1-) ˆ 3q R T1 Nˆ (fish ha -1) Bˆ (kg ha -1) K1 L.cephalus 27** (1365.08)*** 11 (615.37) 1 (389.17) 39 2369.62 40±4 2430.38 0.69 0.97 0.33 1.74 388 23.55 B.p.escherichi 33 (910.25) 11 (327.04) 9 (263.81) 53 1501.10 58±8 1642.71 0.55 0.91 0.55 1.82 562 15.92 C. tinca 3 (137.73) 2 (92.61) 0 (0) 5 230.34 5±2 230.34 0.61 0.94 0.40 1.02 48 2.23 A.bipunctatus 7 (57.34) 4 (31.58) 1 (8.14) 12 97.06 13±4 105.15 0.55 0.91 0.50 0.33 126 1.02 C.c.sieboldi 3 (176.93) 0 (0) 1 (31.17) 4 208.10 4* 208.10 0.67 0.96 0.50 2.64 39 2.02 C.r egium 6 (96.28) 2 (29.17) 1 (17.12) 9 142.57 10±2 158.41 0.63 0.95 0.44 0.08 97 1.53 A. or ontis 42 (515.80) 22 (267.03) 9 (101.65) 73 884.48 82±12 993.53 0.52 0.89 0.55 0.19 795 9.63 N. angorae 1 (4.7) 0 (0) 0 (0) 1 4.7 1* 4.70 1.00 1.00 0.00 0.00 10 0.05 K2 L.cephalus 33 (1295.26) 14 (642.03) 9 (378.13) 56 2315.42 63±10 2604.85 0.51 0.88 0.57 0.43 543 22.46 B.p.escherichi 15 (469.42) 7 (241.84) 3 (67.56) 25 778.82 28±6 872.28 0.55 0.91 0.52 0.02 241 7.52 C.tinca 123 (5856.27) 42 (1786.29) 13 (503.46) 178 8146.02 185±8 8466.37 0.66 0.96 0.38 0.10 1595 72.99 A.bipunctatus 5 (40.96) 3 (25.17) 1 (8.1 1) 9 74.24 10±4 82.49 0.51 0.88 0.56 0.14 86 0.71 C.c.sieboldi 3 (246.03) 1 (71.23) 1 (22.30) 5 339.56 6±4 407.47 0.51 0.88 0.60 0.26 52 3.51 C.r egium 8 (134.95) 5 (88.32) 1 (23.17) 14 246.44 16±4 281.65 0.54 0.90 0.50 0.69 138 2.43 A. or ontis 30 (341.59) 11 (134.64) 9 (84.12) 50 560.35 57±10 638.80 0.51 0.88 0.58 1.35 491 5.51 N. angorae 18 (74.14) 6 (20.17) 3 (12.22) 27 106.53 29±2 114.42 0.63 0.95 0.44 0.19 250 0.99 K3 L.cephalus 10 (697.54) 2 (79.19) 1 (26.14) 13 802.87 13±4 802.87 0.73 0.98 0.31 0.29 195 12.06 B.p.escherichi 17 (482.35) 9 (275.92) 5 (142.03) 31 900.30 37±12 1074.55 0.46 0.84 0.61 0.00 556 16.13 C.tinca 39 (1654.70) 14 (608.61) 1 (39.88) 54 2303.19 55±2 2345.84 0.73 0.98 0.30 2.22 826 35.22 A.bipunctatus 14 (104.25) 7 (60.97) 4 (27.92) 25 193.14 29±10 224.04 0.48 0.86 0.60 0.02 435 3.36 C.c.sieboldi 1 (478.16) 0 (0) 0 (0) 1 478.16 1* 478.16 1.00 1.00 0.00 0.00 15 7.18 C.r egium 12 (203.15) 5 (92.1 1) 3 (51.89) 20 347.15 22±6 381.87 0.54 0.90 0.55 0.13 330 5.73 A. or ontis 1 (14.56) 1 (10.38) 0 (0) 2 24.94 2* 24.94 0.51 0.88 0.50 0.75 30 0.37 N. angorae 1 (3.74) 1 (2.1 1) 0 (0) 2 5.85 2* 5.85 0.51 0.88 0.50 0.75 30 0.09 K4 L.cephalus 10 (741.12) 5 (263.27) 2 (1 14.95) 17 11 19.34 19±6 1251.03 0.54 0.90 0.53 0.04 168 1 1.05 B.p.escherichi 9 (281.44) 3 (83.49) 2 (52.13) 14 417.06 15±4 446.85 0.59 0.93 0.50 0.29 133 3.95 C. tinca 81 (3507.71) 33 (1582.03) 12 (534.57) 126 5624.31 134±10 5981.41 0.61 0.94 0.45 0.06 1 184 52.84 A.bipunctatus 12 (90.4) 7 (59.47) 2 (15.1) 21 164.97 23±6 180.68 0.52 0.89 0.52 0.48 203 1.60 C.c.sieboldi 3 (212.76) 1 (94.60) 0 (0) 4 307.36 4* 307.36 0.73 0.98 0.25 0.27 35 2.72 C.r egium 21 (341.28) 8 (125.44) 3 (44.10) 32 510.82 34±4 542.75 0.63 0.95 0.44 0.01 300 4.79 A. or ontis 106 (1245.87) 35 (364.87) 22 (236.91) 163 1847.65 175±12 1983.67 0.59 0.93 0.48 2.59 1546 17.52 C. taenia 1 (1 1.07) 0 (0) 0 (0) 1 11.07 1* 11.07 1.00 1.00 0.00 0.00 9 0.10 T otal 695 (21792.83) 272 (8074.95) 119 (3195.75) 1086 33063.53 35284.59 1 1456 346.78
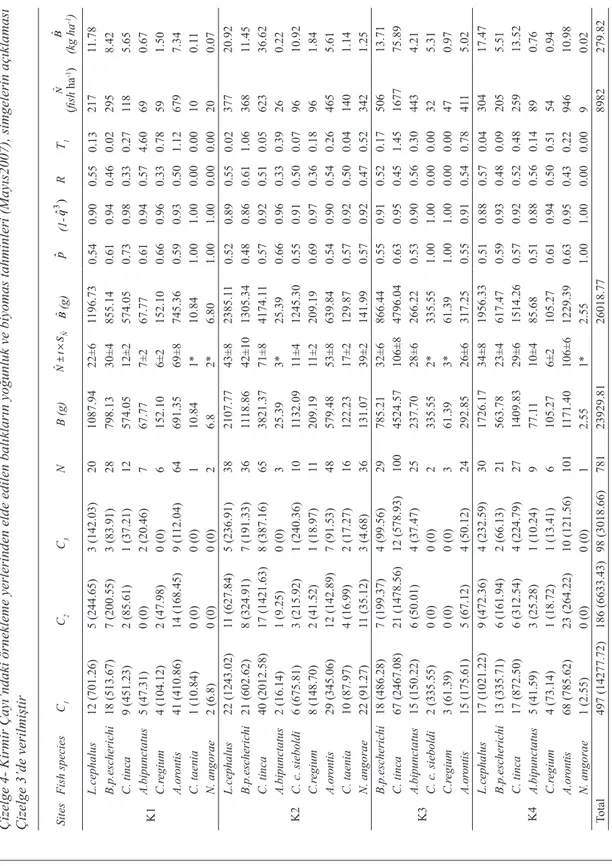
Table 4- Stock density and biomass obtained fr om sampling sites in the Kirmir River , May 2007, symbol explanation pr esented in Table 3 Çizelge 4- Kirmir Çayı’ndaki örnekleme yerlerinden elde edilen balıkların yoğunluk ve biyomas tahminleri (Mayıs2007), simgelerin açıklaması
Çizelge 3’de verilmiştir Sites
Fish species C1 C2 C3 N B (g) Nˆ S t Nˆ × ± Bˆ(g) pˆ (1-) ˆ 3 q R T1 Nˆ (fish ha -1) Bˆ (kg ha -1) K1 L.cephalus 12 (701.26) 5 (244.65) 3 (142.03) 20 1087.94 22±6 1196.73 0.54 0.90 0.55 0.13 217 1 1.78 B.p.escherichi 18 (513.67) 7 (200.55) 3 (83.91) 28 798.13 30±4 855.14 0.61 0.94 0.46 0.02 295 8.42 C. tinca 9 (451.23) 2 (85.61) 1 (37.21) 12 574.05 12±2 574.05 0.73 0.98 0.33 0.27 1 18 5.65 A.bipunctatus 5 (47.31) 0 (0) 2 (20.46) 7 67.77 7±2 67.77 0.61 0.94 0.57 4.60 69 0.67 C.r egium 4 (104.12) 2 (47.98) 0 (0) 6 152.10 6±2 152.10 0.66 0.96 0.33 0.78 59 1.50 A. or ontis 41 (410.86) 14 (168.45) 9 (1 12.04) 64 691.35 69±8 745.36 0.59 0.93 0.50 1.12 679 7.34 C. taenia 1 (10.84) 0 (0) 0 (0) 1 10.84 1* 10.84 1.00 1.00 0.00 0.00 10 0.1 1 N. angorae 2 (6.8) 0 (0) 0 (0) 2 6.8 2* 6.80 1.00 1.00 0.00 0.00 20 0.07 K2 L.cephalus 22 (1243.02) 11 (627.84) 5 (236.91) 38 2107.77 43±8 2385.1 1 0.52 0.89 0.55 0.02 377 20.92 B.p.escherichi 21 (602.62) 8 (324.91) 7 (191.33) 36 11 18.86 42±10 1305.34 0.48 0.86 0.61 1.06 368 1 1.45 C. tinca 40 (2012.58) 17 (1421.63) 8 (387.16) 65 3821.37 71±8 4174.1 1 0.57 0.92 0.51 0.05 623 36.62 A.bipunctatus 2 (16.14) 1 (9.25) 0 (0) 3 25.39 3* 25.39 0.66 0.96 0.33 0.39 26 0.22 C. c. sieboldi 6 (675.81) 3 (215.92) 1 (240.36) 10 1132.09 1 1±4 1245.30 0.55 0.91 0.50 0.07 96 10.92 C.r egium 8 (148.70) 2 (41.52) 1 (18.97) 11 209.19 1 1±2 209.19 0.69 0.97 0.36 0.18 96 1.84 A. or ontis 29 (345.06) 12 (142.89) 7 (91.53) 48 579.48 53±8 639.84 0.54 0.90 0.54 0.26 465 5.61 C. taenia 10 (87.97) 4 (16.99) 2 (17.27) 16 122.23 17±2 129.87 0.57 0.92 0.50 0.04 140 1.14 N. angorae 22 (91.27) 11 (35.12) 3 (4.68) 36 131.07 39±2 141.99 0.57 0.92 0.47 0.52 342 1.25 K3 B.p.escherichi 18 (486.28) 7 (199.37) 4 (99.56) 29 785.21 32±6 866.44 0.55 0.91 0.52 0.17 506 13.71 C. tinca 67 (2467.08) 21 (1478.56) 12 (578.93) 100 4524.57 106±8 4796.04 0.63 0.95 0.45 1.45 1677 75.89 A.bipunctatus 15 (150.22) 6 (50.01) 4 (37.47) 25 237.70 28±6 266.22 0.53 0.90 0.56 0.30 443 4.21 C. c. sieboldi 2 (335.55) 0 (0) 0 (0) 2 335.55 2* 335.55 1.00 1.00 0.00 0.00 32 5.31 C.r egium 3 (61.39) 0 (0) 0 (0) 3 61.39 3* 61.39 1.00 1.00 0.00 0.00 47 0.97 A. or ontis 15 (175.61) 5 (67.12) 4 (50.12) 24 292.85 26±6 317.25 0.55 0.91 0.54 0.78 41 1 5.02 K4 L.cephalus 17 (1021.22) 9 (472.36) 4 (232.59) 30 1726.17 34±8 1956.33 0.51 0.88 0.57 0.04 304 17.47 B.p.escherichi 13 (335.71) 6 (161.94) 2 (66.13) 21 563.78 23±4 617.47 0.59 0.93 0.48 0.09 205 5.51 C. tinca 17 (872.50) 6 (312.54) 4 (224.79) 27 1409.83 29±6 1514.26 0.57 0.92 0.52 0.48 259 13.52 A.bipunctatus 5 (41.59) 3 (25.28) 1 (10.24) 9 77.1 1 10±4 85.68 0.51 0.88 0.56 0.14 89 0.76 C.r egium 4 (73.14) 1 (18.72) 1 (13.41) 6 105.27 6±2 105.27 0.61 0.94 0.50 0.51 54 0.94 A. or ontis 68 (785.62) 23 (264.22) 10 (121.56) 101 1171.40 106±6 1229.39 0.63 0.95 0.43 0.22 946 10.98 N. angorae 1 (2.55) 0 (0) 0 (0) 1 2.55 1* 2.55 1.00 1.00 0.00 0.00 9 0.02 T otal 497 (14277.72) 186 (6633.43) 98 (3018.66) 781 23929.81 26018.77 8982 279.82
Table 5- Stock density and biomass obtained fr om sampling sites in the Kirmir River , August 2007, symbol explanation pr esented in Table 3 Çizelge 5- Kirmir Çayı’ndaki örnekleme yerlerinden elde edilen balıkların yoğunluk ve biyomas tahminleri (Ağustos2007), simgelerin açıklaması
Çizelge 3’de verilmiştir Sites
Fish species C1 C2 C3 N B (g) Nˆ S t Nˆ × ± Bˆ (g) pˆ (1-) ˆ 3q R T1 Nˆ (fish ha -1) Bˆ (kg ha -1) K1 L.cephalus 14 (754.91) 6 (287.12) 3 (149.63) 23 1191.66 25±6 1295.28 0.55 0.91 0.52 0.03 382 19.81 B.p.escherichi 18 (766.34) 7 (289.28) 3 (131.89) 28 1187.51 30±4 1272.33 0.61 0.94 0.46 0.02 459 19.45 Capoeta tinca 9 (471.67) 3 (279.34) 2 (152.09) 14 903.10 15±4 967.61 0.59 0.93 0.50 0.29 229 14.80 A.bipunctatus 2 (27.43) 1 (9.57) 0 (0) 3 37.00 3* 37.00 0.66 0.96 0.33 0.39 46 0.57 C.c.sieboldi 4 (273.33) 0 (0) 0 (0) 4 273.33 4* 273.33 1.00 1.00 0.00 0.00 61 4.18 C.r egium 6 (171.34) 1 (38.14) 1 (22.09) 8 231.57 8±2 231.57 0.73 0.98 0.38 0.99 122 3.54 A. or ontis 6 (85.1 1) 3 (40.63) 1 (13.27) 10 139.01 1 1±4 152.91 0.55 0.91 0.50 0.07 168 2.34 K2 L.cephalus 23 (1242.65) 9 (415.90) 6 (315.27) 38 1973.82 42±8 2181.59 0.54 0.90 0.55 0.50 494 25.67 B.p.escherichi 10 (416.3) 4 (171.62) 2 (96.45) 16 684.37 17±4 727.14 0.57 0.92 0.50 0.04 200 8.55 Capoeta tinca 27 (904.91) 7 (534.62) 7 (351.18) 41 1790.71 44±6 1921.74 0.59 0.93 0.51 2.88 518 22.61 C.c.sieboldi 1 (596.57) 1 (280.31) 0 (0) 2 876.88 2* 876.88 0.51 0.88 0.50 0.75 24 10.32 C.r egium 1 (41.93) 1 (27.16) 0 (0) 2 69.09 2* 69.09 0.51 0.88 0.50 0.75 24 0.81 A. or ontis 22 (297.26) 10 (135.61) 4 (57.12) 36 489.99 39±6 530.82 0.57 0.92 0.50 0.03 459 6.24 N. angorae 6 (18.7) 2 (5.79) 2 (4.15) 10 28.64 1 1±2 31.50 0.51 0.88 0.60 0.55 129 0.37 K3 L.cephalus 2 (109.14) 0 (0) 0 (0) 2 109.14 2* 109.14 1.00 1.00 0.00 0.00 30 1.66 B.p.escherichi 10 (408.21) 6 (253.91) 2 (85.13) 18 747.25 21±6 871.79 0.51 0.88 0.56 0.28 320 13.29 Capoeta tinca 28 (1 179.34) 13 (742.37) 5 (312.08) 46 2233.79 50±8 2428.03 0.57 0.92 0.50 0.07 762 37.01 A.bipunctatus 9 (1 14.92) 4 (58.31) 2 (26.15) 15 199.38 17±4 225.96 0.54 0.90 0.53 0.02 259 3.44 C.c.sieboldi 3 (195.48) 1 (28.28) 0 (0) 4 223.76 4* 223.76 0.73 0.98 0.25 0.27 61 3.41 C.r egium 3 (89.19) 2 (62.56) 0 (0) 5 151.75 5±2 151.75 0.61 0.94 0.40 1.02 76 2.31 A. or ontis 15 (233.18) 5 (68.75) 4 (52.76) 24 354.69 26±6 384.25 0.55 0.91 0.54 0.78 396 5.86 K4 L.cephalus 7 (327.81) 2 (124.96) 1 (79.36) 10 532.13 10±2 532.13 0.66 0.96 0.40 0.12 92 4.88 B.p.escherichi 9 (351.17) 3 (1 13.35) 1 (38.70) 13 503.22 14±2 541.93 0.66 0.96 0.38 0.02 128 4.97 Capoeta tinca 34 (1563.51) 15 (905.62) 5 (539.47) 54 3008.60 58±6 3231.46 0.59 0.93 0.46 0.17 532 29.65 A.bipunctatus 3 (49.44) 1 (13.20) 1 (9.79) 5 72.43 6±4 86.92 0.51 0.88 0.60 0.26 55 0.80 C.r egium 5 (1 11.71) 2 (49.23) 1 (25.73) 8 186.67 9±2 210.00 0.57 0.92 0.50 0.03 83 1.93 A. or ontis 12 (151.91) 8 (135.64) 1 (16.37) 21 303.92 23±6 332.86 0.55 0.91 0.48 1.92 21 1 3.05 T otal 289 (10953.46) 117 (5071.27) 54 (2478.68) 460 18503.41 19898.77 6320 251.52
Table 6- Stock density and biomass obtained fr om sampling sites in the Kirmir River , November 2007, symbol explanation pr esented in Table 3 Çizelge 6- Kirmir Çayı’ndaki örnekleme yerlerinden elde edilen balıkların yoğunluk ve biyomas tahminleri (Kasım2007), simgelerin açıklaması
Çizelge 3’de verilmiştir Sites
Fish species C1 C2 C3 N B (g) Nˆ S t Nˆ × ± Bˆ(g) pˆ (1-) ˆ 3 q R T1 Nˆ (fish ha -1) Bˆ (kg ha -1) K1 L.cephalus 9 (271.36) 3 (1 12.37) 2 (90.54) 14 474.27 15±4 508.15 0.59 0.93 0.50 0.29 123 4.15 B.p.escherichi 11 (567.14) 4 (203.61) 2 (101.37) 17 872.12 18±4 923.42 0.61 0.94 0.47 0.08 147 7.54 Capoeta tinca 3 (101.54) 1 (37.65) 0 (0) 4 139.19 4* 139.19 0.73 0.98 0.25 0.27 33 1.14 A.bipunctatus 4 (468.84) 2 (251.77) 0 (0) 6 720.61 6±2 720.61 0.66 0.96 0.33 0.78 49 5.89 C.c.sieboldi 2 (359.44) 1 (60.42) 0 (0) 3 419.86 3* 419.86 0.66 0.96 0.33 0.39 25 4.07 C.r egium 2 (64.53) 1 (33.96) 0 (0) 3 98.49 3* 98.49 0.66 0.96 0.33 0.39 25 0.95 A. or ontis 13 (201.56) 5 (70.69) 2 (34.12) 20 306.37 21±4 321.69 0.61 0.94 0.45 0.00 172 3.12 N. angorae 2 (6.13) 1 (2.25) 0 (0) 3 8.38 3* 8.38 0.66 0.96 0.33 0.39 29 0.07 K2 L.cephalus 6 (287.31) 2 (79.16) 0 (0) 8 366.47 9±2 412.28 0.73 0.98 0.25 0.56 89 4.07 B.p.escherichi 5 (239.20) 3 (141.83) 1 (42.12) 9 423.15 10±4 470.17 0.51 0.88 0.56 0.14 99 4.65 Capoeta tinca 8 (802.96) 4 (324.96) 0 (0) 12 1 127.92 12±2 1 127.92 0.66 0.96 0.33 1.55 1 19 1 1.15 A.bipunctatus 3 (568.14) 3 (229.47) 0 (0) 6 797.61 7±4 930.55 0.51 0.88 0.50 1.84 69 9.20 C.c.sieboldi 3 (505.22) 0 (0) 0 (0) 3 505.22 3* 505.22 1.00 1.00 0.00 0.00 30 4.36 C.r egium 2 (75.62) 2 (47.81) 0 (0) 4 123.43 5±4 154.29 0.51 0.88 0.50 1.18 49 1.33 A. or ontis 26 (413.58) 9 (141.06) 5 (62.09) 40 616.73 43±6 662.98 0.61 0.94 0.48 0.41 425 5.72 N. angorae 2 (7.76) 1 (2.58) 0 (0) 3 10.34 3* 10.34 0.66 0.96 0.33 0.39 25 0.04 K3 L.cephalus 4 (214.06) 1 (322.12) 0 (0) 5 536.18 5* 536.18 0.79 0.99 0.20 0.21 62 6.62 B.p.escherichi 6 (288.36) 3 (153.45) 1 (44.96) 10 486.72 1 1±4 535.39 0.55 0.91 0.50 0.07 136 6.61 Capoeta tinca 14 (1 128.71) 6 (751.67) 4 (494.36) 24 2374.74 27±8 2671.58 0.51 0.88 0.58 0.23 333 32.98 A.bipunctatus 5 (621.69) 2 (191.23) 1 (34.02) 8 846.94 9±2 952.81 0.57 0.92 0.50 0.03 111 1 1.76 C.c.sieboldi 2 (437.83) 1 (105.77) 0 (0) 3 543.60 3* 543.60 0.66 0.96 0.33 0.39 37 8.16 C.r egium 3 (84.57) 2 (50.39) 0 (0) 5 134.96 5±2 134.96 0.61 0.94 0.40 1.02 62 2.03 A. or ontis 4 (66.25) 1 (17.63) 1 (13.57) 6 97.45 6±2 97.45 0.61 0.94 0.50 0.51 74 1.46 K4 L.cephalus 1 (429.21) 0 (0) 0 (0) 1 429.21 1* 429.21 1.00 1.00 0.00 0.00 9 4.04 B.p.escherichi 3 (134.1 1) 1 (40.60) 1 (36.24) 5 210.95 6±4 253.14 0.51 0.88 0.60 0.26 56 2.38 Capoeta tinca 13 (925.88) 6 (517.39) 2 (367.51) 21 1810.78 23±4 1983.24 0.59 0.93 0.48 0.09 217 18.67 A.bipunctatus 1 (124.88) 1 (73.41) 0 (0) 2 198.29 2* 198.29 0.51 0.88 0.50 0.75 19 1.87 C.r egium 4 (128.75) 2 (71.23) 1 (39.18) 7 239.16 8±4 273.33 0.51 0.88 0.57 0.00 75 2.41 A. or ontis 11 (167.12) 5 (52.67) 2 (27.28) 18 247.07 20±4 274.52 0.57 0.92 0.50 0.02 188 2.43 T otal 172 (9691.75) 73 (4087.15) 25 (1387.36) 270 15166.21 6297.24 2887 168.87
Since T1< χ2 =3.84, there were no significant difference (95% certainty) between capture probabilities and equations (1-2) are appropriate. According to sampling period, the lowest density and biomass values were observed during November 2007 with 2887 fish ha-1 and 168.87 kg ha-1 whilst the highest density and biomass values were observed during February 2007 with 11456 fish ha-1 and 346.78 kg ha-1. Water temperature is the most important factor that influences on population parameters (
Nˆ
andBˆ). The reason for the decrease in total fish density and biomass during the sampling period can be explained by seasonal changes occurred in the water temperature.4. Conclusions
A total of 9 fish species representing 2 families Cyprinidae and Cobitidae were recorded. A. orontis was the most dominant species by its density and biomass. The results of this study contribute to knowledge of fish density and biomass in Kirmir Stream. Moreover, this study, being the first quantitative survey on fish communities in the Kirmir Stream, provides a baseline for future evaluation of the changes. Therefore it has been not put forward any recommendation terms of managerial politics in this study. Additionally, long-term sampling is necessary to predict changes in fish communities and to implement successful planning of stream fish monitoring.
References
Bravo R, Soriguer M C, Villar N & Hernando J A (1999). A simple method to estimate the significance level of the catch probability in the catch removal method in river fish populations. Fisheries Research 44: 179-182
Bohlin T S, Hamrin T G, Heggberget G R & Saltveit S J (1989). Electrofishing theory and practice with special emphasis on salmonids. Hydrobiologia 173: 9-43
Chen J, Thompson M E & Wu C (2004). Estimation of fish abundance indices based on scientific research trawl surveys. Biometrics 60: 116-123
Dikov T & Zivkov M (2004). Abundance and biomass of fishes in the Veleka River, Bulgaria. Folia Zoologica
53(1): 81-86
Hankin D G (1984). Multistage sampling designs in fisheries research: Applications in small Streams. Canadian Journal of Fisheries and Aquatic Sciences
41(11): 1575-1591
Kelso J R M (1989). Validity of the removal method for fish population estimation in a small lake. North
American Journal of Fisheries Management 9:
471-476
Kolev V (2010). Density and biomass of the wild trout in some Bulgarian rivers. Forestry Ideas 16 2(40):
221-229
Korkmaz A Ş (2005). Kadıncık Deresi’ndeki (Çamlıyayla-Mersin) balık yoğunluğu ve biyoması. Tarım Bilimleri
Dergisi-Jornal of Agricultural Sciences 11(1): 91-97
Korkmaz A Ş & Atay D (1997). Şuğul Deresi’ndeki balık populasyonlarının dinamiğinin incelenmesi: Büyüklük, yoğunluk, biyomas ve üretim. IX. Su Ürünleri Sempozyumu. Bildiriler (I): 17-19 Eylül, Eğirdir/Isparta, s. 163-181
Korkmaz A Ş, Ölmez M & Atay D (1998). Observations on some quantitative parameters of fish populations of the Hatila Brook, the Çoruh River, Eastern Turkey. In: Proceedings of the 1th International Symposium on Fisheries and Ecology, 2-4 September, Trabzon, Turkey, pp. 27-33
Kucuk S & Alpbaz A (2008). The impact of organic pollution on the Kirmir Creek and Sakarya River in Turkey. Water Resources 5: 617-624
Lacroix G L (1989). Production of juvenile Atlantic salmon (Salmo salar) in two acidic rivers of Nova Scotia. Canadian Journal of Fisheries Aquatic
Science 46: 2003-2018
Moran P A P (1951). A mathematical theory of animal trapping. Biometrika 38: 307-311
Namin J I & Spurny P (2004). Fish community structure of the middle course of the Becva River. Czech
Journal of Animal Science 49(1): 43-50
Neves R J & Pardue G B (1983). Abundance and production of fishes in a small Appalachian Stream.
Transaction of the American Fisheries Society 112:
21-26
Ölmez M (1992). Yukarı Sakarya Havzası Sakaryabaşı Bölgesi balıklarının populasyon dinamiği üzerinde bir araştırma. Doktora tezi, Ankara Üniversitesi Fen Bilimleri Enstitüsü (Basılmamış), Ankara.
Seber G A F (1973). The estimation of animal abundance and related parameters. Gaffin London, 506 pp
Seber G A F & Whale J F (1970). The removal method for two and three samples. Biometrics 28: 393-400
Penaz M, Pivnicka K, Barus V & Prokes M (2003). Temporal changes in the abundance of barbel, Barbus barbus in the Jihlava River, Czech Republic. Folia
Zoologica 52: 441-448
Pires A M, Cowx I G & Coelho M M (1999). Seasonal changes in fish community structure of intermittent streams in the middle reaches of the Guadiana basin, Portugal. Journal of Fish Biology 54: 235-249
Platts W S & McHenry M L (1988). Density and biomass of trout and char in western Streams. General Technical Report INT-241. U.S. Forest Service, Ogden, UT Ricker W E (1975). Computation and interpratiom of
biological statistics of fish population. Bulletin of the Fisheries Research Board of Canada 191-382 Vlach P, Dusek J, Svatora M & Moravec P (2005).
Fish assemblage structure, habitat and microhabitat preference of five fish species in a small Stream. Folia
Zoologica 54(4): 421-431
Zippin C (1956). An evaluation of the removal method of estimating animal populations. Biometrics 12:
163-189
Zippin C (1958). The removal method of population estimation. The Journal of Wildlife
Management 22(1): 82-90
Zubik R J & Fraley J J (1988). Comparison of snorkel and mark-recapture estimates for trout populations in large Streams. North American Journal of Fisheries
Management 8: 58-62
White G C, Anderson D R, Burnham K P & Otis D L (1982). Capture-recapture and removal methods for sampling closed populations. Los Alamos National Lab., Report LA-8787-NERP, Los Alamos, New Mexico
Williams W P (1965). The population density of four species of freshwater fish, roach (Rutilus rutilus (L.)), bleak (Alburnus alburnus (L.)), dace (Leuciscus leuciscus (L.)) and perch (Perca fluviatilis L.) in the river Thames at reading. Journal of Animal Ecology