Dergi web sayfası:
www.agri.ankara.edu.tr/dergi www.agri.ankara.edu.tr/journalJournal homepage:
TARIM BİLİMLERİ DERGİSİ
—
JOURNAL OF AGRICUL
TURAL SCIENCES
20 (2014) 446-453
The Population Vigors of Diallel F
4Offsprings of Six Bread Wheat
Genotypes for Grain Yield under Irrigated and Rain-Fed Conditions
Mustafa YILDIRIMa, Mustafa ÇAKMAKbaGümüşhane University, Kelkit Aydin Doğan Vocational School, Plant and Animal Breeding Department, Gümüşhane, TURKEY
b Geçit Kuşağı Agricultural Research Institution, Department of Wheat Wheat Breeding and Genetics, Eskişehir, TURKEY
ARTICLE INFO
Research Article
Corresponding Author: Mustafa YILDIRIM, E-mail: [email protected], Tel: +90 (505) 310 57 47 Received: 22 January 2014, Received in Revised Form: 30 June 2014, Accepted: 02 July 2014
ABSTRACT
Grain yield estimate from early segregating populations is an interesting feature of today’s wheat breeding programs, and F1 populations are generally recommended as the most suitable population by researchers. In the present study, we evaluated the population vigor of diallel F4 offsprings of six bread wheat genotypes (Sultan, Bezostaya, Süzen, Harmankaya, Altay and Gerek) under irrigated (IR) and rain-fed conditions (RF). The experiment as two sets under IR and RF were established in the field of Anatolian Agricultural Research Institute, Eskişehir. The mean of grain yield (5468 kg ha-1) of F
4 populations in RF and IR had been lower than the mean of genotypes (5654 kg ha-1). The mean of
grain yield of genotypes (7062 kg ha-1) under IR was higher than F
4 populations (6703 kg ha-1), while genotypes and F4
populations were nearly similar under RF (4246 kg ha-1 and 4234 kg ha-1, respectively). The mid-variety population vigor
for grain yield varied from -6.70% (Hrm/Grk) to 8.77% (Bez/Grk) under RF, and from -22.58% (Sltn/Alty) to 10.87% (Bez/Süzen) under IR. There was not positive significance population vigor in F4s. According to results under RF and IR, F4 populations are observed as the most suitable populations for realistically estimation of grain yield performance
of populations.
Keywords: Wheat; Population vigor; Grain yield; F4 offspring
Altı Ekmeklik Buğday Genotipinin Diallel F
4Melez Döllerinde Sulu ve
Yağmura Dayalı Koşullar Altında Populasyon Güçleri
ESER BİLGİSİ
Araştırma Makalesi
Sorumlu Yazar: Mustafa YILDIRIM, E-posta: [email protected], Tel: +90 (505) 310 57 47 Geliş Tarihi: 22 Ocak 2012, Düzeltmelerin Gelişi: 30 Haziran 2014, Kabul: 02 Temmuz 2014
ÖZET
Erken dönemde açılan populasyonlardan verim tahmini yapmak günümüz ıslah programlarında ilgi çekici bir özellik olup, genellikle F1 populasyonlarının bu amaçla kullanımı araştırmacılar tarafından önerilir. Sunulan bu çalışmada, yağmura dayalı (RF) ve sulu şartlar altında (IR) altı ekmeklik buğdayın (Sultan, Bezostaya, Süzen Harmankaya, Altay
1. Introduction
Wheat is an important crop being a staple food in Turkey (Yildirim et al 2008). In Turkey, per capita wheat consumption is 228.7 kg. Wheat production is 20.1 million tons under cultivated areas in Turkey (TSI 2012). However, its production fluctuates year to year because of the change of environment conditions and the use of sensitive genotypes to unfavorable environment. There are significant differences between the wheat genotypes for most of the traits (Awan et al 2007). There is an urgent need to study genetic diversity used germplasm in order to keep a desirable level of genetic variation of wheat in future breeding (Gulnaz et al 2012). High grain yield in wheat has been the main aim in wheat breeding studies was focused on attempts to improve the yield potential by new genotypes (Kusaksiz & Dere 2010).
Grain yield estimate from early segregating populations is an interesting feature of wheat breeding programs of today, due to the high annual variation in wheat average yield, particularly under irrigated and rain-fed conditions. Wheat breeders try to estimate high-yielding genotypes from early segregating populations (Tuhina-Khatun 2010; Josekutty 2011). In bread wheat, heterosis over mid and better parent has the key importance (Akbar et al 2010). Therefore, breeders look at grain yield performance of segregating populations. Breeders use mid-variety vigor and high-variety vigor to estimate grain yield performance from segregating populations (Yildirim 2005; Krystkowiak et al 2009).
Generally, they use hybrid vigor of F1 offspring (Lonnquist & Gardner 1961; Cress 1966; Yildirim 2005). In reality, the most suitable population for the estimation of high grain yield performance is F4 segregating population. The selection in advanced generations might be effective for grain yield in wheat (Erkul 2010). Because, F4 populations have higher purity compared to F1 populations (more than 90% level). The heritability for grain yield at F4 is also higher than F1 (Bhullar et al 1977). So, single plant selection from F4 can give a better result for grain yield in a breeding program (Josekutty 2011). Not only parental selection is the most important for wheat crossing program (Josekutty 2011) but also plant selection from F4 population for high yield potential is the most important under both irrigated and rain-fed conditions. Therefore, in Turkey, single plant selection from F4 population for irrigated and
rain-fed conditions are made by Turkish breeders. In Turkish wheat breeding program, F4 populations
are usually evaluated in different environments (irrigated and rain-fed) before plant selection suitable ones.
2. Materials and Methods
2.1. Study site descriptionThe study was carried out at the experimental field of Anatolian Agricultural Research Institute in Eskişehir (located at 39°45’ N latitude, 30°33’ E longitude at an altitude of 801 m above sea level) during 2005-2006 growing season. Rainfall during the 11-month growing season (from 1st September
ve Gerek) diallel F4 melez döllerinde populasyon güçleri değerlendirilmiştir. Deneme, IR ve RF şeklinde iki set olarak
Eskişehir Anadolu Tarımsal Araştırma Enstitüsü arazisinde kurulmuştur. RF ve IR’deki F4 populasyonlarının dane verim ortalamaları (5468 kg ha-1) çeşitlerin ortalamasından daha düşüktü (5654 kg ha-1). IR’de çeşitlerin dane verimi ortalaması
(7062 kg ha-1) F
4 populasyonlarından (6703 kg ha-1) yüksek çıkarken, RF altında hemen hemen yakın çıkmıştır (sırası ile
4246 kg ha-1 and 4234 kg ha-1). Dane verimi açısından ebeveyn ortalamasına göre populasyon gücü RF altında -6.70%
(Hrm/Grk) ve 8.77% (Bez/Grk) arasında değişirken, IR altında -22.58% (Sltn/Alty) ve 10.87% (Bez/Süzen) arasında değişmiştir. F4 populasyonlarına ait populasyon güçlerinin hiç birinde pozitif önemli bir sonuç çıkmamıştır. RF ve IR altındaki sonuçlara göre, F4 populasyonlarının gerçekçi dane verim performansı tahmini için en uygun populasyonlar
olduğu gözlenmektedir.
Anahtar Kelimeler; Populasyon gücü; Dane verimi; F4 melez dölü
Ta r ı m B i l i m l e r i D e r g i s i – J o u r n a l o f A g r i c u l t u r a l S c i e n c e s 20 (2014) 446-453
448
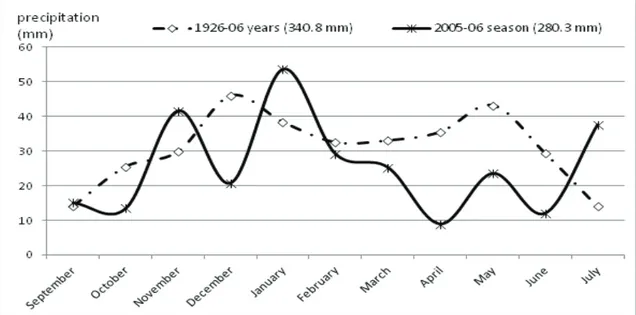
2005 to 31st July 2006) was 280.3 mm (Figure 1).
The average of long-term precipitations from 1926 to 2006 was 340.8 mm. In experimental years, the experimental field had lower rainfall about 60.5 mm than long-term. In addition to that March, April and May had lower rainfall according to long-term. The precipitation of these months is very important for wheat growing in this area. Soil analysis indicated the soil of field to be loamy, slightly alkaline and medium in terms of organic matter and calcium, poor in terms of available phosphorus and rich in terms of available potassium.
2.2. Experimental design
This study included two parts, which were irrigation and rain-fed conditions. The first condition part (IR) was irrigated three times at 3rd April, 8th May and
5th June in 2006 and the second condition part (RF)
was not irrigated under rain-fed condition. The flood irrigation method was used for IR. Six winter wheat genotypes, such as Sultan (Sltn), Bezostaya (Bez),
Süzen (Szn), Altay (Alty), Harmankaya (Hrm), Gerek (Grk) and their half diallel 15 F4 offspring
populations, were included in this experiment. The half diallel crosses among six genotypes for F4
populations were made in 2002, and F1 hybrids were grown 2002-2003 growing seasons in Eskişehir (Yildirim 2005). F2 and F3 populations were grown
in bulked (in 2003-2004 and 2004-2005 growing seasons, respectively). The experiment was set up in a randomized complete block design with three replications. Plant material was sown on 12th
October 2005. Plots in the trial consisted of four 5-m rows (20 cm between rows) sown at a rate of 500 seeds/m2. Fertilizer was applied DAP (150 kg
N ha-1) before planting and AN (200 kg P
2O5 ha
-1)at the shooting stage (Zadoks 1974). Given that
crop plants are more susceptible to herbicide at the early growth stage (Qasem 2011), weed-control was performed by herbicide application at the main shoot stage (Zadoks 1974).
Figure 1- The averages of monthly rainfall (mm) of experimental year and over the long-term in Eskişehir (Anatolian Agricultural Research Institute Meteorology Station)
Şekil 1- Eskişehir’de deneme sezonuna ve uzun yıllar ortalamasına ait aylık ortalama yağışlar (Anadolu Tarımsal Araştırma Enstitüsü Meteoroloji İstasyonu)
Ta r ı m B i l i m l e r i D e r g i s i – J o u r n a l o f A g r i c u l t u r a l S c i e n c e s 20 (2014) 446-453
449
2.3. Measurements and statistical analysisThe harvesting was made on 14th July 2006 using
combine harvester machine. Grain yield (g) was weighed per plot and converted to kg ha-1. In this
study, grain yields of fifteen F4 offspring populations with their six parents were only evaluated and irrigated, and rain-fed were compared to each other.
The Data from irrigated rain-fed conditions was analyzed using the MSTAT-C Statistical Program (1986). Differences between means were determined by LSD (Kalayci 2005) and were considered significant at P ≤ 0.05 (Mohammed 2009). Mid-variety population vigor (PvM) and high-variety population vigor (PvH) were calculated in comparison to genotypes using the following formulas (Ozgen 1989; Budak & Yildirim 1996; Dagustu & Bolek 2002; Dagustu 2008; Beche et al 2013) separately for irrigated and rain-fed conditions.
3
Figure 1- The averages of monthly rainfall (mm) of experimental year and over the long-term in Eskişehir (Anatolian Agricultural Research Institute Meteorology Station)
Şekil 1-Eskişehir’dedenemesezonunaveuzunyıllarortalamasınaaitaylıkortalamayağışlar
(AnadoluTarımsalAraştırmaEnstitüsüMeteorolojiİstasyonu) 2.3. Measurementsand statistical analysis
The harvesting was made on 14th July 2006 usingcombine harvester machine. Grain yield (g) was weighed per plot and converted to kg ha-1. In this study, grain yields of fifteenF
4 offspring populations with their six parents were only evaluated and irrigated, and rain-fed were compared to each other.
The Data from irrigatedrain-fed conditions was analyzed using the MSTAT-C Statistical Program (1986). Differences between means were determined by LSD (Kalayci 2005) and were considered significant at P≤ 0.05 (Mohammed 2009). Mid-variety population vigor (PvM)and high-variety population vigor (PvH)were calculated in comparison to genotypes using the following formulas (Ozgen 1989; Budak&Yildirim 1996; Dagustu&Bolek 2002; Dagustu 2008; Beche et al 2013) separately for irrigated and rain-fed conditions.
𝑃𝑃𝑣𝑣𝑀𝑀 =𝐹𝐹𝑥𝑥−𝑀𝑀𝑣𝑣
𝑀𝑀𝑣𝑣 100 (1) 𝑃𝑃𝑣𝑣𝐻𝐻 =𝐹𝐹𝑥𝑥−𝐻𝐻𝑣𝑣
𝐻𝐻𝑣𝑣 100 (2)
Where; Fx, mean performance of F4; Mv, mean of mid parental value (=(Parent1+Parent2)/2); Hv, mean of high parental value; PvM, mid-variety population vigor; PvH, high-variety population vigor.
The t-test was used to determine whether PvM and PvH were statistically different at P ≤ 0.01 and P ≤ 0.05 from mid-variety and high-variety means, following formulas given by Panse and Sukhatme (1961). 𝑃𝑃𝑣𝑣𝑀𝑀 − 𝑡𝑡 = (3𝐸𝐸𝑟𝑟 2𝑅𝑅𝑝𝑝) 1/2 (3) 𝑃𝑃𝑣𝑣𝐻𝐻 − 𝑡𝑡 = (𝐸𝐸𝑟𝑟 𝑅𝑅𝑝𝑝) 1/2 (4)
Where; Er, error sum of squares for analysis of variance; Rp, number of replications; t, 't' test from table value at error degrees of freedom corresponding to 5% or 1% level of significance; PvM-t, difference for mid-variety population vigor ; PvH-t, difference for high-variety population vigor.
(1)
3
Figure 1- The averages of monthly rainfall (mm) of experimental year and over the long-term in Eskişehir (Anatolian Agricultural Research Institute Meteorology Station)
Şekil 1-Eskişehir’dedenemesezonunaveuzunyıllarortalamasınaaitaylıkortalamayağışlar
(AnadoluTarımsalAraştırmaEnstitüsüMeteorolojiİstasyonu) 2.3. Measurementsand statistical analysis
The harvesting was made on 14th July 2006 usingcombine harvester machine. Grain yield (g) was weighed per plot and converted to kg ha-1. In this study, grain yields of fifteenF
4 offspring populations with their six parents were only evaluated and irrigated, and rain-fed were compared to each other.
The Data from irrigatedrain-fed conditions was analyzed using the MSTAT-C Statistical Program (1986). Differences between means were determined by LSD (Kalayci 2005) and were considered significant at P≤ 0.05 (Mohammed 2009). Mid-variety population vigor (PvM)and high-variety population vigor (PvH)were calculated in comparison to genotypes using the following formulas (Ozgen 1989; Budak&Yildirim 1996; Dagustu&Bolek 2002; Dagustu 2008; Beche et al 2013) separately for irrigated and rain-fed conditions.
𝑃𝑃𝑣𝑣𝑀𝑀 =𝐹𝐹𝑥𝑥−𝑀𝑀𝑣𝑣
𝑀𝑀𝑣𝑣 100 (1) 𝑃𝑃𝑣𝑣𝐻𝐻 =𝐹𝐹𝑥𝑥−𝐻𝐻𝑣𝑣
𝐻𝐻𝑣𝑣 100 (2)
Where; Fx, mean performance of F4; Mv, mean of mid parental value (=(Parent1+Parent2)/2); Hv, mean of high parental value; PvM, mid-variety population vigor; PvH, high-variety population vigor.
The t-test was used to determine whether PvM and PvH were statistically different at P ≤ 0.01 and P ≤ 0.05 from mid-variety and high-variety means, following formulas given by Panse and Sukhatme (1961). 𝑃𝑃𝑣𝑣𝑀𝑀 − 𝑡𝑡 = (3𝐸𝐸𝑟𝑟 2𝑅𝑅𝑝𝑝) 1/2 (3) 𝑃𝑃𝑣𝑣𝐻𝐻 − 𝑡𝑡 = (𝐸𝐸𝑟𝑟 𝑅𝑅𝑝𝑝) 1/2 (4)
Where; Er, error sum of squares for analysis of variance; Rp, number of replications; t, 't' test from table value at error degrees of freedom corresponding to 5% or 1% level of significance; PvM-t, difference for mid-variety population vigor ; PvH-t, difference for high-variety population vigor.
(2) Where; Fx, mean performance of F4; Mv, mean of
mid parental value (= (Parent1 + Parent2) / 2); Hv, mean of high parental value; PvM , mid-variety population vigor; PvH, high-variety population vigor.
The t-test was used to determine whether PvM and PvH were statistically different at P ≤ 0.01 and P ≤ 0.05 from mid-variety and high-variety means, following formulas given by Panse and Sukhatme (1961).
Figure 1- The averages of monthly rainfall (mm) of experimental year and over the long-term in Eskişehir (Anatolian Agricultural Research Institute Meteorology Station)
Şekil 1-Eskişehir’dedenemesezonunaveuzunyıllarortalamasınaaitaylıkortalamayağışlar
(AnadoluTarımsalAraştırmaEnstitüsüMeteorolojiİstasyonu) 2.3. Measurementsand statistical analysis
The harvesting was made on 14th July 2006 usingcombine harvester machine. Grain yield (g) was weighed per plot and converted to kg ha-1. In this study, grain yields of fifteenF
4 offspring populations with their six parents were only evaluated and irrigated, and rain-fed were compared to each other.
The Data from irrigatedrain-fed conditions was analyzed using the MSTAT-C Statistical Program (1986). Differences between means were determined by LSD (Kalayci 2005) and were considered significant at P≤ 0.05 (Mohammed 2009). Mid-variety population vigor (PvM)and high-variety population vigor (PvH)were calculated in comparison to genotypes using the following formulas (Ozgen 1989; Budak&Yildirim 1996; Dagustu&Bolek 2002; Dagustu 2008; Beche et al 2013) separately for irrigated and rain-fed conditions.
𝑃𝑃𝑣𝑣𝑀𝑀 =𝐹𝐹𝑥𝑥−𝑀𝑀𝑣𝑣
𝑀𝑀𝑣𝑣 100 (1) 𝑃𝑃𝑣𝑣𝐻𝐻 =𝐹𝐹𝑥𝑥−𝐻𝐻𝑣𝑣
𝐻𝐻𝑣𝑣 100 (2)
Where; Fx, mean performance of F4; Mv, mean of mid parental value (=(Parent1+Parent2)/2); Hv, mean of high parental value; PvM, mid-variety population vigor; PvH, high-variety population vigor.
The t-test was used to determine whether PvM and PvH were statistically different at P ≤ 0.01 and P ≤ 0.05 from mid-variety and high-variety means, following formulas given by Panse and Sukhatme (1961). 𝑃𝑃𝑣𝑣𝑀𝑀 − 𝑡𝑡 = (3𝐸𝐸𝑟𝑟 2𝑅𝑅𝑝𝑝) 1/2 (3) 𝑃𝑃𝑣𝑣𝐻𝐻 − 𝑡𝑡 = (𝐸𝐸𝑟𝑟 𝑅𝑅𝑝𝑝) 1/2 (4)
Where; Er, error sum of squares for analysis of variance; Rp, number of replications; t, 't' test from table value at error degrees of freedom corresponding to 5% or 1% level of significance; PvM-t, difference for mid-variety population vigor ; PvH-t, difference for high-variety population vigor.
(3)
3
Figure 1- The averages of monthly rainfall (mm) of experimental year and over the long-term in Eskişehir (Anatolian Agricultural Research Institute Meteorology Station)
Şekil 1-Eskişehir’dedenemesezonunaveuzunyıllarortalamasınaaitaylıkortalamayağışlar
(AnadoluTarımsalAraştırmaEnstitüsüMeteorolojiİstasyonu) 2.3. Measurementsand statistical analysis
The harvesting was made on 14th July 2006 usingcombine harvester machine. Grain yield (g) was weighed per plot and converted to kg ha-1. In this study, grain yields of fifteenF
4 offspring populations with their six parents were only evaluated and irrigated, and rain-fed were compared to each other.
The Data from irrigatedrain-fed conditions was analyzed using the MSTAT-C Statistical Program (1986). Differences between means were determined by LSD (Kalayci 2005) and were considered significant at P≤ 0.05 (Mohammed 2009). Mid-variety population vigor (PvM)and high-variety population vigor (PvH)were calculated in comparison to genotypes using the following formulas (Ozgen 1989; Budak&Yildirim 1996; Dagustu&Bolek 2002; Dagustu 2008; Beche et al 2013) separately for irrigated and rain-fed conditions.
𝑃𝑃𝑣𝑣𝑀𝑀 =𝐹𝐹𝑥𝑥−𝑀𝑀𝑣𝑣
𝑀𝑀𝑣𝑣 100 (1) 𝑃𝑃𝑣𝑣𝐻𝐻 =𝐹𝐹𝑥𝑥−𝐻𝐻𝑣𝑣
𝐻𝐻𝑣𝑣 100 (2)
Where; Fx, mean performance of F4; Mv, mean of mid parental value (=(Parent1+Parent2)/2); Hv, mean of high parental value; PvM, mid-variety population vigor; PvH, high-variety population vigor.
The t-test was used to determine whether PvM and PvH were statistically different at P ≤ 0.01 and P ≤ 0.05 from mid-variety and high-variety means, following formulas given by Panse and Sukhatme (1961). 𝑃𝑃𝑣𝑣𝑀𝑀 − 𝑡𝑡 = (3𝐸𝐸𝑟𝑟 2𝑅𝑅𝑝𝑝) 1/2 (3) 𝑃𝑃𝑣𝑣𝐻𝐻 − 𝑡𝑡 = (𝐸𝐸𝑟𝑟 𝑅𝑅𝑝𝑝) 1/2 (4)
Where; Er, error sum of squares for analysis of variance; Rp, number of replications; t, 't' test from table value at error degrees of freedom corresponding to 5% or 1% level of significance; PvM-t, difference for mid-variety population vigor ; PvH-t, difference for high-variety population vigor.
(4) Where; Er, error sum of squares for analysis of variance; Rp, number of replications; t, ‘t’ test from table value at error degrees of freedom corresponding to 5% or 1% level of significance; PvM-t, difference for mid-variety population vigor ; PvH-t, difference for high-variety population vigor.
3. Results and Discussion
3.1. Grain yieldThe effect of genotypes (G), conditions (C) and their interactions (G x C) on grain yield were highly significant (P ≤ 0.01) according to combined analysis of variance. The effect of G on grain yield was also statistically highly significant (P ≤ 0.01) in separately for irrigated and rain-fed conditions, too. Average grain yield of six genotypes and their 15 F4
offspring populations are shown in Table 1. Average grain yield at the two combined conditions in this study ranged from 6388 kg ha-1 at Harmankaya to
4764 kg ha-1 at Bezostaya. The difference between
genotype mean and F4 populations mean (5654
kg ha-1 and 5468 kg ha-1, respectively) at the two
combined conditions was 186 kg ha-1.
Average grain yield of the IR was higher (60.6%) than the RF. The mean of genotypes at the IR was higher (66.3%) than the mean of the RF and the mean of F4 populations at the IR was
also higher (58.3%) than the mean of the RF. In the RF, Gerek was the highest yielding genotype with 4851 kg ha-1, and Sultan was the lowest with 3430
kg ha-1. This result is an expected situation because
Gerek is a rain-fed genotype, and Sultan is an irrigated genotype in Turkey. Grain yield of the F4
populations ranged from 3708 kg ha-1 for Sltn/Bez
to 4590 kg ha-1 for Bez/Grk. In the IR, Harmankaya
was the highest yielding genotype with 8245 kg ha -1, and Bezostaya was the lowest with 5939 kg ha-1.
Grain yield of the F4 populations ranged from 5743
kg ha-1 for Sltn/Alty to 7936 kg ha-1 for Alty/Hrm.
The differences between IR and RF of six genotypes and their 15 F4 offspring populations ranged 31.9%
at Gerek to 121.7% at Sultan. Sltn/Bez had the highest difference with 87.8% between IR and RF.
3.2. Population vigors
Among parents, the lowest series mean of mid-variety population vigor (PvM) for grain yield was recorded by Harmankaya (-2.72%) and the highest by Bezostaya (2.39%). As shown in Table 2 below, The PvM for grain yield over mid-variety varied from -6.70% (Hrm/Grk) to 8.77% (Bez/Grk) under
Ta r ı m B i l i m l e r i D e r g i s i – J o u r n a l o f A g r i c u l t u r a l S c i e n c e s 20 (2014) 446-453
450
Table 1- The average grain yield performances (kg ha-1) of six bread wheat genotypes and their 15 F
4 offspring
populations under irrigated (IR) and rain-fed (RF) testing conditions and in Eskişehir experimental field
Çizelge 1- Eskişehir deneme tarlasındaki sulu (IR) ve yağmura dayalı (RF) test şartlarında altı ekmeklik buğday
ve bunların 15 F4 melez döllerinin ortalama dane verim performansları (kg ha-1)
Genotypes and F4 Populations RF IR Average of RF and IR
kg ha-1 Rank kg ha-1 Rank kg ha-1 Rank Differences (%)*
Sultan 3430 21 7603 3 5517 12 121.7 Bezostaya 3589 20 5939 19 4764 21 65.5 Süzen 4499 8 6956 12 5727 6 54.6 Altay 4578 3 7233 4 5906 3 58.0 Harmankaya 4531 4 8245 1 6388 1 82.0 Gerek 4851 1 6397 14 5624 7 31.9 Sltn/Bez 3708 19 6962 11 5335 16 87.8 Sltn/Szn 4238 13 6973 10 5606 8 64.6 Sltn/Alty 4070 15 5743 21 4907 20 41.1 Sltn/Hrm 3727 18 6664 13 5196 18 78.8 Sltn/Grk 4240 12 5757 20 4999 19 35.8 Bez/Szn 3967 17 7148 5 5558 10 80.2 Bez/Alty 4037 16 7025 9 5531 11 74.0 Bez/Hrm 4083 14 7040 8 5562 9 72.4 Bez/Grk 4590 2 6343 15 5467 13 38.2 Szn/Alty 4481 9 7071 6 5776 5 57.8 Szn/Hrm 4501 7 7059 7 5780 4 56.8 Szn/Grk 4527 5 6303 17 5415 14 39.2 Alty/Hrm 4520 6 7936 2 6228 2 75.6 Alty/Grk 4444 10 6189 18 5317 17 39.3 Hrm/Grk 4377 11 6328 16 5352 15 44.6 Genotypes mean 4246 7062 5654 66.3 F4 mean 4234 6703 5468 58.3 General mean 4237 6806 5521 60.6 CV (%) 7.1 7.5 7.6 LSD (P<0.05) 470 843 482 79.4
*, (irrigated – rain-fed) x 100 / rain-fed
Table 2- Estimation of mid-variety and high-variety population vigor for grain yield under rain-fed condition (RF)
Çizelge 2- Yağmura dayalı koşullar (RF) altında dane verimi için ebeveyn ortalaması ve yüksek ebevenyne göre
populasyon güçlerinin tahminlenmesi
Varieties Vigor Sultan (1) Bezostaya (2) Suzen (3) Altay (4) Harmankaya (5) Gerek (6)
1 PvM 5.65 6.89 1.64 -6.38 2.40 PvH 3.31 -5.80 -11.10 * -17.75 ** -12.60 * 2 PvM -1.91 -1.15 0.57 8.77 PvH -11.83 * -11.83 * -9.88 -5.38 3 PvM -1.27 -0.31 -3.17 PvH -2.12 -0.66 -6.69 4 PvM -0.76 -5.74 PvH -1.27 -8.39 5 PvM -6.70 PvH -9.78 * Series mean PvM 2.04 2.39 0.05 -1.46 -2.72 -0.89 PvH -8.79 -7.12 -5.42 -6.95 -7.87 -8.57 General mean PvM -0.10 PvH -7.45
PvM, mid-variety population vigor; PvH, high-variety population vigor; *, **, significant at P <0.05 and P < 0.01probability level respectively
RF. Among fifteen F4 populations, not only there were six positive mid-variety population vigor values but also they were non-significant. All of them also were populations of Sultan and Bezostaya genotypes. However, all of fifteen F4 populations had non-significant under RF condition not only positive but also negative. The high-variety population vigor (PvH) for grain yield over high-variety varied from -17.75% (Sltn/Hrm) to 3.31% (Sltn/Bez) under RF. Out of nine F4 populations, six F4 populations exhibited negatively significant at PvH. The PvM and PvH were desirable parameters for grain yield, but F4 populations were not satisfactory in this trial.
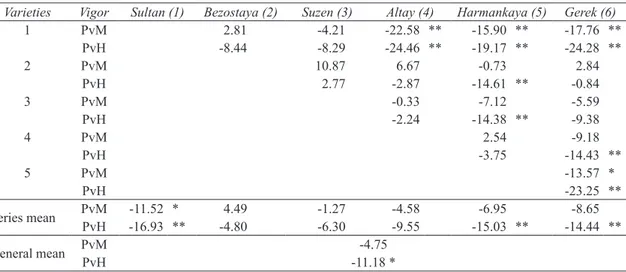
The PvM for grain yield over mid-variety varied from 10.87% (Bez/Süzen) to -22.58% (Sltn/Alty) under IR (Table 3). There were only five positive PvM values among fifteen F4 populations. Four
F4 populations exhibited negatively significant at PvM. Among them, three F4 populations were
highly significant (P≤0.01) which are Sltn/Hrm, Sltn/Grk and Sltn/Alty (-15.90, -17.76 and -22.58, respectively). and only Hrm/Grk was significant
(-13.57) at P≤0.05 level. Out of eight F4 populations,
seven F4 populations exhibited negatively highly
significant at PvM (P≤0.01). They were Süzen/ Hrm, Alty/Grk, Bez/Hrm, Sltn/Hrm, Hrm/Grk, Sltn/Grk and Sltn/Alty, (-14.38%, -14.43%, -14.61%, -19.17%, -23.25%,-24.28% and -24.46%, respectively) under IR.
There was no correlation (r=0.256) between RF and IR in PvM, and there was also no correlation (r=0.388) between them in PvH, too. The population vigors of F4 populations under IR were observed
lower than under RF. This result showed that the water is an important factor for population vigor.
4. Conclusions
To improve the grain yield of wheat under different environments need to identify selection criteria that can identify high-yielding genotypes in variable environments (Najaphy and Geravandi, 2010). In this study, grain yield of parent genotypes and F4
populations at the IR was higher than at the RF. This result is similar to that reported by Zhou and Chen Table 3- Estimation of mid-variety and high-variety population vigors for grain yield under irrigated condition (IR)
Çizelge 3- Sulu koşullar altında (IR) dane verimi için ebeveyn ortalaması ve yüksek ebevenyne göre populasyon güçlerinin tahminlenmesi
Varieties Vigor Sultan (1) Bezostaya (2) Suzen (3) Altay (4) Harmankaya (5) Gerek (6)
1 PvM 2.81 -4.21 -22.58 ** -15.90 ** -17.76 ** PvH -8.44 -8.29 -24.46 ** -19.17 ** -24.28 ** 2 PvM 10.87 6.67 -0.73 2.84 PvH 2.77 -2.87 -14.61 ** -0.84 3 PvM -0.33 -7.12 -5.59 PvH -2.24 -14.38 ** -9.38 4 PvM 2.54 -9.18 PvH -3.75 -14.43 ** 5 PvM -13.57 * PvH -23.25 ** Series mean PvMPvH -11.52 *-16.93 ** -4.804.49 -1.27-6.30 -4.58-9.55 -15.03 **-6.95 -14.44 **-8.65 General mean PvMPvH -11.18 *-4.75
PvM, mid-variety population vigor; PvH; high-variety population vigor; *, **, significant at P < 0.05 and P < 0.01probability level respectively
Ta r ı m B i l i m l e r i D e r g i s i – J o u r n a l o f A g r i c u l t u r a l S c i e n c e s 20 (2014) 446-453
452
(2011). Originally, this study is aimed to evaluate the population vigors of F4 for breeding program
under RF and IR, and indicated that PvM and PvH of F4 populations can be used to estimate grain yield
performance near to reality genotype yielding. Why? Yildirim studied (in 2002-2003 growing seasons) mid-parent vigor and high-parent vigor of diallel fifteen F1 offsprings with same genotypes, which are
used in this study (Yildirim 2005). He reported that there were eleven positive significant combinations at mid-parent vigor and seven positive significant combinations at high-parent vigor on grain yield per plant among F1 offsprings. According to Yildirim’s
result, high-yielding genotypes had to be estimated. However, F4 populations in this study with same parental genotypes have no positive significant values of population vigors. The F4 populations
have higher purity (more than 90%) compared to F1 populations. Some parent characteristics can be identified easily by the F4 generation. The heritability
for grain yield at F4 is higher than F1 (Bhullar et al
1977). Therefore, selection of the best plants from these parents will be of advantage at F4 (Josekutty
2011). Single plant selection from F4 can give a
better result for grain yield in a breeding program according to estimate at grain yield performance either F4 under RF or F4 under IR.
Acknowledgements
This study was supported financially in the national wheat breeding program by Eskişehir Anatolian Agricultural Research Institute of Turkey.
References
Akbar M, Anwar J, Hussain M, Iqbal, M M & Sabir W (2010). Heterosis and heterobeltiosis for grain yield improvement in bread wheat. Heterosis and heterobeltiosis for wheat grain yield. Journal of Agriculture Research 48(1): 15-23
Awan S I, Niaz S, Malik M F A & Ali S (2007). Analysis of variability and relationship among seedling traits and plant height in semi-dwarf wheat (Triticum aestivum L.). Journal of Agriculture and Social Science 3(2): 59-62
Beche E, Lemes da Silva C, Pagliosa E S, Capelin M A, Franke J, Matei G & Benin G (2013). Hybrid performance and heterosis in early segregant populations of Brazilian spring wheat. Australian Journal of Crop Science 7(1): 51-57
Bhullar G S, Gill K S & Khehra A S (1977). Heritability of Yield and Other Traits Measured Over F2-F5 Diallel
Crosses in Wheat (Triticum aestivum L.). Plant Breeding Abstract 47(5): 345
Budak N & Yildirim M B (1996). Heterosis in bread wheat. Turkish Journal of Agriculture and Forestry 20(4): 345-347
Cress C E (1966). Heterosis of the hybrid related to gene frequency differences between two populations. Genetics 53: 269-74
Dagustu N & Bolek M (2002). Heterosis for some agronomic traits in diallel crosses of seven bread wheat (Triticum aestivum L.). Bursa Uludag University Journal of Agriculture Faculty 16(1): 211-223 Dagustu N (2008). Combining ability analysis in relation
to heterosis for grain yield per spike and agronomic traits in bread wheat (Triticum aestivum L.). Turkish Journal of Field Crops 13(2): 49-61
Erkul A, Unay A, Konak C (2010). Inheritance of yield and yield components in a bread wheat (Triticum aestivum L.) cross. .). Turkish Journal Field Crops 15(2): 137-140
Gulnaz S, Khan S H, Shahzad M, Nasim W & Sajjad M (2012). Genetic evaluation of spring wheat (Triticum aestivum L.) germplasm for yield and seedling vigor traits. Journal of Agriculture and Society Science 8: 123‒128
Josekutty P C (2008). Defining the genetic and physiological basis of Triticum sphaerococcum Perc.: Methods in wheat breeding. University of Canterbury, pp. 19-25
Kalayci M (2005). JMP usage examples and analysis of variance models for agricultural research. Anatolian Agricultural Research Institute. Publication No:21, pp. 259-267
Krystkowiak K, Adamski T, Surma M & Kaczmark Z (2009). Relationship between phenotypic and genetic diversity of parental genotypes and the specific combining ability and heterosis effects in wheat (Triticum aestivum L.). Eupheytica 165: 419-434 Kusaksiz T & Dere S (2010). A study on the determination
of genotypic variation for seed yield and its utilization through selection in durum wheat (Triticum durum
Desf.) mutant populations. Turkish Journal of Field Crops 15:188–192
Lonnquist J H & Gardner C O (1961). Heterosis in intervarietal crosses in maize and its implication in breeding procedures. Crop Science 1: 179-183 Mohammed M I (2009). Genotype x environment
interaction in bread wheat in Northern Sudan using AMMI analysis. American-Eurasian Journal of Agriculture & Environment Science 6(4): 427-433 Mohammadi M, Karimizadeh R & Sabaghnia N (2012).
Genotype × environment interaction and yield stability analysis of new improved bread wheat genotypes. Turkish Journal of Field Crops 17(1): 67-73
Najaphy A & Geravandi M (2010). Assessment of indices to identify wheat genotypes adapted to irrigated and rain-fed. Advances in Environmental Biology 5(10): 3212-3218
Ozgen M (1989). Hybrid vigor at winter bread wheat (Triticum aestivum L.). Turkish Journal of Agriculture and Forestry 13(3b): 1190-1201
Panse V G & Sukhatme P V (1961). Statistical methods of agricultural workers. Indian Council of Agriculture Research, 2nd edit., New Delhi
Qasem J R (2011). Herbicides Applications: Problems and Considerations. Herbicides and Environment 32: 644-646
TSI (2012). Degree of self-sufficiency and human consumption per capita of selected crop production
and selected field crop production (wheat). Turkey’s Statistical Yearbook. Turkish Statistical Institute. Ankara, Turkey. Publication Number: 3933, pp. 200-203
Tuhina-Khatun M, Bari M A A, Zaman M A, Begum H & Akter S (2010). Heterosis estimates in F
2 diallel
population of spring wheat at two different cultural conditions. Bangladesh Journal of Agriculture Research 35(3): 413-422
Yildirim M (2005). A study on heredity of some agronomical, physiological and quality characteristics in diallel F1 offsprings of selected six bread wheat
(Triticum aestivum L.) cultivars. Natural Science of Cukurova Univ. PhD thesis (unpublished). Register No: 893, pp. 47-70
Yildirim M, Bolat N, Cakmak M, Belen S, Karaduman K & Tulek A (2008). Determination of grain yield and some grain quality characteristics in off-type material selected from certified bread wheat varieties. National Cereal Symposium, Konya, Turkey, pp. 309-315 Zadoks J C, Chang T T & Konzak C F (1974). A decimal
code for the growth stages of cereals. Weed Research 14: 415-421
Zhou X B & Chen Y H (2011). Yield response of winter wheat to row spacing under irrigated and rainfed conditions. Bulgarian Journal of Agricultural Science 17: 158-166