This content has been downloaded from IOPscience. Please scroll down to see the full text.
Download details:
IP Address: 212.174.144.130
This content was downloaded on 03/11/2015 at 12:01
Please note that terms and conditions apply.
The ATLAS Transition Radiation Tracker (TRT) proportional drift tube: design and
performance
View the table of contents for this issue, or go to the journal homepage for more 2008 JINST 3 P02013
(http://iopscience.iop.org/1748-0221/3/02/P02013)
2008 JINST 3 P02013
PUBLISHED BYINSTITUTE OFPHYSICSPUBLISHING ANDSISSARECEIVED: December 21, 2007 ACCEPTED: February 1, 2008 PUBLISHED: February 29, 2008
The ATLAS Transition Radiation Tracker (TRT)
proportional drift tube: design and performance
The ATLAS TRT collaboration
E. Abat,a† T.N. Addy,j T.P.A. Åkesson,mJ. Alison,uF. Anghinolfi,cE. Arik,a†M. Arik,a G. Atoian,zB. Auerbach,zO.K. Baker,zE. Banas,f S. Baron,cC. Bault,c N. Becerici,a A. Beddall,a1A.J. Beddall,a1J. Bendotti,cD.P. Benjamin,gH. Bertelsen,d A. Bingul,a1 H. Blampey,cA. Bocci,gM. Bochenek,eV.G. Bondarenko,pV. Bychkov,lJ. Callahan,k M. Capeáns Garrido,c L. Cardiel Sas,c A. Catinaccio,c S.A. Cetin,a2 T. Chandler,z R. Chritin,hP. Cwetanski,k M. Dam,dH. Danielsson,cE. Danilevich,vE. David,c J. Degenhardt,uB. Di Girolamo ,c F. Dittus,c N. Dixon,cO.B. Dogan,a†
B.A. Dolgoshein,pN. Dressnandt,uC. Driouchi,dW.L. Ebenstein,gP. Eerola,m U. Egede,mK. Egorov,k H. Evans,kP. Farthouat,cO.L. Fedin,vA.J. Fowler,g S. Fratina,uD. Froidevaux,cA. Fry,j P. Gagnon,kI.L. Gavrilenko,oC. Gay,y N. Ghodbane,rJ. Godlewski,cM. Goulette,c I. Gousakov,l N. Grigalashvili,l Y. Grishkevich,qJ. Grognuz,cZ. Hajduk,f M. Hance,uF. Hansen,d J.B. Hansen,d P.H. Hansen,dG.A. Hare,uA. Harvey Jr.,j C. Hauviller,cA. High,uW. Hulsbergen,c W. Huta,c V. Issakov,zS. Istin,aV. Jain,k G. Jarlskog,mL. Jeanty,yV.A. Kantserov,p B. Kaplan,zA.S. Kapliy,uS. Katounine,vF. Kayumov,oP.T. Keener,uG.D. Kekelidze,l E. Khabarova,lA. Khristachev,vB. Kisielewski,f T.H. Kittelmann,w C. Kline,k
E.B. Klinkby,dN.V. Klopov,v B.R. Ko,gT. Koffas,cN.V. Kondratieva,pS.P. Konovalov,o S. Koperny,eH. Korsmo,mS. Kovalenko,vT.Z. Kowalski,eK. Krüger,v
V. Kramarenko,qL.G. Kudin,v A-C. Le Bihan,v B.C. LeGeyt,uK. Levterov,l
P. Lichard,c A. Lindahl,dV. Lisan,l S. Lobastov,l A. Loginov,zC.W. Loh,yS. Lokwitz,z M.C. Long,jS. Lucas,cA. Lucotte,iF. Luehring,k B. Lundberg,mR. Mackeprang,d V.P. Maleev,vA. Manara,kM. Mandl,cA.J. Martin,zF.F. Martin,uR. Mashinistov,p G.M. Mayers,uK.W. McFarlane,j V. Mialkovski,l B.M. Mills,yB. Mindur,eV.A. Mitsou,x J.U. Mjörnmark,mS.V. Morozov,pE. Morris,k S.V. Mouraviev,oA.M. Muir,y A. Munar,u A.V. Nadtochi,vS.Y. Nesterov,vF.M. Newcomer,uN. Nikitin,qO. Novgorodova,o E.G. Novodvorski,vH. Ogren,kS.H. Oh,gS.B. Oleshko,vD. Olivito,uJ. Olszowska,f W. Ostrowicz,f M.S. Passmore,cS. Patrichev,vJ. Penwell,k F. Perez-Gomez,c V.D. Peshekhonov,lT.C. Petersen,c R. Petti,bA. Placci,c A. Poblaguev,zX. Pons,c M.J. Price,cO. Røhne,t R.D. Reece,uM.B. Reilly,uC. Rembser,cA. Romaniouk,p∗ D. Rousseau,sD. Rust,kY.F. Ryabov,v V. Ryjov,c M. Söderberg,mA. Savenkov,l
2008 JINST 3 P02013
J. Saxon,uM. Scandurra,k V.A. Schegelsky,vM.I. Scherzer,uM.P. Schmidt,z†
C. Schmitt,c E. Sedykh,vD.M. Seliverstov,vT. Shin,j A. Shmeleva,oS. Sivoklokov,q S.Yu. Smirnov,pL. Smirnova,qO. Smirnova,mP. Smith,k V.V. Sosnovtsev,p
G. Sprachmann,cS. Subramania,kS.I. Suchkov,pV.V. Sulin,oR.R. Szczygiel,f G. Tartarelli,nE. Thomson,uV.O. Tikhomirov,oP. Tipton,zJ.A. Valls Ferrer,x
R. Van Berg,uV.I. Vassilakopoulos,jL. Vassilieva,oP. Wagner,uR. Wall,zC. Wang,g D. Whittington,k H.H. Williams,uA. Zhelezkopand K. Zhukovo
aFaculty of Sciences, Department of Physics, Bogazici University, TR - 80815 Bebek-Istanbul,
Turkey
bBrookhaven National Laboratory, Physics Department, Bldg. 510A, Upton, NY 11973, United
States of America
cCERN, CH - 1211 Geneva 23, Switzerland, Switzerland
dNiels Bohr Institute, University of Copenhagen, Blegdamsvej 17, DK - 2100 Kobenhavn 0,
Denmark
eFaculty of Physics and Applied Computer Science of the AGH-University of Science and
Technology, (FPACS, AGH-UST), al. Mickiewicza 30, PL-30059 Cracow, Poland
fThe Henryk Niewodniczanski Institute of Nuclear Physics, Polish Academy of Sciences, ul.
Radzikowskiego 152, PL - 31342 Krakow, Poland
gDuke University, Department of Physics, Durham, NC 27708, United States of America
hUniversite de Geneve, Section de Physique, 24 rue Ernest Ansermet, CH - 1211 Geneve 4,
Switzerland
iLaboratoire de Physique Subatomique et de Cosmologie, CNRS-IN2P3, Universite Joseph
Fourier, INPG, 53 avenue des Martyrs, FR - 38026 Grenoble Cedex, France
jHampton University, Department of Physics, Hampton, VA 23668, United States of America
kIndiana University, Department of Physics, Swain Hall West, Room 117, 727 East Third St.,
Bloomington, IN 47405-7105, United States of America
lJoint Institute for Nuclear Research, JINR Dubna, RU - 141 980 Moscow Region, Russia
mLunds Universitet, Fysiska Institutionen, Box 118, SE - 221 00 Lund, Sweden
nINFN Milano and Università di Milano, Dipartimento di Fisica, via Celoria 16, IT - 20133
Milano, Italy
oP.N. Lebedev Institute of Physics, Academy of Sciences, Leninsky pr. 53, RU - 117 924 Moscow,
Russia
pMoscow Engineering & Physics Institute (MEPhI), Kashirskoe Shosse 31, RU - 115409 Moscow,
Russia
qLomonosov Moscow State University, Skobeltsyn Institute of Nuclear Physics, RU - 119 992
Moscow Lenskie gory 1, Russia
rMax Planck Institut fuer Physik, Postfach 401212, Foehringer Ring 6, DE - 80805 Muenchen,
Germany
sLAL, Univ. Paris-Sud, IN2P3/CNRS, Orsay, France
tDepartment of Physics, University of Oslo, Blindern, NO - 0316 Oslo 3, Norway
uUniversity of Pennsylvania, Department of Physics & Astronomy, 209 S. 33rd Street,
Philadelphia, PA 19104, United States of America
2008 JINST 3 P02013
wUniversity of Pittsburgh, Department of Physics and Astronomy, 3941 O’Hara Street, Pittsburgh,
PA 15260, United States of America
xInstituto de Física Corpuscular (IFIC), Centro Mixto UVEG-CSIC, Apdo. 22085, ES-46071
Valencia; Dept. Física At., Mol. y Nuclear, Univ. of Valencia and Instituto de Microelectrónica de Barcelona (IMB-CNM-CSIC), 08193 Bellaterra, Barcelona, Spain
yUniversity of British Columbia, Dept of Physics, 6224 Agricultural Road, CA - Vancouver, B.C.
V6T 1Z1, Canada
zYale University, Department of Physics, PO Box 208121, New Haven CT, 06520-8121 , United
States of America
1Currently at Gaziantep University, Turkey
2Currently at Dogus University, Istanbul
E-mail: [email protected]
ABSTRACT: A straw proportional counter is the basic element of the ATLAS Transition Radiation
Tracker (TRT). Its detailed properties as well as the main properties of a few TRT operating gas mixtures are described. Particular attention is paid to straw tube performance in high radiation conditions and to its operational stability.
KEYWORDS: Gaseous detectors; Particle tracking detectors; Transition radiation detectors.
∗Corresponding author.
2008 JINST 3 P02013
Contents
1. Introduction 1
2. TRT straw design and basic properties 2
2.1 TRT straw design and production 2
2.2 TRT straw electrical properties 4
3. Choice of the TRT gas mixture 4
3.1 Gas gain working point and operation stability 6
3.2 Electron drift properties 10
3.3 Straw signal 12
4. TRT straw performance with the new operating gas mixture 14
4.1 Energy deposition and transition radiation measurements 14
4.2 Drift-time measurements 15
5. Operation with Ar-CO2mixture 19
6. Conclusions 19
1. Introduction
As described in details in the ATLAS Inner Detector Technical Design Report (TDR) [1] and in [2], the Transition Radiation Tracker (TRT) consists of three parts - a barrel and two end-caps. Its basic elements are thin-walled proportional drift tubes, hereafter called strawtube or simply straws. Straw tubes were chosen as detecting elements because they offer a high degree of modularity of the detector and because they can easily be integrated into a medium producing transition radiation without compromising the continuous tracking concept. The barrel part is comprised of 52 544 straws 144 cm in length oriented parallel to the beam. The two end-caps each contain 122 880 straws 37 cm in length radially aligned to the beam axis. The detector geometry guarantees that particles cross 35–40 straws in a pseudorapidity interval from 0 to 2, providing continuous tracking at larger radii of the Inner Detector while enhancing its pattern recognition ability. The operating conditions in the ATLAS experiment at the Large Hadron Collider (LHC) impose stringent requirements on the straw properties. All choices of materials, the straw design, the active gas, and the operating point were made to ensure safe, and efficient operation in the high radiation environment.
This paper presents the final design of the TRT straw proportional counter, the basic properties of a few gas mixtures and straw performance results achieved so far which are common for different parts of the TRT.
2008 JINST 3 P02013
2. TRT straw design and basic properties
Many of the requirements for best performance at the LHC are mutually exclusive, hence some compromises have to be made. For example, a large tube diameter would assure a high hit effi-ciency, however it would not be able to collect all the electrons in the short bunch crossing time of 25 ns because of the long drift-time in the straw. Tubes of 4 mm inner diameter were chosen for the TRT, representing a good compromise between speed of response, number of ionization clusters, and mechanical as well as operational stability. In this section we describe only the properties of the TRT straws common to any chamber design. Design details of the integration into the actual mechanical and electrical structures of the real detector and the different solutions for the Barrel and EC parts of the TRT are presented in [3] and [4].
2.1 TRT straw design and production
The straw tube wall (figure 1) is formed from two layers of a 35µm thick multilayer film which is produced from 25µm Kapton 100VN film. A special film coating technology was developed to ob-tain the desired mechanical and electrical properties. In the first manufacturing step an aluminium layer of 0.2µm thickness was deposited on one side of the Kapton film. The Al-layer is then pro-tected by a 5–6µm thick graphite-polyimide layer, containing 55% of carbon. While the Al-layer provides good electrical conductivity, the carbon-loaded polyimide protects the aluminium against damage from cathode etching effects during high rate operation and evaporation from occasional discharges. The other side of the film is coated with a 4–5µm polyurethane layer acting as a heat-activated adhesive and sealant. The straw was manufactured by Lamina Dielectrics Ltd.1 First, the coated film was slit into tape 10-mm wide. Two tapes were wound with a pitch of about 13 mm on a precisely tooled mandrel at a temperature of ∼260◦C, with the adhesive layer of the inner tape facing out and the adhesive layer of the outer overlapping tape facing in, figure 2. The allowed gap between tape during winding was specified to be 100-300µm and was continuously controlled.
The adhesion between the two coated polyimide films was required to be at least 0.5 N/cm2 and was controlled by a tensile strength test performed on a sample of the straw (minimum length 200 mm). This test was carried out until the point of rupture and demonstrated that the straw breaks only for loads above 30 N. It was observed that for ruptures below 50 N, the coated film breaks before the disruption of the adhesive bond between layers. In order to ensure a gas tightness quality of the bond regular pressure tests with similar samples of the straws where performed during the production process.
With Kapton film alone, the straw has poor mechanical properties. The straws would be af-fected by environmental factors, such as humidity and temperature, and significantly change size or even creep under tension or compression. In order to stabilize the straw geometry they were re-inforced by carbon fibre bundles. Carbon fibre has a number of advantages: lightness, high elastic limit and specific rigidity, no water absorption, very low heat expansion, good heat and electrical conductivity, among others.
Four 1000-filament carbon fibre bundles were bonded to the outer surface of approximately 150,000 straws 160 cm in length, figure 3. Fibers were attached at 90◦with respect to each other using a special machine developed at CERN.
2008 JINST 3 P02013
00000000 00000000 00000000 00000000 00000000 00000000 00000000 00000000 00000000 00000000 00000000 00000000 00000000 00000000 00000000 00000000 00000000 00000000 00000000 00000000 00000000 00000000 00000000 00000000 00000000 00000000 00000000 11111111 11111111 11111111 11111111 11111111 11111111 11111111 11111111 11111111 11111111 11111111 11111111 11111111 11111111 11111111 11111111 11111111 11111111 11111111 11111111 11111111 11111111 11111111 11111111 11111111 11111111 11111111 00000000 00000000 00000000 00000000 00000000 00000000 00000000 00000000 00000000 00000000 00000000 00000000 00000000 00000000 00000000 00000000 00000000 00000000 00000000 00000000 00000000 00000000 00000000 00000000 00000000 00000000 00000000 11111111 11111111 11111111 11111111 11111111 11111111 11111111 11111111 11111111 11111111 11111111 11111111 11111111 11111111 11111111 11111111 11111111 11111111 11111111 11111111 11111111 11111111 11111111 11111111 11111111 11111111 11111111 + − µm 5 2 + − µm 6 2 + − µm 0.20 0.08 + − µm 25.0 2.5 + − µm 6 2 + − µm 0.20 0.08 + − µm 25.0 2.5 Polyurethane layer Aluminimum layer Kapton film Carbon−polyimideprotection layer Carbon−polyimideprotection layer
Aluminimum layer
Kapton film
Figure 1. The TRT straw wall design. Film Film µ Pitch = 13mm Mandrel Adhesive side Gap = 100−300 m
Figure 2. Schematic view of straw manufacturing process.
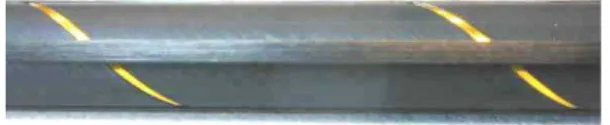
Figure 3. The TRT straw made from multilayer Kapton films and reinforced with carbon fibre bundles.
In the reinforcement process the carbon fibre bundles pass over a series of rollers and an im-pregnation pot that wets the fibres with epoxy resin ensuring uniform resin distribution and tension. A 120µm thick film of resin, controlled by an adjustable stationary scraper, is applied to the im-pregnation roller by dipping. The final thickness of the glue-coated bundle is about 80 µm and width is about 800µm. After cutting, the 37 cm end-cap straws show a deviation from straightness of less than 300µm, while the 144 cm barrel straws have a deviation from straightness of less than 1 mm, well within the TRT specification. The basic straw mechanical properties are now defined by the carbon fiber’s Young’s modulus of 200 GPa and their total cross section of 1.54 · 10−7m2. The Young’s modulus of the straw film is about 4 GPa.
The reinforced straws have a modest weight increase (from 1.0 to 1.5 g/m), however they have a substantially reduced expansion due to humidity and their thermal expansion coefficient is about one order of magnitude smaller (2 · 10−6K−1) compared to non-reinforced straws. In fact, the straw tubes are now an integral part of the TRT’s mechanical structure. They take the own wire tension load and support inner structure of the wheels in the end-cap TRT [4] and the radiator in the barrelTRT [3].
2008 JINST 3 P02013
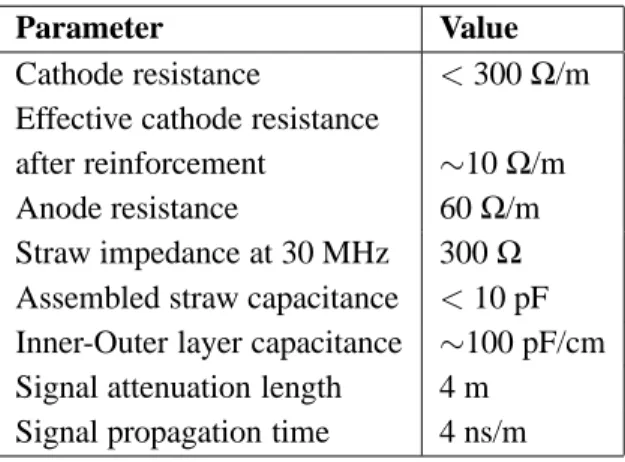
Table 1. Electrical properties of the assembled straw tube.
Parameter Value
Cathode resistance < 300Ω/m
Effective cathode resistance
after reinforcement ∼10Ω/m
Anode resistance 60Ω/m
Straw impedance at 30 MHz 300Ω Assembled straw capacitance < 10 pF Inner-Outer layer capacitance ∼100 pF/cm Signal attenuation length 4 m
Signal propagation time 4 ns/m
Strict quality control steps were implemented in the straw production and assembly process. These include surface conductivity measurements, fibre bonding quality checks, fibre delamination tests and straw geometry measurements (straightness, inner and outer diameter and local defor-mations or defects). The total production yield was 92% with 2% of the straws rejected after reinforcement and 6% during or after the final straw tube assembly.
2.2 TRT straw electrical properties
In drift tube detectors with anode read-out the cathode resistance must be kept as low as possible (the TRT specification is < 300 Ω/m). In the TRT straws the thin aluminium layer ensures a sufficient cathode conductivity of the tube (three orders of magnitude higher than without Al-coating). The outer conductive layer which is identical to the inner surface ensures reasonably good operational properties of the straw even in case of severe damages of the inner layer due to electrical discharges. The carbon fibre reinforcements not only provide very good mechanical stability, but also improve the signal propagation properties by reducing the effective resistance to 10-20Ω/m. An electrical connection of the outer and inner conductive surface of the straw is made to avoid loss of conductivity in case of possible damage of the inner tube layer through erosive effects. This connection is realised by coating the straw ends with a conductive epoxy resin.
The anode wire for the TRT straws was chosen to be of gold-plated tungsten and 30µm in diameter. Dedicated studies were devoted to finding a plating technology insusceptible to gold damaging effects from the former fluorine-containing gas mixture [5]. Best results came from gold plating techniques involving no additional substrates. The thickness of the gold layer was chosen to be 0.6–0.7 µm. In order to ensure gas gain uniformity, deviations from wire diameter and circularity were specified to be less than 1% and 2% respectively. The resistance of the anode wire is 60Ω/m. The wire was manufactured by Toshiba at the Yokaham, Japan factory.
An overview of the assembled straw electrical properties is given in table 1. 3. Choice of the TRT gas mixture
The basic properties of the TRT straw tubes were published almost ten years ago [1]. However there remained a strong motivation to continue studies to ensure reliability and stable performance
2008 JINST 3 P02013
of the ATLAS TRT during ten years of operation at the LHC. Many results of the extensive follow-up research efforts have been published in [5 – 10]. Tests were performed with the original (old) TRT gas mixture, which was Xe + CF4+ CO2in the proportions 70%, 20% and 10%. This gas mixture combined the advantages of efficient transition radiation absorption, high electron drift ve-locities, a wide operating plateau and good ageing resistance. CF4as an additive not only provides fast electron collection times and a large operating plateau, but also serves as an ageing inhibitor. Electro-chemical reactions occurring in the straws operating under irradiation produce fluorine ac-tive species (HF, F, F2. . . ), which inhibit or remove silicone-based wire deposits. Unfortunately these species (particularly HF) can also attack and damage some detector materials [5]. The HF component strongly depends on the water content in the active gas. Even a tiny concentration of water is enough to produce a substantial amount of HF species. This is particularly critical for the glass wire-joint that separates the 1.44 m barrel TRT wires [12]. After a year of intensive R&D on alternative wire-joint technologies and operating gas mixtures, it was decided to abandon CF4in the active gas mixture.
At that point the TRT detector was already designed and largely in production, hence a new gas mixture needed to be found that had similar properties, without containing components that are potentially aggressive or subject to ageing phenomena.
The main requirements on the TRT gas mixture are:
• Efficient transition radiation photon absorption (xenon fraction of 65–70%)
• Performance (signal shape, maximum drift-time, diffusion, etc.) similar to the old gas mix-ture
• Good electrical stability for straws with wire offset of up to 400µm • Compatibility with front-end electronics design [11]
• Absence of polymerization effects (basically no hydrocarbon gases) • Dissociation products must have minimum aggressive properties • Compatibility with the detector and gas system materials • Non-flammable
Xenon is the base component of the gas mixture, needed for its efficient X-ray absorption. The fraction of 70% marks the balance between transition radiation performance, operational stability and electron collection time [12, 13]. As a common neutral quencher carbon dioxide (CO2) pro-vides a plateau of constant drift velocity over a large drift range in the straw tubes, low longitudinal diffusion and a small electron deflection in magnetic fields (small Lorenz angle). It also has stabi-lizing properties in the gas mixture by its ability to absorb UV photons produced in the ionization processes. However for the TRT straw parameters described above the UV absorption capacity in not yet sufficient and an addition of a third component is required for stable operation.
Hydrocarbon gases are often used to stabilise the amplification process, but are prone to poly-merisation on the anode wire.
2008 JINST 3 P02013
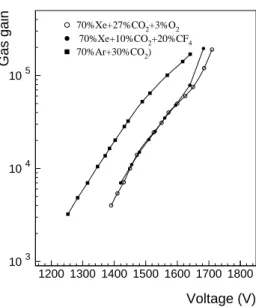
103 104 105 1200 1300 1400 1500 1600 1700 1800 70%Xe+10%CO2+20%CF4 70%Xe+27%CO2+3%O2 70%Ar+30%CO2) Voltage (V) Gas gainFigure 4. Straw gas gain as function of high voltage for different gas mixtures.
One of the hydrocarbon candidates, ethane (C2H6), is known to show no tendency to polymer-ize at relatively high radiation doses [14]. However, for extended irradiation areas fast straw ageing was observed [15, 16].
The choice of non-organic gases is very limited. Eventually oxygen was found to be a suitable additive to the Xe-CO2 binary mixture. The optimal gas composition was found to be 70%Xe + 27%CO2+ 3%O2(new gas mixture).
The change of the TRT operating gas required a repetition of the measurements of all straw parameters important for the detector operation.
3.1 Gas gain working point and operation stability
The straw gas gain working point is determined by many parameters such as detector performance requirements, the lowest electronics threshold, secondary effects at high gas gain etc. The working point is set at a minimum possible gas gain which allows a compromise between these constraints. It was chosen to be 2.5 · 104 [1]. In figure 4 one can see that this value is reached in both the old and the new mixtures at the same voltage of 1530 V. As a reference the gas gain curve for Ar-CO270/30 is shown in the same plot. This mixture is used during TRT acceptance tests and in the initial commissioning phase (see also section 5).
One of the most important parameters related to the working point is the width of the working plateau or, in other words, the difference in voltage between the working point and the point of breakdown. An increase in the fraction of O2 increases the working plateau, however oxygen is a strongly electronegative gas and increasing its concentration quickly deteriorates straw perfor-mance.
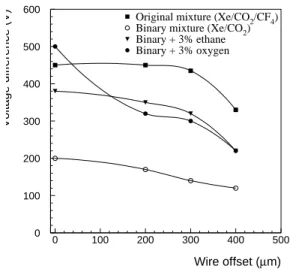
The straw operation stability depends strongly on the displacement of the anode wire from the tube axis. This value was required to be generally below 300 µm, but in some cases it was
2008 JINST 3 P02013
0 100 200 300 400 500 600 0 100 200 300 400 500Original mixture (Xe/CO2/CF4) Binary mixture (Xe/CO2) Binary + 3% ethane Binary + 3% oxygen
Wire offset (µm)
Voltage difference (V)
Figure 5. Difference between the TRT straw working-point and breakdown voltages as a function of the wire offset for different gas mixtures.
accepted up to 400µm. Wires with larger offsets have been disconnected from high voltage during
acceptance testing and assembly of the full detector.
Figure 5 illustrates how the distance between working-point and breakdown voltage (opera-tional plateau) varies as a function of the wire offset in different gas mixtures. It clearly demon-strates that the addition of about 3% of ethane or oxygen substantially improves the operational stability of the binary Xe-CO2mixture and ensures a comfortable safety margin for the straw oper-ation. This margin is necessary to allow for an increase of gas gain due to several different factors such as: possible need to increase the gas gain after some time of operation at LHC intensities to enhance signal to noise ratio (35 V), heavy-ionizing particle effect (30 V) and temperature varia-tions (15 V). These factors are summed up and reduce the working breakdown margin by 80 V and for the binary Xe-CO2mixture leave safety margin of about 40 V, which cannot be considered safe for the ATLAS TRT.
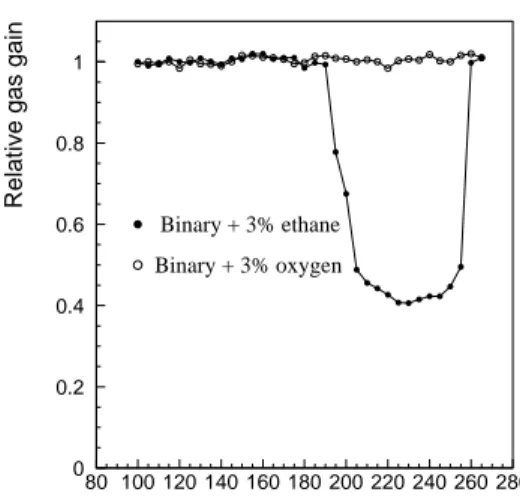
As was mentioned earlier, an ethane gas addition would stabilize the amplification process but at the TRT straw operating conditions it manifests ageing effects. This is illustrated in figure 6, showing the amplitude variation along a straw of the signal using an55Fe source. The test was conducted with the two gas mixtures Xe-CO2-ethane 70/27/3 and Xe-CO2-O270/27/3. During the ageing run a 40 cm long straw was irradiated by a 11 cm wide X-ray beam producing an ionization current density of 0.1 µA/cm (the irradiated region was located at the position 15-26 cm). Gas flow was set to 0.15 cm3/min (gas-flow direction is from left to right in figure 6). After 30 hours of irradiation using the ethane gas mixture, a significant amplitude drop was observed at the straw position 18-26 cm (i.e., the aged spot starts 3 cm downstream of the beginning of the irradiated area). These results, supported by further studies, show that the ethane itself is not prone to poly-merization, and if irradiation area is not wide or gas flow is large the non-saturated hydrocarbons compounds produced in the avalanche are efficiently removed from the irradiation area. But in case of extended ionisation they are accumulated down stream and reach a concentration at which
2008 JINST 3 P02013
0 0.2 0.4 0.6 0.8 1 80 100 120 140 160 180 200 220 240 260 280 Binary + 3% ethane Binary + 3% oxygenPosition along the straw (mm)
Relative gas gain
Figure 6. Relative amplitude variation along a 40 cm long straw after 30 hours of irradiation in Xe-CO2
-ethane 70/27/3, followed by another 18 hours using Xe-CO2-O270/27/3.
5 10 15 20 25 30 35 40 45 50 10-1 1 10 102 103 70%Xe+28%CO2+2%O2 70%Xe+27%CO2+3%O2 70%Xe+26%CO2+4%O2 70%Xe+10%CO2+20%CF4 Cathode field at wire offset 400 µm Cathode field at
wire offset 0 µm Wire
Electric field (kV/cm)
K(cm
-1 )
Figure 7. Electron attachment coefficient for various gas mixtures.
a polymerisation process creates a deposit.
In a second run the same straw was irradiated under the same operating conditions using the oxygen-containing gas. After 18 hours of irradiation the amplitude in the affected area was restored, i.e., the wire deposit was removed. This demonstrates the strong cleaning effect of oxygen, which acts efficiently on hydrocarbon deposits.
Oxygen itself is transparent to UV photons, so the stabilisation is provided by the ozone (O3) molecules created in the avalanches. Increasing the oxygen fraction leads to more stable straw operation and concentrations below 3.5-4 % do not affect TRT performance, however, more than
2008 JINST 3 P02013
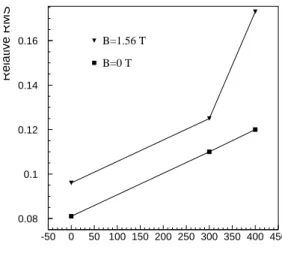
0.08 0.1 0.12 0.14 0.16 -50 0 50 100 150 200 250 300 350 400 450 B=0 T B=1.56 T Wire offset, µm Relative RMSFigure 8. RMS of the straw signal amplitude distribution from55Fe as a function of the wire offset for two
values of the magnetic field (Xe-CO2-O270/27/3).
0.75 0.8 0.85 0.9 0.95 1 1.05 0 20 40 60 80 100 120 140
Source position along the straw, cm
Relative amplitude
Figure 9. Amplitude variation of the55Fe signal along the straw which is irradiated with current density of
0.125µA/cm at the TRT Barrel nominal gas flow.
2 % is needed to provide good operational stability. Oxygen has very strong electronegative prop-erties particularly for electrons which have low energies (low electric field regions) and this may deteriorate amplitude characteristics particularly for the straws with some wire offsets.
Figure 7 shows the attachment coefficient for different TRT working gases. One sees that all of the mixtures have a large attachment coefficient at high electric field near the anode wire but oxygen very strongly absorbs electrons near the straw cathode as well. The larger wire offset lead to more electron losses near the cathode. For 400µm wire offset wire attachment at 2% O2is the same as for 0 offset at 4% O2.
2008 JINST 3 P02013
the magnetic field as a function of the wire offset on the signal amplitude measurements is shown in figure 8. Taking all these effects into account, 3% Oxygen was considered to be enough for satisfactory TRT straw operation.
As was mentioned above, the main stabilising factor in oxygen containing mixture is ozone production in the avalanche near the wire. Under large irradiation dose rates ozone has a tendency to be accumulated downstream of the straw chamber leading to a consequent loss in amplitude because of its extremely high electro-negativity (much larger than for oxygen). Figure 9 shows the signal amplitude variation from the 55Fe source along the 140 cm straw (TRT Barrel straw) at a current density of 0.125 µA/cm (maximum LHC luminosity). The gas flow corresponds to a gas exchange of 1 volume/hour (nominal for the TRT barrel) and is directed from the left side of the picture to its right side. One sees that a substantial drop of the amplitude (about 13%) happens in the first 40 cm of the straw. A balance between ozone production and its dissociation under irradiation is reached. The measured O3concentration was found to be of about 150 ppm. Ozone production does not significantly affect TRT performance. However it is chemically highly aggressive and special measures have to be taken in the TRT gas system to remove this component from the circulating gas. We have also shown that the TRT materials are robust in the presence of ozone. 3.2 Electron drift properties
The charge collection time in the straw is an important parameter for the tracking performance of the TRT at the LHC. It is determined by the electron drift velocity in the gas as a function of the electric field in the straw, by the magnitude and direction of the magnetic field, and by a possible wire offset.
The presence of a magnetic field (∼1.5-2 T for the TRT) alters the trajectory of the electron due to the Lorentz force, which generally leads to an increase in the total electron collection time.
The impact is most significant in the low electric field region, where the drift velocity compo-nent perpendicular to the electric field is not negligible. This region corresponds to the outer 1.2 mm of the 2 mm radius of the straw tube.
The magnetic field effect in a Xe-CO2-O270/27/3 gas mixture (Garfield simulation) is shown in (figure 10). Although the effect of the magnetic field on the drift velocity is quite significant, the difference of the drift velocity component parallel to the electric field is small as can be seen in figure 11.
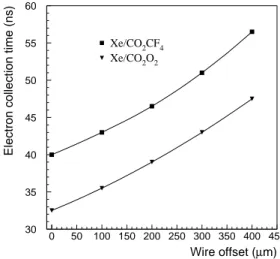
The simulated maximum charge collection time as a function of the magnetic field is shown in figure 12 for two gas mixtures [17]. One sees that at magnetic field B = 0 the difference between the mixtures is 7 ns where as for B = 2 T it is only 4 ns. Detailed simulations for the nominal LHC lumi-nosity show that this increase leads to an increase of maximum straw occupancy from 50% to 53%. It is natural to expect an increase in the maximum drift-time in a straw with an eccentric wire. The electric field near the straw cathode is about 1.6 kV/cm and corresponds to a region of very steep rise of the drift velocity curve, as seen in figure 11. As a direct consequence this affects the mean value and the variation of the arrival time of electrons from the outer radii in the straw. The simulated maximum drift-time as a function of wire offset is shown in figure 13. However beam tests showed that an offset has a negligible impact on the straw drift-time accuracy for the new gas mixture if extrapolation of the R-T dependence is used.
2008 JINST 3 P02013
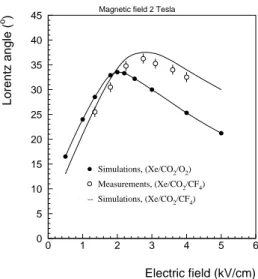
Magnetic field 2 Tesla
0 5 10 15 20 25 30 35 40 45 0 1 2 3 4 5 6 Measurements, (Xe/CO2/CF4) -- Simulations, (Xe/CO2/CF4) Simulations, (Xe/CO2/O2) Electric field (kV/cm) Lorentz angle ( o )
Figure 10. Lorentz angle as a function of electric field for the Xe-CF4-CO2 70/20/10 (simulation and
measurements) and Xe-CO2-O270/27/3 (from simulation only) TRT gas mixtures).
0 1 2 3 4 5 6 7 8 9 0 2.5 5 7.5 10 12.5 15 17.5 20
Old base line mixture (Xe/CO2/CF4)B = 2 T New base line mixture (Xe/CO2/O2)B = 0 T New base line mixture (Xe/CO2/O2)B = 2 T
Electric field (kV/cm)
Drift velocity (cm/
µ
sec)
Figure 11. Drift-velocity component parallel to the electric field as a function of the electric field in the Xe-CF4-CO270/20/10 (B=2 T) and the Xe-CO2-O270/27/3 (B=0 and B=2 T) TRT gas mixtures.
For the TRT tracking performance it is very important to have a stable or very slowly changing R-T dependence. (i.e. the drift-time as a function of the distance from the wire). The dependence of drift velocity on variations of the composition of the gas mixture remains a critical issue.
The ATLAS SCT and Pixel detector have a common gas envelope filled with nitrogen (N2), while the TRT uses CO2 as an envelope gas. The common Inner Detector (Pixel+SCT+TRT) envelope is filled with CO2 as well. In a complex system like this it is not possible to exclude a leakage of N2 into the TRT envelope. Both CO2 and N2 have the ability to diffuse through the straw walls or micro-holes into the operating gas volume. Nitrogen contamination, as well as a change in the CO2fraction, has a significant effect on the electron drift velocity and thus alters the R-T relation (figure 14).
2008 JINST 3 P02013
32.5 35 37.5 40 42.5 45 47.5 50 52.5 0 0.5 1 1.5 2 2.5 Xe/CO2/CF4 Xe/CO2/O2 B field (T)Electron collection time (ns)
Figure 12. Simulated maximum electron drift-time in the straw as a function of magnetic field for the old and the new TRT gas mixtures.
30 35 40 45 50 55 60 0 50 100 150 200 250 300 350 400 450 Xe/CO2CF4 Xe/CO2O2 Wire offset (µm)
Electron collection time (ns)
Figure 13. Simulated maximum electron drift-time in the straw as a function of the wire offset for the old and the new TRT gas mixtures.
The amount of CO2in the operating gas is actively controlled in the TRT gas system and its concentration stability is expected to be at the level of 0.2%, satisfactory for TRT operation. It is not foreseen to have nitrogen removal in the TRT gas system, so the level of nitrogen in the TRT envelop gas volume has to be kept below 0.5% according to specifications.
3.3 Straw signal
A critical issue for the choice of the new gas mixture was compatibility of the front-end electronics with the shape of the signal from the straw. This has particular importance for operation at high counting rates, because preserving the straw drift-time accuracy and efficiency requires a precise
2008 JINST 3 P02013
40 42 44 46 48 50 52 0 0.5 1 1.5 2 2.5 3 3.5 4 4.5 N2 CO2N2 and CO2 concentration variation (%)
Electron collection time (ns)
Figure 14. Variation of the maximum electron drift-time in a straw with changes in the fraction of N2and
CO2in the operating gas (B = 2 T).
0 1000 2000 3000 4000 5000 6000 7000 0 20 40 60 80 100 Binary+3% ethane
Original mixture (Xe/CO2/CF4) Binary + 3% oxygen
Time (ns)
Amplitude (
µ
V)
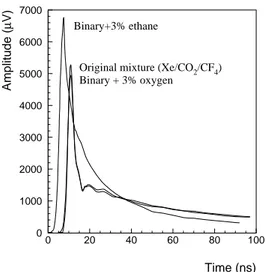
Figure 15. Comparison of the straw signal amplitudes versus time for the old gas mixture and for mixtures containing 3% of ethane and 3% of oxygen.
cancellation of the long ion tail [7, 10]. Fortunately the ion tails for the old and new operating gas mixtures are identical, although, as seen from figure 15 where the measured signal amplitudes for different gas mixtures are shown, the new gas has a 7% decrease of the fast electron component of the signal. The straw signal shape for a mixture containing ethane is however very different. This difference probably arises from a contribution of electron capture process to the observed ion tail. Negative charged ions created in the avalanche in CO2or CF4containing mixtures move towards the wire and create a current which partially compensates the relatively fast drop of the current from the movement of the positive charged ions.
2008 JINST 3 P02013
Electrons 20 Gev, No radiator
10-3
10-2
0 1 2 3 4 5 6 7 8 9 10
E, keV
Number of events (arbitrary units)
Figure 16. Differential spectrum of energy deposits in a single straw for 20 GeV/c pions (pion dE/dX spectrum).
4. TRT straw performance with the new operating gas mixture
To test the performance of the TRT with the new gas mixture, several small-scale TRT prototypes were built and tested in the H8 beam line at the CERN SPS accelerator. The performance was evaluated using electron, pion, and muon beams with momentum varying from 5 to 300 GeV/c. Three precise silicon micro-strip detectors with intrinsic resolution of 10µm were used to deter-mine particle trajectories. Two Cherenkov counters and a preshower detector, together with a small lead-glass electromagnetic calorimeter, were used for beam particle identification.
4.1 Energy deposition and transition radiation measurements
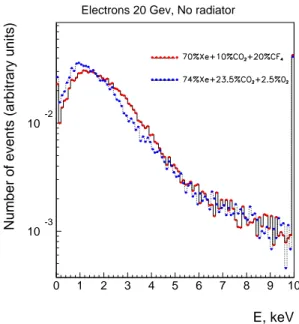
The prototype used for measurements of a dE/dX spectrum and a superposition of the dE/dX and TR (Transition Radiation) spectrums consisted of ten straw layers interleaved with removable stacks of radiator foils. Precise amplitude measurements were made using 10-bit ADCs. Figures 16 and 17 show energy deposit spectra of these straws for pions and electrons in both the Xe/CO2/CF4 and the Xe/CO2/O2 gas mixtures. The most probable energy loss in the new mixture is slightly smaller due to removal of the heavy CF4component while the absorbed TR spectrum remains the same.
Quantitative agreement between test-beam data and Monte-Carlo simulations is important for prediction of the electron/pion separation of the ATLAS TRT detector. A dedicated Monte-Carlo program was developed to simulate the dE/dX and TR energy deposition in a TRT straws. Figure 18 shows the excellent agreement between the data and the Monte-Carlo simulation for the new gas mixture.
2008 JINST 3 P02013
Electrons 20 Gev, Regular radiator
10-2
10-1
0 1 2 3 4 5 6 7 8 9 10
E, keV
Number of events (arbitrary units)
Figure 17. Differential spectrum of energy deposits in a single straw for 20 GeV/c electrons (superposition of dE/dX and TR spectrums for electrons).
Electrons 20 Gev, Regular radiator
10-3 10-2 10-1
0 1 2 3 4 5 6 7 8 9 10
E, keV
Num. of events (arbitr. units)
10-1 1
0 1 2 3 4 5 6 7 8 9 10
E, keV
Probab. to exceed thresh.
Figure 18. Differential spectrum of energy depositions in a single straw for electrons. Comparison of the Monte-Carlo simulation and experimental data (Xe/CO2/O2mixture).
4.2 Drift-time measurements
As described in section 3.2, straw signals from the old and the new gas mixtures are almost identi-cal, so one should not expect a substantial change of the detector performance at high rates using
2008 JINST 3 P02013
10 20 30 40 50 60 -2.5 -2 -1.5 -1 -0.5 0 0.5 1 1.5 2 2.5 Track coordinate in Si (mm) Drift time (ns)Figure 19. Measured relationship between drift-time and minimum distance from the particle tack to the anode wire obtained from extrapolation to the straw of the beam tack reconstructed in a silicon micro-strip telescope for Xe/CO2/O2gas mixture.
the same front-end electronics. For a detailed comparison of the straw performance using differ-ent operating gases, only the analog front-end electronics compondiffer-ent (ASDBLR) was used, while time measurements were performed with a multihit time-to-digital converter (TDC) with 1 ns bin size. Measured relationship between drift-time and minimum distance from the particle tack to the anode wire obtained from extrapolation to the straw of the beam tack reconstructed a in silicon micro-strip telescope for Xe/CO2/O2 gas mixture is shown in figure. 19. This distribution allows to establish time-distance relation to be used for coordinate measurements.
The results of the analysis of the straw coordinate measurement properties are presented in fig-ures. 20 and 21, showing respectively the drift-time measurement accuracy (coordinate measure-ment accuracy-σ) and the drift-time measurement efficiency (probability for of the reconstructed coordinate to be within ±2.5σ of the projected track) for the old and the new gas mixtures as a function of the straw counting rate. The drift-time measurement accuracy for the Xe/CO2/O2gas mixture is better by 10-20µm than for the CF4-containing one, while the drift-time measurement efficiency remains the same even at the highest expected counting rates (20 MHz) at the LHC. The somewhat worse drift-time measurement accuracy in Xe/CO2/CF4is not only due to its faster drift velocities compared to the oxygen-containing gas, but mainly comes from large fluctuations in the arriving electron cluster size, due to the strong electron attachment at high electric fields (figure 7). At high particle rate of up to 500 kHz/cm, as expected in the most exposed parts of the TRT during operation, space-charge effects could affect detector performance. This effect has been studied in detail for the old TRT gas mixture, where no change was observed in the signal amplitude at rates up to 500 kHz/cm or in the drift-time accuracy up to 750 kHz/cm [6].
These studies were repeated for the new gas mixture. A straw placed in a test beam with a silicon tracking setup was at the same time exposed to the 6 keV X-rays rays from an55Fe source that gave a maximum rate of 350 kHz/cm. The space-charge effects expected from this rate of
2008 JINST 3 P02013
50 60 70 80 90 100 110 120 130 140 150 0 2.5 5 7.5 10 12.5 15 17.5 20New gas mixture Original gas mixture
Straw counting rate(MHz)
Drift-time mesurement accuracy (
µ
m)
Figure 20. Drift-time measurement accuracy as a function of the straw counting rate for the original (Xe/CO2/CF4) and new (Xe/CO2/O2) gas mixtures.
0 20 40 60 80 100 0 2.5 5 7.5 10 12.5 15 17.5 20
New gas mixture Original gas mixture
Straw counting rate(MHz)
Drift-time measurement efficiency (%)
Figure 21. Drift-time measurement efficiency as a function of the straw counting rate for the original (Xe/CO2/CF4) and new (Xe/CO2/O2) gas mixtures.
6 keV X-rays correspond to those expected from minimum-ionising particles (about 2 keV) at a rate of 900 kHz/cm (about twice the maximum expected at the LHC). Some results of the studies are shown in figure 22. One sees that the straw drift-time accuracy is degraded from 110µm (no rate) to 130µm (maximum rate). There was no significant change of the drift-time hit efficiency registration observed. Since the straw drift-time accuracy has not been observed to be affected at these high rates for the original gas mixture, the degradation observed in these measurements most likely arises from the local high ozone concentration in the avalanche region.
The complete TRT read-out chain contains a DTMROC chip which has 3.125 ns time bin-ning [18]. This time binbin-ning has an impact in the drift-time measurement precision. TRT straw
2008 JINST 3 P02013
Silicon - straw difference (mm)
0 100 200 300 400 500 600 -1 -0.5 0 0.5 1 σ=110.3 µm
Silicon - straw difference (mm)
0 25 50 75 100 125 150 175 200 -1 -0.5 0 0.5 1 σ=130.0 µm
Figure 22. Distribution of difference between straw hit position and beam particle track for two background particle rate: 0 kHz/cm (left) and equivalent of 900 kHz/cm minimum ionising particles (right).
115 120 125 130 135 140 145 150 150 200 250 300 350 400 450 Threshold (eV)
Drift-time mesurement accuracy (
µ
m)
Figure 23. Drift-time measurement accuracy as a function of the threshold for the complete TRT read-out chain (Xe-CF4-CO2).
drift-time measurement accuracy and drift-time measurement efficiency as a function of threshold for the complete TRT readout chain are shown in figures 23 and 24. These show the drift-time accuracy which can be achieved in the TRT with the final TRT electronics is about 130 µm and drift-time hit registration efficiency is about 85% for the TRT operation thresholds of 250–300 eV what corresponds to 10 primary electrons.
2008 JINST 3 P02013
70 75 80 85 90 95 100 150 200 250 300 350 400 450 Drift-time efficiency Hit-registration efficency Threshould (eV) Efficiency (%)Figure 24. Drift-time measurement and straw hit efficiency as a function of the threshold for the complete TRT read-out chain (Xe-CF4-CO2).
5. Operation with Ar-CO2mixture
Xenon is a very expensive gas. During detector assembly, acceptance testing, and the initial com-missioning period a mixture of 70% Ar + 30% CO2was used. This mixture provides stable operat-ing characteristics at lest up to gas gains of 6 · 104, which is reached at about 1500 V, figure 4. This binary gas is less stable than the 70%Xe+27%CO2+3%O2mixture, particularly for heavy-ionizing particles, in the wire regions with hot spots or at high particle densities. However it still offers a long working plateau (up to 1770 V) at the detector testing conditions and can be considered safe for operation at 1450 V.
To obtain a reference point for the TRT commissioning period, straw performance with this mixture was studied at the test beam. The results in figures 25 and 26 show that a drift-time accuracy of 190µm and a drift-time hit registration efficiency of 78% was obtained. The somewhat worse results in comparison to the TRT xenon mixtures arise mainly from the lower density of this mixture, which results in fewer primary ionisation clusters.
This binary gas mixture has a much shorter collection time as shown in figure 25. Operation of the TRT with this gas would lead to a reduction of the straw occupancy from adjacent bunches by about factor of two at the nominal LHC luminosity.
6. Conclusions
The TRT straw performance requirements are defined by the operating conditions in the ATLAS experiment at the LHC. The TRT is situated close to the proton-proton interaction point and the particle fluxes through the straws are therefore very high (table 2). The TRT detector will be operated with the gas mixture Xe-CO2-O270/27/3. This gas mixture has been extensively validated in terms of high-rate performance and ageing behavior.
2008 JINST 3 P02013
10 20 30 40 50 60 70 -2.5 -2 -1.5 -1 -0.5 0 0.5 1 1.5 2 2.5 Track coordinate in Si (mm) Drift time (ns)Figure 25. Measured relationship between drift-time and minimum distance from the particle tack to the anode wire obtained from extrapolation to the straw of the beam tack reconstructed in a silicon micro-strip telescope for Ar CO2mixture (70/30).
0 50 100 150 200 250 300 350 400 -1.25 -1 -0.75 -0.5 -0.25 0 0.25 0.5 0.75 1 1.25 Silicon - straw coordinate difference (mm) Straw efficiency:
78% (2.5σ) 88% total Drift-time accuracy:
189 µm
Figure 26. Distribution of the difference between the beam particle track and the reconstructed distance of the hit from the anode wire for Ar-CO270/30.
Table 3 summarises of the straw operation properties with the new gas mixture and with the Ar-CO2mixture, used during production, acceptance testing, and the initial TRT commissioning.
The results on straw performance and straw ageing (to be published separately) lead us to the firm conviction that the TRT will reach its expected performance at nominal LHC luminosity. Acknowledgments
The research described in this publication was partly supported by following funding agencies: the European Union (DGXII), the International Science Foundation, the Swedish Research Council, the Knut and Alice Wallenberg Foundation, the Ministry of Science and Higher Education, Poland,
2008 JINST 3 P02013
Table 2. TRT straw operation conditions in the ATLAS experiment.
Parameter Value
Charged particle dose accumulated over 10 years up to 10 MRad
Neutron fluence over 10 years up to 2·1014n/cm2
Straw counting rate up to 20 MHz
Ionising particle density in the straw up to 500 kHz/cm
Ionising current density up to 0.15µA/cm
Total charge accumulated over 10 years 10 C per 1 cm of wire
Induced Xe radioactivity stored in the TRT 8 mCi
Table 3. TRT straw operation properties.
Parameter Value
Working point (gas gain 2.5·104) 1530 V
Operation plateau: about 200 V
Maximum electron collection time:
B=0 40 ns
B=2 T 48 ns
Maximum straw occupancy 53% (50% for old gas mixture)
Straw operation threshold:
Low Level 250-300 eV
High Level 7 keV
Particle density effect at 900 kHz/cm:
Drift-time accuracy change from 110 to 130µm
Drift-time measurement efficiency no change Counting rate effect at 18 MHz:
Drift-time accuracy change from 100 to 120µm
Drift-time measurement efficiency change from 81% to 52% Operation with complete TRT read-out chain
Drift-time accuracy about 130µm
Drift-time measurement efficiency about 85%
Total efficiency about 95%
TR performance the same as with old gas mixture
Operation with Ar-CO2mixture:
Drift-time accuracy 187µm
Drift-time measurement efficiency 78%
Total efficiency 88%
the International Science and Technology Centre, the Civil Research and Development Foundation and grants from the U.S. Department of Energy and the U.S. National Science Foundation, the Nat-ural Science and Engineering Research Council of Canada, the Ministry of Education and Science of the Russian Federation, the Academy of Science of the Russian Federation, the International
As-2008 JINST 3 P02013
sociation for the Promotion of Cooperation with Scientists from the new Independent States of the former Soviet Union, the Turkish Atomic Energy Authority, the Danish Natural Science Research Council.
References
[1] ATLAS collaboration, ATLAS Inner Detector Technical Design Report vol. 1, ATLAS TDR 4, CERN/LHCC 97-16 (1997) and vol. 2, ATLAS TDR 5, CERN/LHCC 97-17 (1997).
[2] ATLAS collaboration, ATLAS experiment at the CERN Large Hadron Collider, Submitted to JINST, 24 December 2007.
[3] E. Abat et al., The ATLAS TRT Barrel detector, to be published in JINST. [4] E. Abat et al., The ATLAS TRT End-Cap detector, to be published in JINST.
[5] T. Åkesson et al., Aging studies for the ATLAS Transition Radiation Tracker (TRT), Nucl. Instrum. Meth. A 515 (2003) 166.
[6] T. Åkesson et al., Study of straw proportional tubes for a transition radiation detector/tracker at LHC, Nucl. Instrum. Meth. A 361 (1995) 440.
[7] T. Åkesson et al., The Atlas TRT straw proportional tubes: performance at very high counting rate, Nucl. Instrum. Meth. A 367 (1995) 143.
[8] T. Åkesson et al., Particle identification performance of a straw transition radiation tracker prototype, Nucl. Instrum. Meth. A 372 (1996) 70.
[9] T. Åkesson et al., Electron identification with a prototype of the Transition Radiation Tracker for the ATLAS experiment, Nucl. Instrum. Meth. A 412 (1998) 200.
[10] T. Åkesson et al., Straw tube drift-time properties and electronics parameters for the ATLAS TRT detector, Nucl. Instrum. Meth. A 449 (2000) 446.
[11] E. Abat et al., The ATLAS TRT electronics, sumbitted to JINST.
[12] A. Romaniouk, Development of the Transition Radiation Tracker (TRT) for the ATLAS experiment at
LHC, Workshop Proceedings “TRDs for the 3rdMillennium”, Bari (Italy), 20-23 September 2001,
Frascati Physics Series XXV (2001) 93.
[13] P. Cwetanski, A. Romaniouk and V. Sosnovtsev, Systematic studies of the gas mixtures for the straw
based Transition Radiation Detectors, Workshop Proceedings “TRDs for the 3rdMillennium”, Bari
(Italy), 20-23 September 2001, Frascati Physics Series XXV (2001) 109.
[14] J. Va’vra, Review of wire chamber aging, Nucl. Instrum. Meth. A 252 (1986) 547.
[15] T. Akesson et al., Operation of the ATLAS Transition Radiation Tracker under very high irradiation at the CERN LHC, Nucl. Instrum. Meth. A 522 (2004) 25.
[16] M. Capeans et.al., Recent aging studies for the ATLAS transition radiation tracker, IEEE Trans. Nucl. Sci. 51 (2004) 960.
[17] P. Cwetanski, Doctoral Dissertation, University of Helsinki (Finland), June 2006. Report Series in Physics HU-P-D133, ISSN 0356-0961 or CERN-THESIS-2006-025.
[18] M. Newcomer, Design and implementation of the ATLAS TRT front end electronics, Nucl. Instrum. Meth. A 563 (2006) 306.