Financial Services Institute Symposium – 2010, New York
Page 1
THE DETERMINANTS OF MERGER AND ACQUISITIONS IN TURKEY
Özlem Taşseven,PhD
DogusUniversity, Istanbul,Turkey
Yıldız Y.Güzey,PhD
Izmir University, Izmir, Turkey
I.Hilmi Elifoglu, Ph.D.
St.John’s University,New York,USA
Abstract
This is a comparative study of the 14 Istanbul Stock Exchange registered mergers and acquisitions (M&As) that took place between 2000 and 2007. In our analysis, we have compared 30 different financial ratios to identify the impact of the M&As before and after the acquisition. Employing the factor analysis methodology, we grouped those financial ratios into four distinct groups. These groups were identified as liquidity, profitability, operational and financial ratios.
During the second phase of our analysis, by looking at those factors before and after an M&A transaction, we tried to identify whether there were any significant changes in the financial structures after an M&A. The Wilcoxon tests indicated that there were no significant changes in the financial structure before and after an M&A for the firms in hand.
During the next phase of our analysis, we tried to identify the firms that are significantly different from the industry average. In other words, in which aspects the firms that were the subject of an M&A differed from the rest of the industry. We found out some 9 firms differed with respect to profitability, six firms differed with respect to liquidity, six firms differed with respect to financial, and 7 firms differed with respect to operational aspects.
JEL Classification: G34, C31 L80, L60, M21
Key words: Mergers and Acquisitions,
I. INTRODUCTION:
Motives for mergers and acquisitions (M&As) have been studied in greater detail in economics and
finance. A merger or acquisition is a type of investment that will provide additional capacity for new products or access to new technologies or markets in a short period of time. From a long term point of view, an M&A is a tool that can help to obtain some long term goal (e.g. market share). Regardless of the time dimension, an M&A is expected to lower the cost of production, improve quality and/or volume, access to new technologies and/or products.
Financial Services Institute Symposium – 2010, New York
Page 2
Some M&As are found to be induced by the changes in the tax code (as seen just before the enactment of the 1986 Tax Act in the USA). In some instances, desire to establish monopoly have been seen as the primary reason for an M&A [Stigler, 1950]. In some merger and acquisitions self-aggrandizement, or greed have also been claimed as the primary reason for an M&A.II. WAYS TO DETERMINE THE IMPACT OF M&As
There has been a large number consequences of an M&A have also been studied in greater detail from the acquirer and target firms' point of view. The following is a brief review of the methodology used to determine the
consequences of M&As.
The stock market event approach (based on the efficient market hypothesis) looks at the abnormal stock price movements around the time of the M&A announcements. Some studies examine the stock prices for rival firms during the same period.
The accounting data approach measures the impact of an M&A by looking at the accounting data before and after an M&A, such as changes in the accounting ratios for profitability against the industry averages
A third approach seems to be based on the analysis of stockholders gains via the combination of the stock prices and accounting data. Based on large samples, some of these studies analyze the impact of an M&A on the long term stock prices.
Anti-competitive impact research is based on the anti-competitive effect of M&As on product prices, volume of output and quality. This is usually the approach employed by governmental agencies to prevent monopolies.
III. THE IMPACT OF M&As
The existing literature on stock prices consistently shows significant gains for target firms. The evidence for the acquiring side is not clear. While the stock price for the target firm increases approximately 20-30 percent, the acquirer's stock price rarely increases more than 5 percent.
The literature on the market power indicates is inconclusive. However, In some horizontal merger cases, such as airlines, rivals obtained positive excess returns in areas where concentration was high Similarly, mergers in the retail foods sector had no anticompetitive effect.
Similarly, the accounting data approach does not support the hypothesis that merging firms were more profitable after a merger [Mueller et al]. Kaplan and Weisbach [1992] found out that 44 percent of the acquisitions were divested in a very short period, usually associated with a loss For instance, the AT& T's purchase of NCR is estimated to cause a loss of $4 to $6 billion dollars to AT&T shareholders. In summary, mergers are riskier endeavors than simply buying assets. They require more planning and understanding of the consequences of the transaction.
Financial Services Institute Symposium – 2010, New York
Page 3
IV. DATA ON MERGERS AND ACQUISITIONS IN TURKEYThe UNCTAD's historical data on Turkey indicates that M&As have not been a popular investment alternative for this country. There were very few instances of M&As prior to 1990s. In 1995, a new law {4054} was enacted to regulate the field of M&As. As a result of recent changes in the tax code there has been a noticeable increase in the merger and acquisition activity. 1997. In 2000, the Section 29 of the Tax code 4605 created additional tax exempt status for M&As. A similar change in the tax code in 2001 {4684} provided additional incentives for M&As.
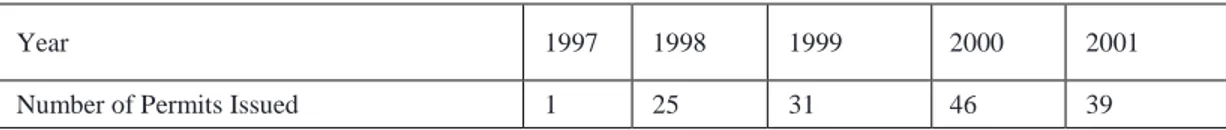
Table 1 below summarizes the dramatic change that took place after 1997. Table 1. Permits for Mergers and Acquisitions by the Turkish Competition Board
Year 1997 1998 1999 2000 2001
Number of Permits Issued 1 25 31 46 39
In addition to the domestic merger and acquisition activities among the Turkish firms, there has been a noticeable increase in the amount of direct foreign investment since 2001. YASED (Foreign Capital Association in Turkey) claims that Turkey's potential for foreign direct investment status has jumped up from 123 to 72. In summary, the business atmosphere has been better since 2001 and the statistics proves this point. (See Table 2 below)
Table- 2. Merger And Acquisitions In Turkey (1999-2007)
YEAR 1999 2000 2001 2002 2003 2004 2005 2006 2007 MERGER 5 13 6 14 7 7 5 4 6 ACQUISITION 56 70 73 83 76 88 122 138 193 JOINT VENTURE 5 11 7 6 9 8 8 23 22 PRIVATIZATION 2 6 - - 14 19 35 21 11 TOTAL 68 100 86 103 106 122 170 186 232
Source: Competition Board
V. METHODOLOGY AND THE EMPRICAL RESULTS
In this study, we are interested in the financial results of those firms engaged in a merger and acquisition activity. Our methodology is based on the accounting data approach as explained above. We will compare financial and operating ratios of the merged or acquired companies with the rest of the industry. Our sample includes 14 publicly held companies listed in the Istanbul Stock Exchange that were subject to a merger or acquisition during 2000-2007. The Istanbul Stock Exchange's definition of industry is employed in our analysis. The following table
Financial Services Institute Symposium – 2010, New York
Page 4
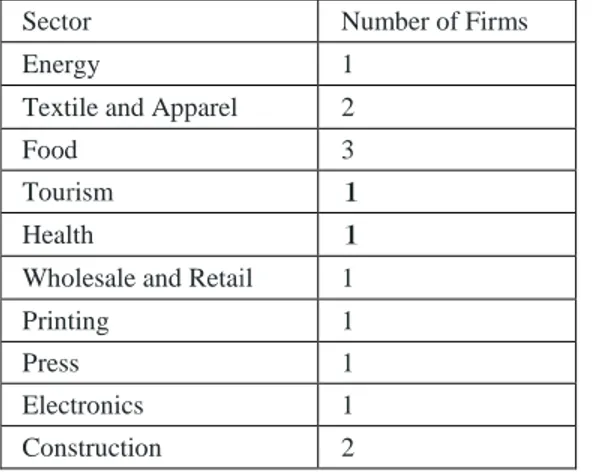
summarizes the sample firms and their industries.Table 3: Distribution of sample companies by industry
Sector Number of Firms
Energy 1
Textile and Apparel 2
Food 3
Tourism 1
Health 1
Wholesale and Retail 1
Printing 1
Press 1
Electronics 1
Construction 2
In our analysis, we have employed 30 financial ratios (listed in Table 4, in the appendix. We classify these ratios in accordance with their usage. The following notation is employed in our statistical analysis.
Liquidity Indicators (L),
Financial Structure Indicators (FY) Operating Indicators (F)
Profitability indicators(K)
At this stage of our investigation, an exploratory factor analysis is used to identify the underlying structure of this relatively large set of variables. Factor analysis is a statistical method used to describe variability among observed variables (usually in large numbers) in terms of a potentially lower number of unobserved variables. These unobserved variables are called factors. Factor analysis estimates how much of the variability is due to these factors.
Since the sample size is limited (less than 25) we will employ the nonparametric Wilcoxon test to compare the results. Nonparametric tests are often used in place of their parametric counterparts when we cannot make assumptions about the probability distributions of underlying populations. Since we cannot make an assumption about the normality of the distribution in our data, the non parametric Wilcoxon test is employed. The results will test the null hypothesis that two populations (before and after data) have identical distribution functions against the alternative hypothesis that the two distributions differ.
a. Identification of factors
The explanatory power of various ratios in each group is identified by employing the Principal Component Analysis (PCA).
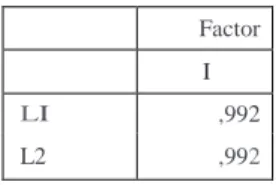
In the liquidity area, the current ratio and the acid test ratio both explained 98 percent of the variance. The Eigen value for the second ratio indicates that there is only one factor in this (See Tables 6-7)
Financial Services Institute Symposium – 2010, New York
Page 5
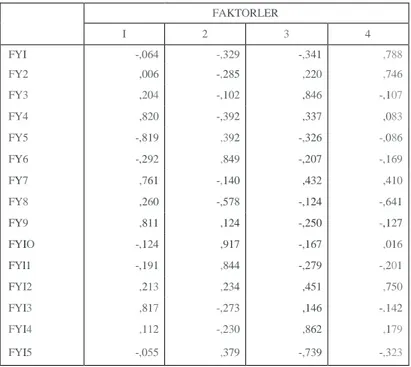
In the profitability area, there were three factors explaining 67.45 percent of the variance (See Tables 8-9)\In the financial structure arena, there were 4 factors explaining 84 percent of the variance (See Tables 10-11)
In the operating group of ratios, there was only one factor explaining 67 percent of the variance (See Tables 12-13)
b. Results of Wilcoxon Test
After identifying the 4 factor groups listed above, we decided to test the merger and acquisition data for our sample using the non parametric Wilcoxon test.. In our tests, we tried to reject the null hypothesis that "there were no differences in the financial structure of a firm after an M&A". Our alternative hypothesis is "there are financial differences in those structures after an M&A."
Ho : There are no differences in the financial structure after an M&A H1: There are differences in the financial structures after an M&A
The following table lists the Wilcoxon test results for the 4 factor mentioned above. None of the levels of significance is less than 5 percent. This allows us( at 5 percent level of significance )to accept the null hypothesis that there are no differences in the financial structures between the two periods. \
Table 4: Wilcoxon Test Results
Financial Operating Liquidity Profitability
(Before and After) (Before and After) (Before and After) (Before and After)
Significance 0.109 0.285 0.109 0.593
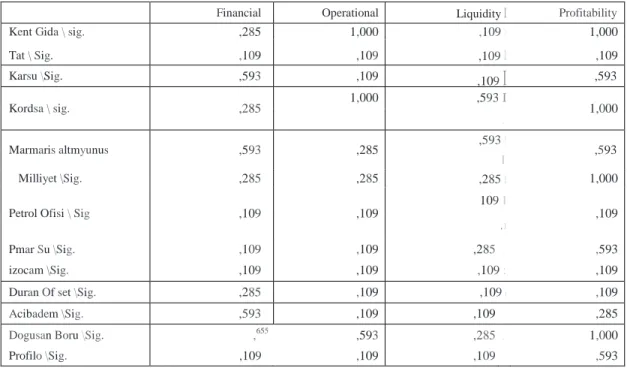
Table 14, below, lists individual corporations and the Wilcoxon test results for each group of industries (numbers in cells represent the obtained level of minimum significance for which the alternative hypothesis would be accepted). As seen in this table none of the industries have a level of significance below 5 percent. Therefore, we accept the null hypothesis which states that there are no differences before and after at the aggregate level.
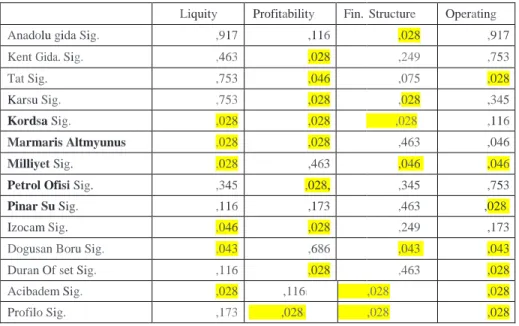
The following table, Table 15, presents Wilcoxon results for the following hypothesis. Ho: the financial ratios of merged corporations and their industries are not different H1: the financial ratios of merged corporations and their industries are different.
At the individual level, results are somewhat mixed. Most corporations in our sample shows some difference in some of the ratios with the rest of their sector after an M&A. Shaded numbers in Table 15 indicate at least one significant difference between our sample firms and their respective industry before
Financial Services Institute Symposium – 2010, New York
Page 6
and after M&A. Unfortunately, there is no uniform difference in ratios even within a single industry. Forinstance, while Anadolu Gida shows significant difference with the food sector in terms of financial structure, Kent Gida shows difference in profitability aspect.
The rest of the ratios show similar tendencies for our sample firms. Even though there are no significant differences before and after data in our four factors as a whole, individual firms show at least one significant difference in one of the factors with the rest of firms in their respective industry.
Further analysis of the same table (Table 14) reveals that the largest difference in the before and after data is based on the factors associated with profitability. More than half of the firms showed a change in profitability with respect to their industry after an M&A The factors associated with financial structure and operations were significant for half of the firms. The liquidity related factors were significant for 6 out of 14 firms.
Bibliography:
Scheffman, Making Sense of Mergers, The Antitrust Bulletin 715 (Fall 1993)
Andrada, Mitchell and Stafford, New Evidence and Perspectives on Mergers, Journal of Economic Perspectives 103, (Spring 2001)
Sirower and O’Brien, The Measurement fo Post-Acquisition Performanc: Towarda Value Based Benchmarking Methodology, Journal of Applied Finance, (Summer 1998)
Jensen, Takeovers: Their Causes and Consequences, Journal of Economic Perspectives, 21, Winter 1988 Kaplan and Weisbach, The Success of Acquisitions: Evidence for Divestitures, Journal of Finance 1078,
March 1992.
Sirower and O’Bryne, The Measurement of Post-Acquisition Performance: Toward a Value Based Benchmarking, Journal of Applied Finance (Summer 1998)
Healy, Palepu and Ruback, Does Corporate Performance Improve after Mergers?, Journal of Financial Economics, 1992
Financial Services Institute Symposium – 2010, New York
Page 7
Table 5: List of Ratios EmployedL1 Current Assets / Current Liabilities
L2 (Current Assets - Inventories) / Current Liabilities
FY1 Inventories / Current Assets
FY2 Inventories/ Total Assets
FY3 Total Liabilities / Total Assets
FY4 Share Holders' Equity / Total Assets
FY6 Share Holders' Equity / Total Liabilities FY7 Current Liabilities / Share Holders' Equity
FY8 Long Term Debt / Share Holders' Equity
FY9 Fixed Assets / Share Holders' Equity
FYlO Fixed Assets / Long Term Debt
FYll Fixed Assets / Total Liabilities FY12 Current Liabilities / Total Liabilities FY13 Total Liabilities / Total Assets
FY14 Current Assets / Total Assets
FYl5 Fixed Assets / Total Assets
Fi Cost of Goods Sold/ Average Inventory
F2 Net Sales /Total Assets
F3 Net Sales /Current Assets
F4 Net Sales /Fixed Assets
Ki (Net Income Before Taxes + Interest Income) / Shareholder's Equity.
K2 Net Income/ Total Assets
K3 Operating Income / Net Sales
K4 Cost of Goods Sold / Net Sales
K5 Net Income Before Taxes / Net Income
K6 Operating Expenses /Net Sales
K7 Interest Expense / Net Sales
K8 Gross Profit / Net Sales
Financial Services Institute Symposium – 2010, New York
Page 8
Table 6:Factors Associated with LiquidityFactor I
LI ,992 L2 ,992
Table 7: Explanatory value of the liquidity related factors
Total Variance Explained
Initial Eiqenvalues Extraction Sums of Souared Loadinos Component Total % of Variance Cumulative % Total % of Variance Cumulative % 1 1,967 98,361 98,361 1,967 98,361 98,361
2 ,033 1,639 100,000
Extraction Method: Principal Component Analysis.
Table 8: Profitability Related Ratios
FACTORS I 2 3 KI ,150 -,839 ,139 K2 ,385 -,064 -,648 K3 ,367 ,755 -,176 K4 ,146 ,490 ,407 K5 ,064 -,357 ,703 K6 ,782 -,001 ,097 K7 ,757 ,233 ,087 K8 ,875 ,051 -,188 K9 ,941 -,003 -,168
Table 9: Explanatory value of the Profitability related factors Total Variance Explained
Initial Eicenvalues Extraction Sums of Squared l.oadinqs Rotation Sums of Squared l.oadinos Comoonent Total % of Variance Cumulative % Total % of Variance Cumulative % Total % of Variance Cumulative % 1 3,375 37,497 37,497 3,375 37,497 37,497 3,166 35.175 35,175 2 1,644 18,267 55,764 1,644 18,267 55,764 1,702 18,915 54,090 3 1,052 11,689 67,453 1,052 11,689 67,453 1,203 13,363 67,453 4 ,924 10,268 77,721 5 ,706 7,848 85,569 6 ,489 5,430 90,998 7 ,460 5,107 96,106 8 ,300 3,331 99,437 9 ,051 ,563 100,000
Financial Services Institute Symposium – 2010, New York
Page 9
Extraction Method: Principal Component AnalYSIS.Financial Services Institute Symposium – 2010, New York
Page 10
Table 10: Financial Structure Related Ratios
FAKTORLER I 2 3 4 FYI -,064 -,329 -,341 ,788 FY2 ,006 -,285 ,220 ,746 FY3 ,204 -,102 ,846 -,107 FY4 ,820 -,392 ,337 ,083 FY5 -,819 ,392 -,326 -,086 FY6 -,292 ,849 -,207 -,169 FY7 ,761 -,140 ,432 ,410 FY8 ,260 -,578 -,124 -,641 FY9 ,811 ,124 -,250 -,127 FYIO -,124 ,917 -,167 ,016 FYl1 -,191 ,844 -,279 -,201 FYI2 ,213 ,234 ,451 ,750 FYI3 ,817 -,273 ,146 -,142 FYI4 ,112 -,230 ,862 ,179 FYI5 -,055 ,379 -,739 -,323
Table 11: Explanatory Values associated with the Financial Structure
Total Variance Explained
Initial Eioenvalues xtraction Sums of Squared Loadino: Rotation Sums of Squared Loadincs
Componer Total o of Variance umulative 01< Total o of Varianc umulative Of< Total o of Variance umulative 01<
1 6,393 42,618 42,618 6,393 42,618 42,618 3,560 23,733 23,733 2 2,731 18,208 60,826 2,731 18,208 60,826 3,475 23,170 46,902 3 1,968 13,120 73,946 1,968 13,120 73,946 3,028 20,189 67,091 4 1,559 10,396 84,342 1,559 10,396 84,342 2,588 17,251 84,342 5 ,882 5,879 90,220 6 ,569 3,796 94,016 7 ,253 1,684 95,700 8 ,245 1,634 97,334 9 ,184 1,229 98,563 10 ,098 ,651 99,214 11 ,052 ,344 99,557 12 ,038 ,251 99,809 13 ,022 ,147 99,956 14 ,005 ,032 99,988 15 ,002 ,012 100,000
Financial Services Institute Symposium – 2010, New York
Page 11
Table 12: Explanatory Values associated with Operating Ratios
Total Variance Explained
Initial Eiqenvalues Extraction Sums of Squared Loadinqs
Component Total % of Variance Cumulative % Total % of Variance Cumulative %
1 2,551 63,764 63,764 2,551 63,764 63,764
2 ,952 23,790 87,554
3 ,385 9,621 97,175
4 ,113 2,825 100,000
Extraction Method: Principal Component Analysis.
Table 13: Sample corporations and Wilcoxon Results for their industry (before and after)
Financial Operational LiquidityI Profitability
Kent Gida \ sig. ,285 1,000 ,109 ! 1,000 , Tat \ Sig. ,109 ,109 ,109 I ,109 Karsu \Sig. ,593 ,109 ,109
I
,593 Kordsa \ sig. ,285 1,000 ,593 I 1,000 , Marmaris altmyunus ,593 ,285 ,593 ! ,593 I Milliyet \Sig. ,285 ,285 ,285 i 1,000 Petrol Ofisi \ Sig ,109 ,109 109 I ,109 , I Pmar Su \Sig. ,109 ,109 ,285 , ,593 izocam \Sig. ,109 ,109 ,109 : ,109 Duran Of set \Sig. ,285 ,109 ,109 I ,109 Acibadem \Sig. ,593 ,109 ,109 ,285 Dogusan Boru \Sig. ,6551 ,593 ,285 , 1,000 Profilo \Sig. ,109 ,109 ,109 ,593Financial Services Institute Symposium – 2010, New York
Page 12
Table 14 - Wilcoxon results for Sample and Sector differences Toplam Sektorler Icin Wilcoxon
SonnTablosu
Liquity Profitability Fin. Structure Operating
Anadolu gida Sig. ,917 ,116 ,028 ,917 Kent Gida. Sig. ,463 ,028 ,249 ,753 Tat Sig. ,753 ,046 ,075 ,028 Karsu Sig. ,753 ,028 ,028 ,345 Kordsa Sig. ,028 ,028 ,028 ,116 Marmaris Altmyunus ,028 ,028 ,463 ,046 Milliyet Sig. ,028 ,463 ,046 ,046 Petrol Ofisi Sig. ,345 ,028, ,345 ,753 Pinar Su Sig. ,116 ,173 ,463 ,028. Izocam Sig. ,046 ,028 ,249 ,173 Dogusan Boru Sig. ,043 ,686 ,043 ,043 Duran Of set Sig. ,116 ,028 ,463 ,028 Acibadem Sig. ,028 ,1161 ,028 ,028 Profilo Sig. ,173 ,0281 ,028 ,028