Volume 8, Issue 1 2011 Article 16
Emergency Management
Is Better Nuclear Weapon Detection
Capability Justified?
Niyazi Onur Bakir, Bilkent University
Detlof von Winterfeldt, International Institute for Applied
Systems Analysis
Recommended Citation:
Capability Justified?
Niyazi Onur Bakir and Detlof von WinterfeldtAbstract
In this paper, we present a decision tree model for evaluation of the next generation radiation portal technology (Advanced Spectroscopic Portals or ASPs) to scan containers entering the United States non-intrusively against nuclear or radiological weapons. Advanced Spectroscopic Portals are compared against the current designs of portal monitors (plastic scintillators or PVTs). We consider five alternative deployment strategies: 1) Exclusive deployment of ASPs replacing all the PVTs currently deployed at U.S. ports of entry, 2) Sequential deployment of ASPs with PVTs installing ASPs in all secondary and some primary inspections areas, 3) Sequential deployment of ASPs with PVTs installing ASPs in only secondary inspections areas, 4) Exclusive deployment of PVTs, 5) Stop deployment of new portal monitors and continue inspections with the current capacity. The baseline solution recommends a hybrid strategy that supports the deployment of new designs of portal monitors for secondary inspections and current designs of portal monitors for primary inspections. However, this solution is found to be very sensitive to the probability of attack attempt, the type of weapon shipped through ports of entry, the probability of successful detonation, detection probabilities and the extra deterrence that each alternative may provide. We also illustrate that the list of most significant parameters depends heavily on the dollar equivalent of overall consequences and the probability of attack attempt. For low probability and low consequence scenarios, false alarm related parameters are found to have more significance. Our extensive exploratory analysis shows that for most parametric combinations, continued deployment of portal monitors is recommended. Exclusive deployment of ASPs is optimal under high risk scenarios. However, we also show that if ASPs fail to improve detection capability, then extra benefits they offer in reducing false alarms may not justify their mass deployment.
KEYWORDS: decision tree, radiation portal monitors, advanced spectroscopic portals, border
security, terrorism
Author Notes: This research was partially supported by the United States Department of
Homeland Security through the National Center for Risk and Economic Analysis of Terrorism Events (CREATE) under grant number 2007-ST-061-000001. However, any opinions, findings, and conclusions or recommendations in this document are those of the authors and do not necessarily reflect views of the United States Department of Homeland Security.
SECTION I: INTRODUCTION
Securing the United States (U.S.) homeland against a terrorist attack using a nuclear or radiological weapon has been an increasing concern in recent years. Many homeland security experts contend that containers could be a perfect medium to deliver dangerous nuclear or radioactive material. According to a survey of national security and non-proliferation experts compiled in 2005 by U.S. Senator Richard G. Lugar (Lugar 2005), the median probability estimate of a nuclear attack somewhere in the world is 0.1 and 0.2 in the next 5 and 10 years respectively. For a radiological dispersion device (RDD, or dirty bomb), these figures jump to 0.25 and 0.40.
While these numbers are probably too high due to common biases in probability estimation, they reflect concerns based on evidence. There were 827 confirmed cases of illicit nuclear and radiological materials trafficking worldwide between 1993 and 2005 (IAEA 2006). A dirty bomb ingredient was discovered in more than 65% of these cases; whereas 16 incidents involved trafficking of highly enriched uranium (HEU) and plutonium (Pu). Some experts believe that terrorists could build a crude nuclear weapon if they can acquire a sufficient amount of HEU or plutonium (see Bunn and Wier 2006, Allison 2004, Maerli et al. 2003). In addition, Rosoff and von Winterfeldt (2007) developed a model on the feasibility of a dirty bomb attack upon the twin Ports of Los Angeles and Long Beach that shows if terrorists can successfully complete the planning and preparation tasks of an attack, there is a reasonable chance that they can accomplish their mission.
To counter this threat, the U.S. Department of Homeland Security (DHS) has been deploying non-intrusive inspection (NII) equipment to ports of entry (POEs). NII equipment at U.S. ports include gamma-ray and x-ray scanners, radiation portal monitors (RPMs), personal radiation detectors and handheld radioactive isotope identification devices. RPMs are the only equipment used in primary inspections to detect the presence of nuclear or radioactive material. Earlier designs of RPMs, “plastic scintillators”, (also known as poly-vinyl toluene, PVT, portal monitors) have been criticized for two reasons. First, they are ineffective in detecting shielded nuclear material emitting low level of radiation (i.e. highly enriched uranium, HEU). Second, they cannot distinguish between harmless and dangerous nuclear and radiological materials thus leading to false alarms. To address these concerns, the Domestic Nuclear Detection Office
yet approved $1.2 billion requested mainly due to concerns raised by the Government Accountability Office (GAO) and lawmakers (GAO 2007a). DHS has been conducting field tests that are expected to prove that ASPs will demonstrate a significant increase in operational effectiveness (see NRC 2009 pg. 29 for the criteria determined by DHS that should be satisfied as an indication of significant increase in operational effectiveness).
This article presents a decision tree model that examines the costs and benefits of deploying ASPs. A similar model is discussed in Bakır (2008). This paper expands on the model in Bakır (2008) by analyzing incoming containers at all POEs in U.S and evaluating the ASP deployment strategies that are considered by DNDO. Also, more recent information made available by the GAO and other reports warrant a new and a deeper look into the problem. We focus on a scenario of an attack using either a nuclear weapon or a dirty bomb. We parameterize the probability of attack, the probability of weapon detection, and the effectiveness of ASPs in reducing the likelihood of a successful terrorist attack and providing more deterrence. The model accounts for the cost of false alarms, the economic consequences of a successful attack and the probability of discovering the weapon after smuggling through the border. While we do not obtain precise probabilities of critical events, we determine optimal decisions for realistic parameter values.
SECTION II: DESCRIPTION OF THE DECISION TREE
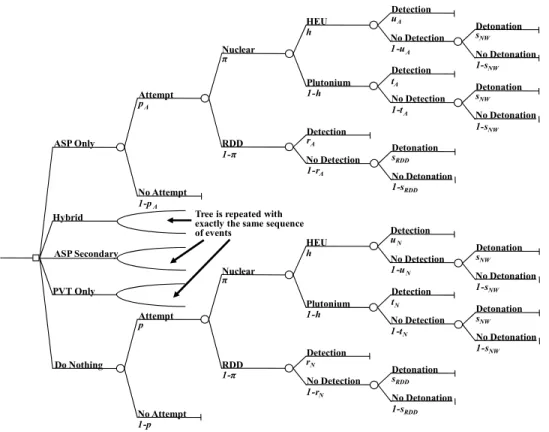
Figure 1 displays the decision tree used to evaluate five alternatives: “Deploy ASPs”, “Hybrid”, “ASP secondary”, “Deploy PVTs” and “Do nothing”. The chain of events following each alternative is identical. However, the probability and cost parameter values associated with these events are different, and are assigned based on the estimates in the open literature. The objective is to minimize overall expected equivalent costs (EEC) in dollar terms. EEC includes the cost of countermeasures, the dollar equivalent cost of human casualties, the impact on the U.S. economy and the cost of false alarms.
(DNDO) contracted the development of advanced passive detection technology. This technology could reduce the false alarm rate while improving the detection performance against shielded nuclear and radioactive material. These next generation RPMs, known as Advanced Spectroscopic Portals (ASPs), have already been through their initial development phase. However, despite DHS’s efforts to advocate the deployment of ASPs at U.S. POEs, the U.S. Senate has not
Figure 1: Decision Tree for Container Inspections at U.S. Ports Do Nothing PVT Only Hybrid ASP Only Attempt Attempt No Attempt No Attempt Nuclear RDD Nuclear RDD HEU Plutonium HEU Plutonium No Detection Detection Detection No Detection No Detection Detection Detection No Detection No Detection Detection Detonation No Detonation Detonation No Detonation Detonation No Detonation No Detonation Detonation No Detonation Detonation Detonation No Detonation No Detection Detection p 1-p pA 1-pA π 1-π π 1-π h 1-h h 1-h uA 1-uA uN 1-uN 1-rA rA rN 1-rN tA 1-tA 1-tN tN sNW 1-sNW sRDD 1-sRDD 1-sNW sNW sRDD 1-sRDD sNW 1-sNW sNW 1-sNW
Tree is repeated with exactly the same sequence of events
ASP Secondary
Countermeasure Decisions
DNDO has not completed its task to deploy RPMs to all U.S. ports. The current plan is to complete deployments by 2013 (GAO 2008). As of October 23, 2008, 1,145 RPMs have been installed (Medalia 2008). The goal is to bring that number up to 2,754 (GAO 2008). DNDO could consider five alternatives to reach this goal. The first alternative, “Deploy ASPs”, considers an inspection scheme that is based on an exclusive use of ASPs for scanning containers. This includes the replacement of PVTs that are currently operational at POEs and the installment of new ASPs. The second alternative, “Hybrid”, is based on DNDO’s project plan to deploy new RPMs to U.S. POEs. The goal is to use ASPs in both primary and secondary inspections at high volume ports and to keep PVTs in primary inspections at other ports. The third alternative, “ASP secondary”, is similar to the “Hybrid” alternative, in that both ASPs and PVTs will be installed at U.S. POEs. The difference is that ASPs will be deployed exclusively to perform secondary inspections while all primary inspection areas will be occupied by PVTs. The fourth alternative, “Deploy PVTs”, calls for continued installment of PVTs
without the use of ASPs. Finally, DNDO has a “Do nothing” alternative that discontinues the deployment of RPMs and uses only the 1,145 PVTs that are currently installed at POEs.
Probabilities and Effectiveness Parameters for the Decision Tree
Each countermeasure decision is followed by the same event sequence, albeit with different probabilities of occurrence. In estimating the baseline probability of an attack attempt using a containerized radiological or nuclear weapon through POEs, p, we considered the following factors: The probability of an attempted attack somewhere in the world, the conditional probability that this attack would occur in the U.S., and the conditional probability that an attack in the U.S. would involve entry of the weapon through a U.S. POE. Since we consider both an RDD and a nuclear attack, we set the baseline probability of this event to be relatively high, at p = 0.20 in 10 years for the “Do Nothing” alternative, realizing that the analysis would consider the whole range of probabilities from 0 to 1.
Table 1: Deterrence of Countermeasure Alternatives
Min Base Max Deterrence of "Deploy ASPs", dA 0 0.20 1
Deterrence of "Hybrid”, dH 0 0.15 1
Deterrence of “ASP Secondary”, dAS 0 0.15 1
Deterrence of “Deploy PVTs”, dP 0 0.10 1
The base value for p does not incorporate any deterrence that new PVTs and ASPs may offer. We revise the probability of attempt under each alternative by multiplying p with a deterrence coefficient (i.e., For “Hybrid”, pH = p x
(1-dH)). Table 1 lists the coefficients for alternatives that require deployment of new
RPMs. The “Do nothing” alternative does not offer extra deterrence (i.e., dN = 0).
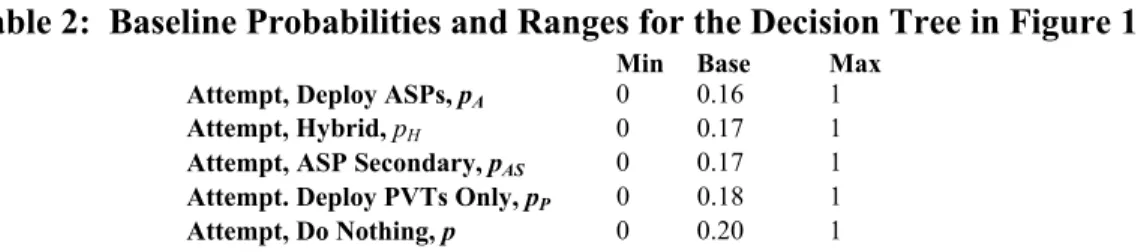
The deterrence levels are set to reflect the improvements in HEU detection probability. Since “Hybrid” and “ASP Secondary” alternatives call for a partial deployment of ASPs, we assume they are equally deterrent. The detection improvement of all alternatives over the “Do nothing” alternative is minimal. Hence, the baseline deterrence levels are set to low values between 0.10 and 0.20. We let all parameters fluctuate between 0 and 1 because in fact there is no means of estimating the actual deterrence. However, a baseline value is needed to do sensitivity analysis. The resulting conditional probabilities are shown in Table 2.
Table 2: Baseline Probabilities and Ranges for the Decision Tree in Figure 1
Min Base Max Attempt, Deploy ASPs, pA 0 0.16 1
Attempt, Hybrid, pH 0 0.17 1
Attempt, ASP Secondary, pAS 0 0.17 1
Attempt. Deploy PVTs Only, pP 0 0.18 1
Attempt, Do Nothing, p 0 0.20 1
The next node in the decision tree models the weapon choice given an attempt. We assume an attempt for a nuclear attack with probability 0.25 (π) and for an RDD attack with probability 0.75 (1-) regardless of the countermeasure alternative. This is consistent with most experts’ opinion that an RDD attack is much more likely than a nuclear attack, primarily because terrorists can access RDD materials much more easily than HEU or Pu. The node that follows the choice of a nuclear weapon is the choice between a plutonium- or an HEU-based nuclear weapon. We assume that both events are equally likely irrespective of the countermeasure alternative, thus h = (1-h) = 0.5.
The next event in the tree is whether the weapon arriving at a POE is interdicted by non-intrusive inspections. The detection probability depends on the weapon material and the particular countermeasure alternative chosen. The baseline probabilities are our rough judgments that were anchored on the probability of detecting an RDD and adjusted in line with experts’ opinions about the relative detectability of RDD or nuclear materials with the possible technological and deployment options. The ranges of detection probabilities are the same for all alternatives (in Table 3). PVTs and ASPs can both detect the gamma radiation emitted by an RDD and neutron radiation emitted by a plutonium-based nuclear weapon. HEU detection is difficult due to the low dose of radiation emitted. Terrorists may also apply shielding to avoid detection. Hence, the probability of detecting an HEU-based nuclear weapon is considerably lower. Experts also believe that ASPs will not improve HEU detection capabilities significantly (Cochran 2008).
Table 3: Detection Probability under Various Countermeasure Alternatives
"Deploy ASPs" Min Base Max
Probability of detecting an RDD, rA 0 0.90 1
Probability of detecting a plutonium-based nuclear weapon, tA 0 0.75 1
Probability of detecting an HEU-based nuclear weapon, uA 0 0.35 1
"Hybrid" Min Base Max
Probability of detecting an RDD, rH 0 0.90 1
Probability of detecting a plutonium-based nuclear weapon, tH 0 0.75 1
Probability of detecting an HEU-based nuclear weapon, uH 0 0.35 1
"ASP Secondary" Min Base Max
Probability of detecting an RDD, rAS 0 0.90 1
Probability of detecting a plutonium-based nuclear weapon, tAS 0 0.75 1
Probability of detecting an HEU-based nuclear weapon, uAS 0 0.33 1
"Deploy PVTs" Min Base Max
Probability of detecting an RDD, rP 0 0.90 1
Probability of detecting a plutonium-based nuclear weapon, tP 0 0.75 1
Probability of detecting an HEU-based nuclear weapon, uP 0 0.30 1
"Do nothing" Min Base Max
Probability of detecting an RDD, rN 0 0.85 1
Probability of detecting a plutonium-based nuclear weapon, tN 0 0.70 1
Probability of detecting an HEU-based nuclear weapon, uN 0 0.25 1
The target is an urban area that will be hit after the weapon crosses the border. There is a chance of failure because law enforcement agencies may foil the plot, or weapon detonation may fail. Hence, we add a final node at the end for the detonation event. The probability of successful detonation depends solely on the type of the weapon. We use a base probability of 0.75 for an RDD (sRDD) and
0.25 for a nuclear weapon (sNW). The ranges for both parameters are unrestricted.
Cost Estimates
We primarily use the information in GAO (2008) to estimate the cost of each alternative. GAO estimates procurement, deployment, maintenance, design and development as well as sustainment costs for the project plan prepared by DNDO in 2006. We call this the “Hybrid” alternative. DNDO’s 2006 plan is to deploy 1,034 ASPs and 1,548 PVTs for use in primary and secondary inspections. We directly use the cost figures in GAO (2008) for this alternative.
The costs of other alternatives are calculated under the following assumptions. On average, each PVT costs $55,000 while each ASP costs $377,000 (GAO 2007a). The procurement cost estimated in GAO (2008) includes computer and spares procurement as well. Therefore, we use an approximate unit procurement cost of $100,000 for a PVT and $400,000 for an ASP. O’Harrow (2008) reports the deployment cost as $400,000 and $325,000 per unit for ASPs and PVTs respectively. This includes the cost of one-year maintenance contract,
which is approximately $6,600 per PVT and $80,000 per ASP. Hence, we assume a unit deployment cost of $318,000 for each portal monitor. Design and development cost should be zero for “Do nothing” and “Deploy PVTs” alternatives because GAO’s estimate includes the cost of developing various designs of ASPs only. We assume that the personnel costs for security operations at U.S. POEs are the same under all strategies that call for deployment of new portal monitors. For the “Do nothing” alternative, we use a lower sustainment cost estimate of $250,000,000.
Table 4: Itemized 10-Year Cost of Countermeasure Alternatives, $
Procurement Deployment Maintenance
Design & Development Sustainment Deploy ASPs, cA 1,030,078,208 818,912,176 2,048,173,915 464,477,573 364,988,656 Hybrid, cH 603,678,393 689,107,870 999,242,369 464,477,573 364,988,656 ASP Secondary, cAS 305,044,061 478,477,922 558,999,260 464,477,573 364,988,656 Deploy PVTs, cP 150,453,771 478,442,993 182,851,295 0 364,988,656 Do nothing, cN 0 0 84,129,477 0 250,000,000
Table 5: Ranges for the Cost of Countermeasure Alternatives, (in million $)
Min Base Max Deploy ASPs, cA 3,000 4,727 7,000
Hybrid, cH 2,600 3,100 3,800
ASP Secondary, cAS 1,500 2,172 3,000
Deploy PVTs, cP 500 1,177 2,000
Do nothing, cN 0 334 500
Table 4 lists the estimates of total procurement, deployment, maintenance, sustainment and design and development costs for each alternative. The total cost for “Deploy ASPs” is calculated assuming that 2,754 ASPs will be installed. Under “Deploy PVTs”, we assume that 1,609 PVTs will be installed, which is the difference between the number of RPMs originally planned for deployment, and the number of RPMs currently operational. For “ASP Secondary”, we make a baseline assumption regarding the ratio of RPMs required around U.S. in primary inspections vs. secondary inspections. The baseline ratio is 4 to 1 (i.e. number of PVTs at primary inspections / number of ASPs at secondary inspections ~ 4). The range of cost estimates is selected to include all ratios between 10 to 1 and 2 to 1. The calculations are based on a gradual deployment strategy and a 3% discount rate to account for the time value of money. The estimates are rounded to the nearest million dollars. The baseline estimates (the sum of the cost elements in Table 4) and associated ranges for each alternative are listed in Table 5.
False Alarms
The cost of false alarms is factored into the decision as part of the indirect costs of each alternative. The most challenging piece in calculating the cost of false alarms is the estimation of the average cost a single false alarm, cf. To our knowledge,
there is no study on the average cost of a false alarm in the open literature. Cost of a false alarm should include delay costs as well as the physical examination costs. Currently, Hong Kong Container Terminal Operators Association charges $1500-$2000 (Wein et. al. 2007) per physical examination. In this paper, we assume that physical examination costs $1500, and approximately 10% of containers that are flagged by false alarms are subject to further physical examination (the others being subjected only to external surveys with handheld detection devices). Therefore, the expected physical examination cost per container that triggers a false alarm is $150 (see Table 6 for false alarm cost estimates).
False alarms may cause delays as well. Currently, most false alarms are resolved quickly (Rooney 2005). Hence, delay costs should be negligible. We recognize in reality that the delay impact of false alarms should have a non-linear behavior if we perturb their percentage up to 100%. In fact, a study by Bakshi et. al. (2009) on container delays at foreign ports concludes that almost all containers should be delayed if the fraction of inspected containers reaches 8-9% even under relatively optimistic conditions. Hence, delay costs could become quite significant if the percentage of inspected containers exceed 8-9%. As such, to back up our assumption of negligible delays, we choose 8% as the maximum value for the percentage of false alarms. We use 2.5% for the baseline value of the percentage of scanned containers that generate false alarms (Rooney 2005). Under the assumption of insignificant delays, a range between 0 and $1000 for the average cost of a single false alarm is reasonable and a base value of $150 is justified.
Table 6: Parameters Associated with the Cost of False Alarms
Min Base Max Percentage of false alarms, f 1% 2.50% 8%
Number of incoming containers per year (in millions), N 15 20.4 25
Average cost of a false alarm, $, cpf 0 150 1000
The reduction of false alarms is an important benefit of ASPs. Cochran (2008) states that ASPs could reduce false alarms regardless of whether they are deployed at primary inspections replacing PVTs or at secondary inspections complementing PVTs in primary inspections. According to the ASP evaluation report released by the National Research Council of the National Academies, a performance goal is an 80% reduction in the false alarm rate (NRC 2009). We take this as the baseline for the false alarm benefit of the DNDO’s 2006 plan (i.e.,
“Hybrid” alternative reduces false alarms by 80%). “Deploy ASPs” alternative is assumed to perform slightly better and reduce false alarms by 85%. As far as the annual number of incoming containers, we use a base value of 20.4 million, which is the sum of approximately 9.2 million containers arriving at seaports and 11.2 million trucks crossing land POEs each year (Bonner 2005, Wasem et. al. 2004).
Table 7: False Alarm Effectiveness Parameters, % Reduction
Min Base Max Reduction in the percentage of false alarms for “Hybrid” alternative, feH 0 80 100
Reduction in the percentage of false alarms for “Deploy ASPs” alternative, feA 0 85 100 Economic Consequences
The economic consequences of a successful attack include the overall cost to the U.S. economy and the dollar equivalent of fatalities. The overall cost to the U.S. economy includes direct and indirect costs of business disruption as well as evacuation, property damage and decontamination costs. The cost of fatalities is computed by multiplying the value of life, which is $5 million in the base case, with the number of fatalities. The value of life varies between 0 and $10 million in sensitivity analyses. The number of fatalities for an RDD attack depends on the location of attack, the source and the amount of radiological material as well as the path of the plume. We do not elaborate on the mechanics of the radiation exposure. Instead we refer to the high scenario estimates in Rosoff and von Winterfeldt (2007). We set a base value of 100 for the number of fatalities due to blast and acute radiation effects as well as latent cancers (range from 0 to 200).
Fatality figures for a nuclear attack will be much more dramatic. The estimates vary depending on the attack location, the size of the bomb and how the attack is executed. It is estimated that as high as one million people may die if Manhattan is targeted (Abt Associates 2003). However, most nuclear security experts believe it is unlikely that terrorists will acquire a weapon with a yield to cause such a huge number of fatalities. According to a study by the Council on Foreign Relations, setting off a one-kiloton nuclear weapon in Manhattan would generate about 200,000 casualties (Garwin 2002). As such, we take the nuclear attack death toll to be between 50,000 and 400,000 people (base value = 150,000).
The estimates of overall costs to the U.S. economy vary. Gordon et al. (2005) studies the impact of an RDD attack upon the Ports of Los Angeles & Long Beach and finds that an attack followed by a 120-day shutdown could cost $34 billion. However, this excludes decontamination and property damage costs that could be significant in an urban area. According to a study by Defence Research and Development Canada, an urban area attack could cost up to $250
billion in Toronto, $80 billion in Vancouver and $75 billion in Windsor (Bronskill and Bailey 2007). Our base value for economic costs of an RDD attack, ERDD is
$300 billion (range is between $100 billion and $600 billion). The cost of a nuclear attack should be much higher. A RAND study estimates the cost of an attack at the Ports of Los Angeles & Long Beach to be around $980 billion excluding decontamination and business disruption costs (Meade and Molander 2006). Business disruption and decontamination costs could easily add another $1 trillion to this estimate. Hence, we use a base value of $2 trillion for the overall cost of an urban nuclear attack, EN (range is between $500 billion and $3 trillion).
SECTION III: DISCUSSION OF THE RESULTS
The optimal decision in our model minimizes overall EEC for a set of parameter values. In the baseline case, the model recommends the “ASP Secondary” alternative (EEC ~ $19.25 billion) and picks “Hybrid” as the close second best. “Do nothing” performs worse than the other four alternatives (EEC ~ $24.22 billion). This suggests continuation of the deployment of RPMs.
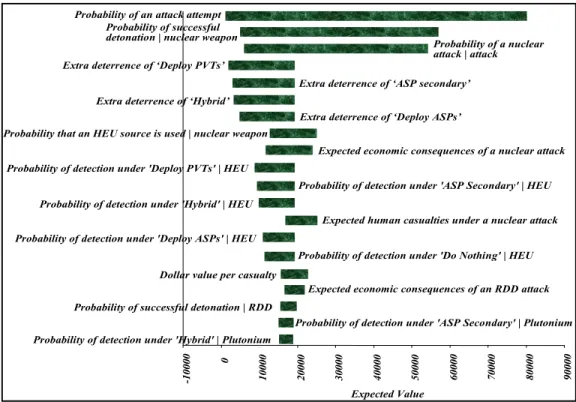
Figure 2: Tornado Diagram to Analyze the Sensitivity of EEC to the Top 20 Significant Parameters in the Model when p = 0.20
-1
00
00 0
10000 20000 30000 40000 50000 60000 70000 80000 90000
Probability of an attack attempt Probability of successful
detonation | nuclear weapon Probability of a nuclear
attack | attack Extra deterrence of ‘Deploy PVTs’
Extra deterrence of ‘ASP secondary’ Extra deterrence of ‘Hybrid’
Extra deterrence of ‘Deploy ASPs’ Probability that an HEU source is used | nuclear weapon
Expected economic consequences of a nuclear attack Probability of detection under 'Deploy PVTs' | HEU
Probability of detection under 'ASP Secondary' | HEU Probability of detection under 'Hybrid' | HEU
Expected human casualties under a nuclear attack Probability of detection under 'Deploy ASPs' | HEU
Probability of detection under 'Do Nothing' | HEU Dollar value per casualty
Expected Value
Expected economic consequences of an RDD attack Probability of successful detonation | RDD
Probability of detection under 'ASP Secondary' | Plutonium Probability of detection under 'Hybrid' | Plutonium
Figure 2 compares the impact of the 20 most significant parameters that EEC is sensitive to. The probability of attempt is the most significant parameter. Two crucial parameters that determine the likelihood of a successful nuclear attack are also quite significant. In general, since the negative consequences of a nuclear attack are higher, the tornado diagram highlights the sensitivity of EEC to parameters associated with a nuclear attack. Not surprisingly, all deterrence parameters are quite influential on EEC due to their direct impact on the probability of attempt. Regarding the weapon material, detection of HEU is critical. None of the current technologies is assumed to identify HEU with a high probability. Therefore, further reduction of terrorism risk by correctly identifying a containerized HEU-based nuclear weapon is recommended by our model.
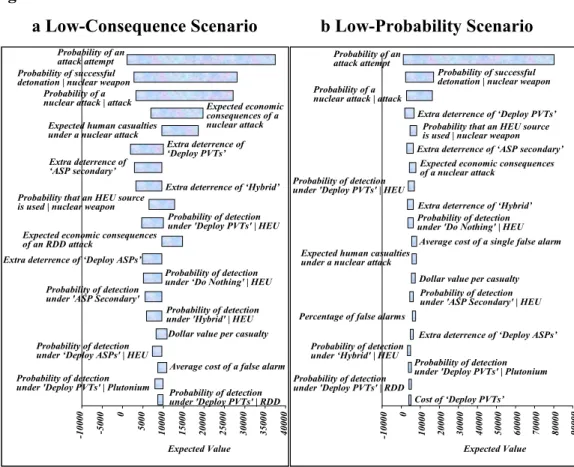
Figure 3: Tornado Diagram to Analyze the Sensitivity of EEC to the Top 20 Significant Parameters in the Model Under Different Scenarios
a Low-Consequence Scenario b Low-Probability Scenario
-1 00 00 -5 00 0 0 50 00 100 00 150 00 200 00 250 00 300 00 350 00 400 00 Probability of an attack attempt Probability of successful detonation | nuclear weapon
Probability of a
nuclear attack | attack Expected economic
consequences of a nuclear attack Expected human casualties
under a nuclear attack
Extra deterrence of ‘Deploy PVTs’ Extra deterrence of
‘ASP secondary’
Extra deterrence of ‘Hybrid’ Probability that an HEU source
is used | nuclear weapon
Probability of detection under 'Deploy PVTs' | HEU Expected economic consequences
of an RDD attack Extra deterrence of ‘Deploy ASPs’
Probability of detection under ‘Do Nothing' | HEU Probability of detection
under 'ASP Secondary'
Probability of detection under 'Hybrid' | HEU
Probability of detection under ‘Deploy ASPs' | HEU
Expected Value Dollar value per casualty
Average cost of a false alarm Probability of detection
under 'Deploy PVTs' | Plutonium Probability of detection
under 'Deploy PVTs' | RDD -1 00 00 0 10 000 200 00 300 00 400 00 500 00 600 00 700 00 800 00 900 00 Probability of an attack attempt Probability of successful detonation | nuclear weapon Probability of a
nuclear attack | attack
Extra deterrence of ‘Deploy PVTs’ Probability that an HEU source is used | nuclear weapon Extra deterrence of ‘ASP secondary’
Expected economic consequences of a nuclear attack
Probability of detection under 'Deploy PVTs' | HEU
Extra deterrence of ‘Hybrid’ Probability of detection under 'Do Nothing' | HEU
Average cost of a single false alarm Expected human casualties
under a nuclear attack
Dollar value per casualty Probability of detection under 'ASP Secondary' | HEU Percentage of false alarms
Extra deterrence of ‘Deploy ASPs’
Expected Value Probability of detection
under ‘Hybrid' | HEU
Probability of detection under 'Deploy PVTs' | Plutonium Probability of detection
under 'Deploy PVTs' | RDD
Cost of ‘Deploy PVTs’
The most significant false alarm parameter is the average cost of a false alarm. While the model does not discount the importance of false alarms, extreme consequences considered here cause the parameters on the risk of terrorism rank higher than the false alarm parameters. In fact, the percentage of false alarms and
the average cost of a false alarm are not among the most significant parameters. Figure 3, which shows the top 20 significant parameters for low-consequence and low-probability scenarios, supports this claim. In the low-probability scenario, all parameters except the probability of attack attempt, p, are kept at their baseline. We set p to 0.05. In the low-consequence scenario, we reduce the baseline value of the economic consequences of a nuclear attack to $1 trillion, the economic consequences of an RDD attack to $100 billion, nuclear attack casualties to 50,000 and RDD attack casualties to 50. All other baseline parameter values are unchanged. The average cost of a false alarm and the percentage of false alarms have more influence on the optimal EEC, particularly in the low-probability scenario. The optimal decision becomes “Deploy PVTs”. When the terrorism risk is lower than the baseline, extra benefits of ASPs do not justify their deployment. In addition, deterrence parameters lose significance slightly, and EEC remains to be sensitive to the expected economic consequences of a nuclear attack. Human losses become more significant as well. Perhaps surprisingly, cost parameters exert minimal influence on the optimal decision even when we consider reduced consequences or lower probability of an attack attempt.
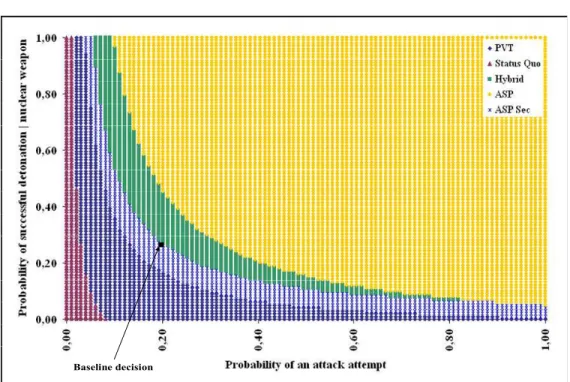
Figure 4: Two-way Sensitivity Analysis for Parameters p and sNW
Baseline decision
The two-way sensitivity plot in Figure 4 analyzes the optimal decision as we perturb p and the probability of successful detonation of a nuclear weapon,
sNW. A non-linear trade-off between alternatives exists as a function of p and sNW.
As the nuclear attack risk increases, the model recommends deployment of ASPs. In fact, when p exceeds 0.05 and sNW is over 0.02, deployment of ASPs is optimal
for most parametric combinations. We also observe that the baseline decision is close to a breakeven point between “ASP Secondary” and “Hybrid” alternatives. Hence, it is sensitive to critical parameter values and falls into three different regions if we perturb p between 0.15 and 0.25. Conversely, significant changes to the baseline values are required to justify exclusive deployment of ASPs rather than the other two hybrid alternatives. Similar conclusions hold in the two-way sensitivity plot between sNW and the probability of a nuclear attack given an
attempt is made (π).
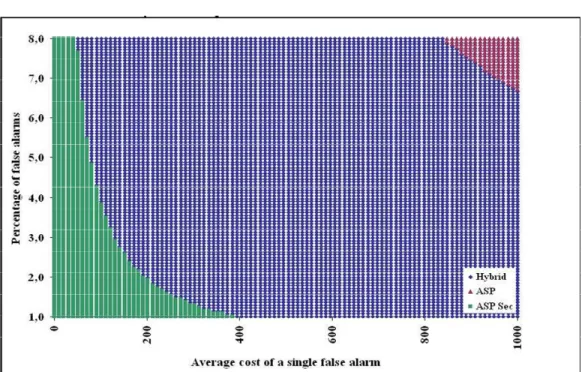
Figure 5: Two-way Sensitivity Analysis for Parameters cf and f
False alarms do not have much influence on EEC. However, since EEC values for the top three alternatives are close in the baseline case, they have some influence on the optimal decision as illustrated in the two-way sensitivity plot (see Figure 5) for the percentage of false alarms (f) and the average cost of a false alarm (cf). This plot reveals that “Deploy ASPs” may be justified for reducing the
cost of false alarms only when the rate exceeds 6.5% and the cost of a single false alarm is over $850. The “Hybrid” alternative is economically sound in most cases due to the reduction in false alarms offered by ASPs used in primary inspections. However, “ASP Secondary” is optimal in the baseline case.
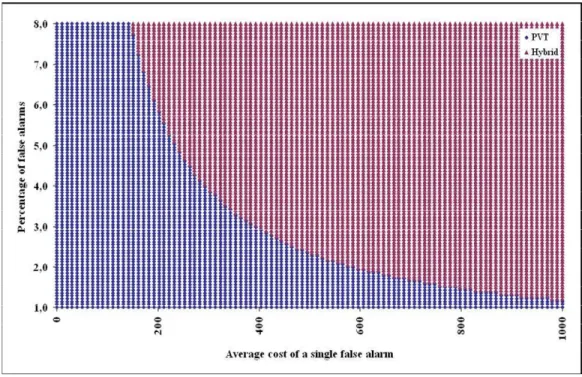
A major criticism by the Government Accountability Office is based on the initial field tests in which ASPs did not perform better than PVTs in detecting nuclear material. In this paper, we assumed that ASP deployment increases the probability of detecting an HEU-based nuclear weapon by around 0.05. Parallel to this, “ASP Secondary”, “Hybrid” and “Deploy ASPs” alternatives were assumed to provide extra deterrence because the probability of interdiction is assumed to be better. Our last analysis is to observe the behavior of the optimal decision if we drop the assumption that ASPs perform slightly better than PVTs in detecting HEU and thus are a higher deterrent to the adversary. We set the base probability of detecting an HEU-based nuclear weapon to 0.30 under “Do nothing”, and to 0.33 under all other alternatives. We keep the deterrence parameter value at 0 for the “Do nothing” alternative, and set a uniform deterrence value of 0.10 for all other alternatives. In this case, the base case optimal decision is “Deploy PVTs”.
Figure 6: Two-way Sensitivity Analysis for Parameters cf and f under the
Equal Detection Probability Scenario
Figure 6 demonstrates that there is a fine trade-off between “Hybrid” and “Deploy PVTs” alternatives when we drop the assumption that ASPs improve the probability of detecting HEU. The “Hybrid” alternative can be preferred under this scenario when the cost of false alarms and the percentage of false alarms are high. For example, if the percentage of false alarms is 3% and the cost of a single
false alarm is twice its baseline value, the “Hybrid” alternative is cost effective. Then, “ASP Secondary” is dominated by “Hybrid” because of the reduced false alarm benefits in primary inspections provided by “Hybrid”.
SECTION IV: CONCLUSIONS
In an effort to reduce the nuclear terrorism risk, the Department of Homeland Security (DHS) has been deploying portal monitors that inspect cargo containers non-intrusively. However, current designs of portal monitors (PVTs) have been criticized for their limited capability in detecting shielded highly enriched uranium (HEU) and for generating high rate of false alarms. In response, DHS is planning to install the next generation portal monitors (ASPs) and improve non-intrusive inspections. In this paper, we developed a decision tree model that evaluates alternative policies on possible replacement of PVTs by ASPs. The base case decision recommends design of an inspection scheme that employs PVTs in primary inspections and ASPs in secondary inspections. The analysis indicates that the decision is quite sensitive to several parameters: The probability of attack, the probability of successful detonation of nuclear weapon, and the probability that a nuclear weapon is used in the attack are the most important parameters. The tornado diagram generated for a wide range of values around base parameters reveals that deterrence parameters, the probability of detecting HEU under various alternatives and the consequences of a nuclear attack are significant.
The cost of the “Deploy ASPs” alternative is considerably higher than that of all other alternatives. Therefore, it is optimal only if there is a high probability of success to terrorists and thus a high benefit of interdiction. “Deploy PVTs” is justified under low risk scenarios and when we drop the assumption that ASPs improve detection capability. The baseline decision is very close to the breakeven point between “ASP Secondary” and “Hybrid” alternatives. Slight changes in the probability of an attack, and the baseline HEU detection probability could cause changes in the baseline optimal decision as well. Furthermore, parameters associated with false alarms are of secondary importance in the baseline case. However, they are critical in determining the optimal deployment strategy under low-probability and low-consequence scenarios, as would be the case if we were primarily concerned with radiological devices instead of nuclear ones. They are also significant if we assume that ASPs do not improve detection of nuclear material. The results indicate in this case that the cost and the rate of false alarms could still justify deployment ASPs along with PVTs.
The model presented in this paper includes 39 parameters. We assign reasonable ranges based on unclassified information and analyze whether replacement of current portal monitors with the new technology is justified. The results indicate that an inspection scheme that employs a hybrid deployment
strategy is reasonable, and exclusive deployment of the new technology requires further proof that they improve the detection capability as well.
References
Abt Associates. 2003. “The Economic Impact of Nuclear Terrorist Attacks on Freight Transport Systems in an Age of Seaport Vulnerability.”
Allison, G. 2004. Nuclear Terrorism. Times Books, New York, NY.
Bakır, N. O. 2008. “A Decision Tree Model for Evaluating Countermeasures to Secure Cargo at United States Southwestern Ports of Entry,” Decision
Analysis, 5(4): 230-248.
Bakshi, N., S. E. Flynn, and N. Gans. 2009. “Estimating the Operational Impact of Container Inspections at International Ports,” Risk Management and
Decision Processes Center Working Paper #2009-05-01.
Bonner, R. C. 2005. Statement of Robert C. Bonner – Hearing before the
permanent Subcommittee on Investigations, Senate Committee on Homeland Security and Governmental Affairs.
Bronskill, J., and S. Bailey. 2007. “Dirty Bomb Would Cause Panic, Cost Billions: Study,” TheStar.com.
Bunn, M., and A. Wier. 2006. “Terrorist Nuclear Weapon Construction: How Difficult?” The Annals of the American Academy of Political and Social
Science, 607(1): 133-149.
Cochran, T. B. 2008. “The Utility of Advanced Spectroscopic Portal Monitors for Interdicting WMD,” Statement of Dr. Thomas B. Cochran before the
Committee on Homeland Security and Governmental Affairs – United States Senate, Washington, D.C.
GAO. 2007a. “Combating Nuclear Smuggling: DHS’s Cost-Benefit Analysis to Support the Purchase of New Radiation Detection Portal Monitors Was Not Based on Available Performance Data and Did Not Fully Evaluate All the Monitors’ Costs and Benefits,” U.S. Government Accountability Office, GAO-07-133R, Washington D.C.
GAO. 2008. “Combating Nuclear Smuggling: DHS’s Program to Procure and Deploy Advanced Radiation Detection Portal Monitors Is Likely to Exceed the Department’s Previous Cost Estimates,” U.S. Government Accountability Office, GAO-08-1108R, Washington D.C.
Garwin, R. L. 2002. “Nuclear and Biological Megaterrorism,” Online at
http://www.fas.org/rlg/020821-terrorism.htm
Gordon, P., J.E. Moore, H. W. Richardson, and Q. Pan. 2005. “The Economic Impact of a Terrorist Attack on the Twin Ports of Los Angeles-Long Beach,” In The Economic Impacts of Terrorist Attacks, edited by H. W. Richardson, P. Gordon and J.E. Moore II. Edward Elgar, Northampton, MA
IAEA (International Atomic Energy Agency). 2006. “Illicit Trafficking and Other Unauthorized Activities Involving Nuclear and Radioactive Materials,” IAEA 2005 Fact Sheet.
Lugar, R.G. 2005. “The Lugar Survey on Proliferation Threats and Responses,” Online at http://lugar.senate.gov/reports/NPSurvey.pdf.
Maerli, B. M., A. Schaper, and F. Barnaby. 2003. “The Characteristics of Nuclear Terrorist Weapons,” American Behavioral Scientist, 46(6): 727-744. Meade, C., and R.C. Molander. 2006. “Considering the Effects of a Catastrophic
Terrorist Attack,” RAND Corporation, Santa Monica, CA.
Medalia, J. 2008. “CRS: Detection of Nuclear Weapons and Materials: Science, Technologies, Observations,” R40154, Washington D.C.
National Research Council (NRC). 2009. “Evaluation Testing, Costs, and Benefits of Advanced Spectroscopic Portals for Screening Cargo at Ports of Entry,” Interim Report (Abbreviated Version).
O’Harrow Jr., R. 2008. “Radiation Monitors to Cost More Than DHS Estimated in ’06,” Washington Post.
Rooney, B. 2005. “Detecting Nuclear Weapons and Radiological Materials: How Effective is Available Technology?” Statement of Ms. Bethann Rooney
before Subcommittee on Prevention of Nuclear and Biological Attacks and Subcommittee on Emergency Preparedness, Science and Technology.
Rosoff, H., and D. von Winterfeldt. 2007. “A Risk and Economic Analysis of Dirty Bomb Attacks on the Ports of Los Angeles and Long Beach,” Risk
Wasem, R. E., J. Lake, L. Seghetti, J. Monke, and S. Vina. 2004. “CRS: Border Security: Inspections Practices, Policies, and Issues,” RL32399, Washington D.C.
Wein, L. W., Y. Liu, Z. Cao, and S. E. Flynn. 2007. “The Optimal Spatiotemporal Deployment of Radiation Portal Monitors Can Improve Nuclear Detection at Overseas Ports,” Science and Global Security, 15(3): 211-233.