Selecting the Most Suitable Index for the Istanbul Securities Exchanse
A Thesis
Submitted to the Department of Management and the Graduate School of Business Administration
of Bilkent University
in Partial Fulfillment of the Requirements for the Degree of
Master of Business Administration
by
ALPER KöSTEM
i c e 1 t i I'/ t s. t 1 l'ı£· ’v· e r· e a d t h i s t hi e e i s a n d i Vı m v o yj i n i o n i t i. £·. i u ] ] y a ci e q ua t e 1 rı s c o p e a. n d in quality, as a t hı e s 1 s t d r t hı e degıee of hlaster of Business Adm i n i s t ra t i on .
E)r . h’.uışat AydoŞan
M
i V
/
-I cer-1 i f V' t hı a t I h a. e ı· e a d t hı i s thesis 1 n d i n m y ü p i r· i cj n i t. T u M ad E· '·:] u a t e in s e o pe a n d i rı q u a 1 i t y , a s
degi'ee of Master of Business Administration.
Dr. Ümit Et o\
certify that i have read this thesis and i
fully adequate in scope ¿ind in quality, as
degree q·' Mast ex· or Business Adm i n i s t rat i on .
a tries IS for tfit
- ‘H ITi o ].:· i ri i r.i n it i. s
a T e s j s tor t P: e
L! I . o 1M’la ri t. a p o c i u
AV'prt-^'sd try institute of Management
D : . S Ü t; i d e;/ T' o g a r\
\ f z u
ABSTRACT
S & İ B c t i r t ^ the^ rruDS t £^WLta.öl B ir>.dex
/ o r t he> 1 s t aribxj I S e -c '</r ?! t i e.s Exc
ALPER KöSTEM M BA i -n Fins n c e
Supervisor ; Pi of. Kür şat Aydoğar, September 1990, 125 pages
This study examines the security market indicators in the ioreigri stock exchanges and in the Istanbul Teour i 1 i es H X c nan ge ( 1 E-‘E ) and prcposes an index the
Ü ]■'e j o T 11)e ). £ E , T ti e o l.s e r·va t r o n o f I ^ !··! e V.' 1 S E. I T: Ö e x s o u e d t h a t i. Y> e y b o t hi Y: 3 \
reflecting tiie return of an average investor. The Old i££ indsx ; e'pr fj s 0r'l t s t he results of a no s V: ill i nve s t men t s t: r c< 1. e gy , a t-,d
ma/y bfr tl-Mr o a t :· u i r a c: 1 e
C' 1 d 1 S E Î n d e >: a :·; d t h e
i mp o r T.arrt p·· I c o i e r»i s i n
e K c. w 1£E 1n 6 e X shows the char1 g0 İT) the totSi r:,ayk' e t. V a I \.ie o f iC 1£E c o n· P aniss. Howe v’0 'j f i n ^ cf.i1V^ \ J -/ u : Ö. J··LM g L J}e J e L wi i n c 1 ii
e Î:■ a g e i n V a s t. c r· c o T r· e c t i y , the amount of p u b !i c 1y C' V· n 0 d s t. c.< c; i-; s uare 1 mpor T. a ivr. rience, rne weignting scrieme ox rne proposed ividex
is designed to serve for that purpose. To detect the ur.d e s 3 .v a o 1 e eiTect of using closing prices in the index, the intraday bc’his'r i oor ci thie market is analyzed. The results indicaie t ne
rieed for using weighted ever&ge prices. Calculating the proposed index through the use of the weighted average prices seems to solve the problems associated with the Old and the Islew ISE Index.
K e y w o r d s ; I s t a n b u l S e c u r i t i e s E x c h a n g e , D o w - J o n e s , p r i c e - w e i g h t e d ,
Va 1u e - we i g h t e d , c r o s s - c o r r e 1 a t i o n c o e f f i c i e n t , c l o s i n g ]m· i c e s ,
DZET
İstanbul Menkul Kıym e t l e r Eorsası için
en uygun olan endeksin seçimi
ALPER KÖSTEM MBA
Danışman : Doç. Dr. Kur şat Aydogan
Eylül 1990, 125 sayfa
Bu çalışmada, dış ü l k e l e r i n menkul kıymetler borsalarında kullanılan endek.sler incelenmiş ve İstanbul Menkul Kıymetler Borsası için en uygun olabilecek bir endeks önerilmiştir. Esl:i ve Yeni 1MKB Endeksleri incelenmiş ve bunların averaj yatırımcının getirisini yansıt m a k t a n uzak oldukları gözlemlenmiştir. Eski )MKB Endeksi aslında "rastgele y a t ı r ı m s t r a t e j i s i n i n ” sonuçlarını göstermektedir. Yeni 1 MKB Endeksi ise, İMKB ’deki şirketlerin pazar değerlerindeki değişikl i k l e r i göstermektedir. Halbuki, averaj y a tırımcının getirisini doğru olarak hesaplayabilmek için dikkate alınması gereken en önemli nokta, halkın elindeki hisselerin pazar değeridir. Ö n e r i l e n endeks bu nokta dikkate alınarak tasarlanmıştır. Bir başka nokta ise, bundan önceki İMKB endekslerinde kapanış f i y a t l a r ı n ı n kullanılmasıdır. Kapanış
iiyatlarırun endeksin am&.cı üzerindeki olumsuz etkisi. pazarın
gün içindeki hareketleri incelenerek saptanmış ve endeks
tıesap 1 anı rken ağırlıklı ortalama fiyatların kullanılmasının
gerekliliği ortaya çıkarılmıştır. Önerilen endeksde ağırlıklı
ortalama fiyatları kullanılmasıyla, Eski ve Yeni 1HKB
Endekslerinin getirdiği tüm problemler çözülebilecektir.
Anahtar sözcükler : İstanbul Menkul Kıymetler Eorsası, Dov·.'-J o n e s , f i yat-a g1 r 11k 11, değer ağırlıklı, k r o s - koro 1 asyon katsayısı, kapanış fiyatları, ağırlıklı ortalama fiyatlar.
ACKNOWLEDGEMENTS
1 would like to express my gratitute to Dr. Kürşat Aydoğan for his invaluable supervision during the development of this
thesis. 1 also would like to express my thanks to Dr. Gökhan Çapoglu and Dr. Ümit Erol for their helpful 1 comments on the
1 hi e s i s , Sp-ecial thianks go to Mrs. özden A t a f o I' he r i n v a 1u a h 1e
hi tip i ri printing the thesis d o c u m e n t s . I also W Cl u 1 cl like to 0 X pr ess my gratitute to Mr. Osman Mayate p e k for the f inanej a 1
s u yj }D o r t he has provided and to Ambassador Osman 0 1 cay for hi i s
TABLE OF CONTENTS Abstract A k' S t r B. C t i I'l T U r i" i S h A c I' n o w 1 e d g e m e n t £ T a b l e oi C o n t e n t s L i s t of T a b l e s L i s t of ■ F i gur*e£ 3 1 1 V 1 X 1 1 I. Intr o d u c t i o n
II. The Use of Indexes S c Market I n d icators in the Foreign Stock Exchanges
A. Why Do We Need Indexes?
B. Different Averages t: Irjdices
1. E^ow-Jones Averages 2. Aggregate Indexes
i . S t a n d a r d P o o r ’ s S t o c k I n d e x e s
i i . In!e w Y o r· V: Stock E x c hi a n g e Index i i i . AMEX Index
i V . Value Line C o m }:>o s i t e Index 3. Utk)er U.S. Stock Indexes
i. Financial Times Index
ii. I'Jew York Times Industrial Aver-age iii. NASDAQ Comp o s i t e Index
III. Is;tanbui Securities Exchange Indexes A . The Old 1£E 1ndex
B. The New 1£E Index
C. Rapidly Changing Features of the ISE D. E)esired Properties of Market Indices
1 . £ a m 1 e Size
2 . R e p r- e s e ri t a t i V e n e E s 3 . W e i g t i ri g
4. Convenient Units
E . £: o m e Critiques for* the ISE Indexes 1. The Old ISE index
2. The New ISE Index
20 20 26 29 32 36
IV. An Index Proposal for the ISE CBurç Index) A. Construction of the index
1. Elimination Process 2. Sorting Process 3. Classification
4. Selection of Sanjple
5. Weighting Scheme and the Formula of the Index B. The Comfort of Maintenance with the Burç Index C. The Strategy that Should Be Followed in [-'eciding
the Substitutions in the Burç Index
D. An Advanced Weigfiting Schjeme for the Bur-ç Index
-51 41
49
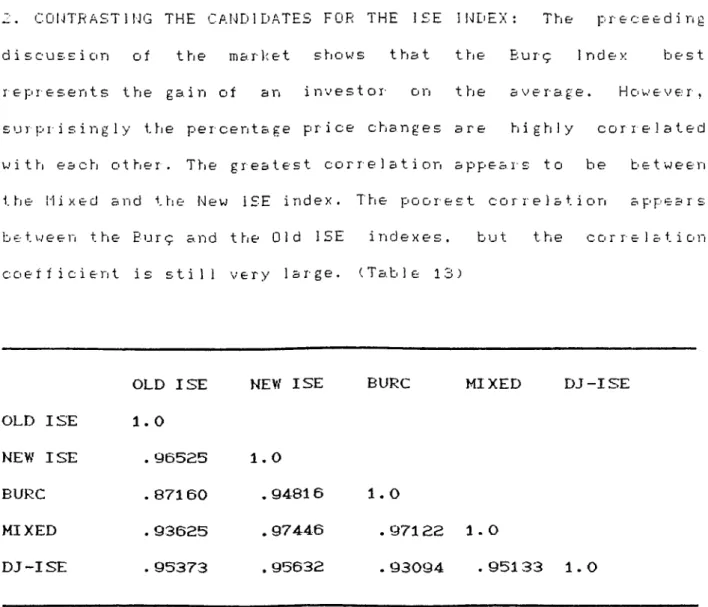
E . C o iTi1 j a. r- i £ o n s a rj d C o rı t r· a s t s ot D i f f e r· e n t İSE Indexes 1. Comparisons of the Candidates for the 1SE Index 2. Contrast 17'ig the Candidates for the I SE Index
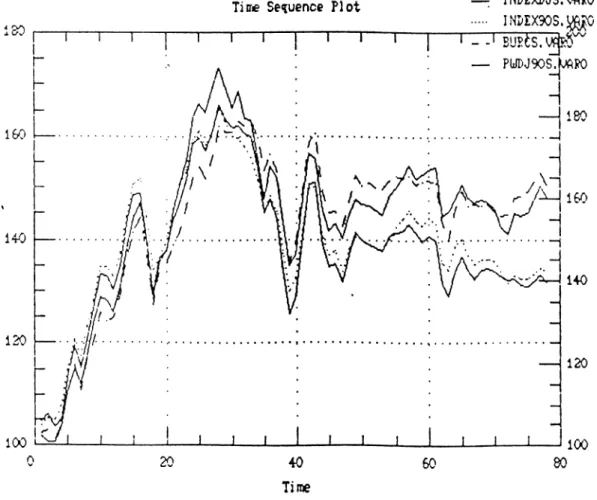
i. C r o s s -c o r r e 1 ations between different indexes i i . ar· i ab i I i ty of t e indexes
5A
V. The U n desirable Effect of Using Closing Prices in the 61 Indexes
VI. Results Sc Conclusions 68
List of References 72
Appendices 73
A. Estimated Cross Correlation Coefiicients 'Between A1-A12 Rate of Changes in Selected 12 Stocks and Index
B. Regression Analysis of the Returns of Index and B1-B6 Selected 12 Stocks
C. DJ-ISE Index C1-C2
D. MIXED Index D1-D2
E. Estimated Cross Correlation Coefficients Between E1~E9 Rate of Changes in 5 Selected Indexes
F. Estimated Cross Correlation Coefficients Between F1-F2 Rate of Cfianges in Selected 2 Stocks and Index
(Weigfited Average Prices are Used Instead of Closing Prices for tfie Stocks)
Regress! o ri A n s. 1 y s i s of t hj e R e t u r n s of 1 n d e x e. n d t rı e G 1 Selected 2 Stocks ( U e i g ti t e d Average Prices are Used
Instead of Closing Prices for· the Stocks)
Estimated Cross Correlation Coeffi c i e n t s Between the H1-H2 Returns and Levels of Current ISE Index and an ISE
Index Calculated by Using the Weighted Average Prices of the Stocl:s.
Table 5. T a. b 1 0 £' *
Table i. A Classification of the Market Indices G
Table 2 Hypothetical Market Value Data 7
T a Li 1 e 3 . Effects of Hi g Li - P r· iced a n d L o w P i· i c e d £< t o r- k £ £; i n DJ 1 A
Table 4, The Effect of a Stock Split to the Relative 10 Weight of a Stock in Ebl 1 A .
An Example for Calculating the VLCl Index 17
An Example lor Showing the Inefficiency of the 25 Weighting Scheme Used in the QLd ISE Index
Table 7. Frequency of Trading for First Market stocks of 29 ISE on January 1966.
Table 8 . Frequency of Trading for First Market stocks of 30 ISE for the Period May 7, June 8 1990.
Table 9 . TY\e Retur·n of ISE Index in thie First 4 MontLis 3 S of 1990
Table 10. Calculation of the Weights of Köytaş and 3 9 Koç Holding Stocks in the Current ISE Index
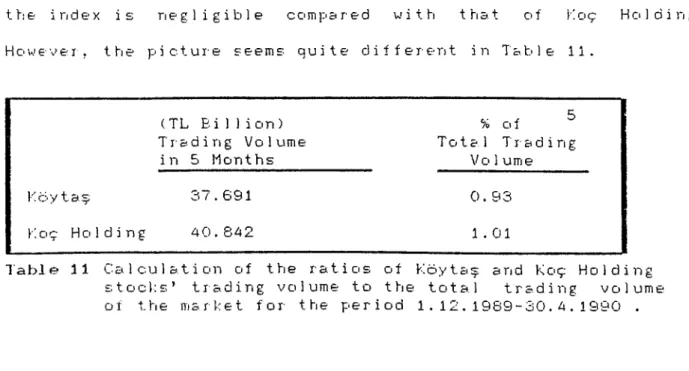
Table 11. Calculation of the Ratios of Köytaş and Koç 4 0 H o 1 d i ri g S t o c k s ’ Tr a.d i ri g Volume to t Lie Total
Trading Volume of the Market for the Period 1,12,1989 - 30,4,1990.
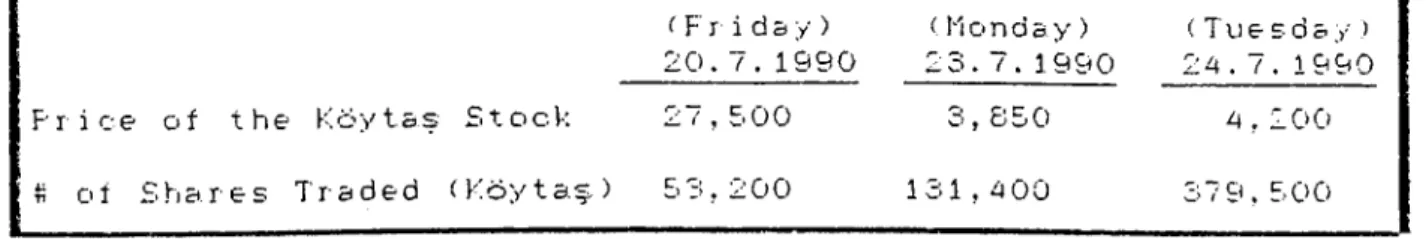
Table 12. The Price and Number of Shares Traded of Köytaş 50 Stock Before and After the Change in F i r m ’s
Capi t a 1i za t i on LIST OF TABLES
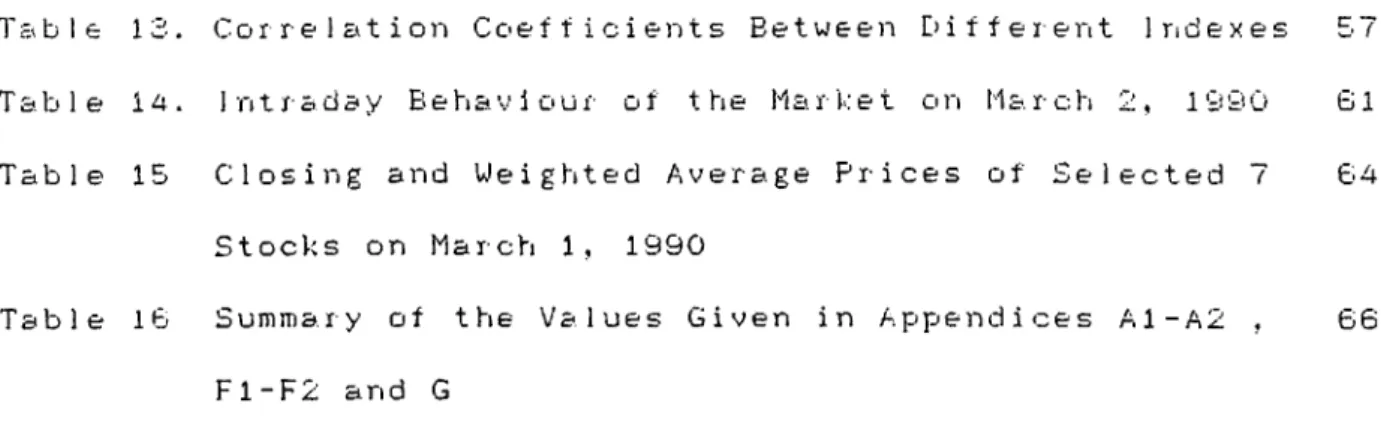
ble 13. Cor re 1 £<t i on C o e f f i c i e n t s B e t w e e n E)iffeient Iridexes 5(
T 3.]j 1 e 14. I n 1X’3 ci3 y Beti3 v i oux- of the M 3.x·ke t o ri li3. r·cI’l 3 , 1 y 3^
Table 15 Closing and Ueigfited Average Prices of Selected Stocks on March 1, 1990
T a b l e IG S u m m a r y of the Values Given in A p p e n d i c e s A 1 - A 2 F 1 - F 2 and G
u bl
7 G4
Figure 1. Standardized Index Values
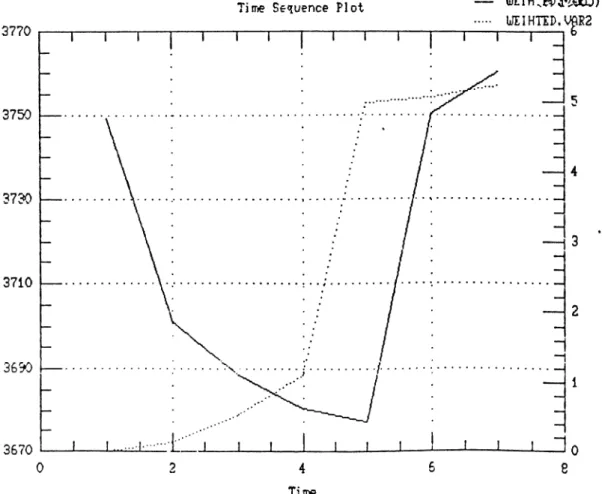
Figure 2. Summary Statistics tor the Levels ot Indexes F i g u r- e 3. S u m Hia r- y Statistics tor t i'l e Returns of Indexes Figure 4. 1. The Price and the Volume levels ot the Marl:et
T r- o u g t ti e T i' a d i n g S e s s i o n
Figure 4. 2. The Price Level and the Rate of Change of the Volume through t fi e Trading S e s s i o n
LIST OF FIGURES
B9 60 62
I. I N TRODUCTION
It is imports.nt for an investor with a portfolio common s t.oci··:s t r-aded i ti an e >; ctia.rige to be able to assess its performance. It is essential therefore that there should be a Yc-rdstick which can be used and this is nothing but a market
index.
The purpose of this study is to specify and propose solutions that can be met in the computation of a share price index for the Istanbul Securities Exchange (ISE) , and finally to select tfie most suitable index for the ISE.
The construction of an index is faced with the problem of choosing a formula . The Board of Directors of ISE decided to use two k.inds of indexes till now. The first index was valid between 1.1.86 - 29.12.69 , the second one has been valid since 2.1.1990.
In the second half of the 1989 , when ISE began to grow both in the trading volume and the prices , ISE index took a lot of criticism from the financial analysts and researchers . They claimed that the ISE Index was failing to show the return of an average investor. As a result of these critiques, a new index was cons11'ucted and replaced with ttie old one. It was valid as of 2.1.1990. However, the New ISE Index c o u l d n ’t find a solution to all of the problems stated for the Old ISE Index. The Chairman
of t h e Capital Marl'et Board, Mehmet Şükrü Tekbaş went on Tecord in critisizing the current ISE Index^.He acknowledges the inefficiencies related to the current ISE Index and emphasizes the need for change in the index. Hence, this study may be used as a guideline to those people who are interested in the quest for· a better· index.
In part II of this study, the use of indexes and the foreign stock market indexes are discussed. In part 111, the Old and the Mew 1£E Index is analyzed in detail and the desired properties of a market index are given. In part IV, an index is constructed to solve the problems of tt \e curr-ent ISE Index. The proposed index is calculated by using the market value of publicly owned stocks of a company rather than the total market value of it. Hence it brings a solution to the biggest problem of the current ISE
Index.
Part V, puts another problem of the ISE Indexes into the picture. Both the New and the Old ISE Indexes are calculated by using closing prices of the companies. However, the usage of closing prices misleads us in calculating the return of an average investor. Intraday behaviour of the mark e t is analyzed to sfiow the undesirable effect of using closing prices. Results and conclusions ar·e presented in Par·t VI.
1
II. THE USE OF I N D E X E S & MARKET I N D I C A T O R S IN THE FOREIGN ST<X:K E X C H A N G E S
A. WHY DO UE WEED INDEXES?
” How ’s the market today ? ’’ " What ’s the index today ? ’’ These are probably ttie most frequently asked questions by customers to their brokers. But why ? Why should people be so concerned about moves in aggregate security prices ? One reason , of course . is that aggregate market moves have a major im.pact on the returns of individual stocks . Although the realized return on an individual security can be caused by a large number of factors, a significant portion of such events affects the prices of all securities . In the Capital Asset Pricing Mode 1 (CAPKi) , a s e c u r i t y ’s sensitivity to such events is captured by its market Beta . The relationship between expected return and u n a voidable risk, and the valuation of securities that follows, is the essence of the CAPM. This model was developed by Sharpe and LiTitner in lQ60s, and it has had important implications ever since. Perhaps the most important challenge to the CAPti is the A r bitrage Pricing Theory (APT). Originally developed by Step h e n A. Ross , this theory is based on the idea that in competitive financial markets , arbitrage will assure that riskless assets provide the same expected return . Rather than the single factor
'sbeta; generating the CAPM, multiple factors are in4-'olved i in the a r t) i 1 1· a g e p· r i c i n g m o d e l ’s return generating pj г о c e s s . ^ E; и t regardless of the model used to depict security p<rice behavior ior the stocks quoted in New York Stock Exchange (NYSE) it is known that on the order of 30 % to 50 % of the return v a r i a b i l i t y on common stocks is due to aggregate market effects . To make the same analysis for the stocks listed in Istanbul S e c u r i t i e s E X c fi a n g e ( 1 S E .) , firstly 12 s t о cT: s h a e been selected . This selection is made by examining the c r o s s -с о r r e 1 ations b e t w e e n the return of each stock and the return of tfie index . Tfie results are given through Appendix Al and A12. Running a r e g r e s s i o n for each stock it is found that on the order of 4 % to 69 % of the
return variability on common stocks is due to m a rket index variab i l i t y . The results of the regression analysis are given through Appendix B1 and B6.
As a second reason, many people believe that the size and direction of current moves can be related to historical movemients and used to determine whether today is a good time to buy or sell. Although statistical data refute the notion that puices move in identifiable patterns the belief remains widely accepted.
A third reason for knowing past levels of a g g r e g a t e se c u r i t y prices is a performance criterion. The a d v antages of using a g g regate market index to measure performance are twofold. First,
required to identify end t x· e c l·. baseline i r» v e s t m e ii t ]:·o i· t f o 1 i o s . Instead, a. published index which is reasonably close in coniposition to that of the baseline portfolio can be used. For e X a nj }:· 1 e ; if o n e ’s baseline jjo r· t f o 1 i o c o n s i s t s m a i n 1 y of s t o c k s
in the oldest and largest U.S. corporations, the Dow
Jones Industrial Average (DJIAJ might be used to evaluate performance. Second, a properly constructed market index can indicate how the ’’a v e r a g e ” investor and speculator did during ,say, the last year. If the returns on such an index are 1 C) 0 % d u r i i‘i g a given year·, t fi e n we could t i n k in ter- m s. o f one-half of all investors and speculators earning 100 % or more and one-half 100 % or less. To do this ,however,we must have a we 1 1-constructed index which covers a large number of stocks.
B. DIFFERENT AVERAGES INDICES
Many different averages and indices exist and are published, Some of them are listed below.
1. Dow-Jones Averages
2. Standard P o o r ’s Stock Indexes 3. New York Stock Exchange Index 4. American Stock Exchange Index 5. Value Line Composite Index 6. Financial Times Index
These over&ges srid indices ere constructed in different ways end useful for different purposes. Each of them will be exemined seperately in the following pages.
It is possible to classify the market indices discussed so far with respect to their w e ighting schemes and the av e r a g i n g irethods they are using in their formulas. Table 1 i s giving a c 1 assifi c a t o n of some market indices for this purpose.
Weighting Scheme
PRICE VALUE U N W E 1GHTED
A V e r a g i n g M e t hi o d
Geometric DJIA, NYTIA AMEX,NASDAQ,SP,NYSE CRSP
Ar i t hmet i c VLCl, FT I —
—
T a ble 1 A C l a s s i f i c a t i o n of the Market Indices
1. DOW- J O N E S AVERAGES
The DJIA is the oldest and the most widely quoted market index of the American stocks. Its origin dates back to 1864 when it was first published by Charles Dow in an attempt to gauge movements in aggregate stock, prices. It was based on tfie prices of only 11 stocks. Over the time additional stocks were added
untill there were 30 by 1928. Over time, a particular
stock may be considered unrepresentative of its industrial sector and substitutions are made.
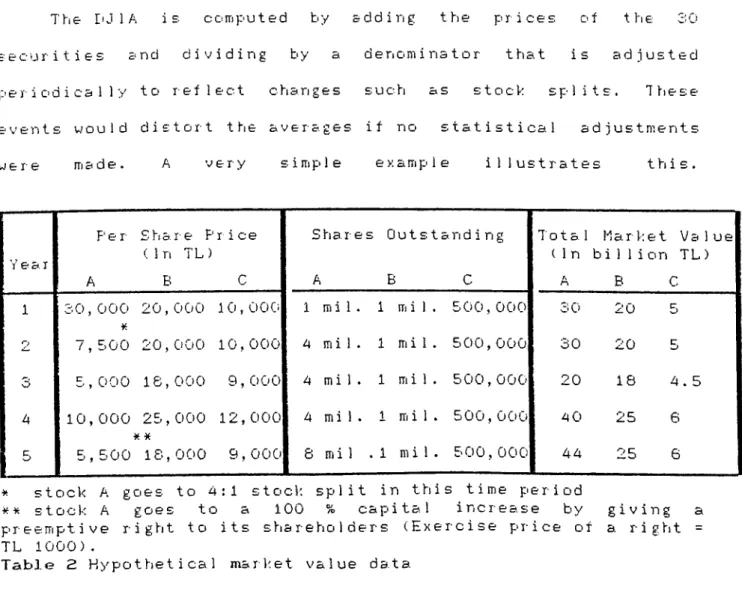
TY\e DJIA is computed by eddirig the prices of ttie 30 securities end dividing by a denominator that is adjusted p e r i o d i c a l l y to reflect changes such as stock splits. These events would distort the averages if no statistical adjustments
were made. A very simple example illustrates this.
Y e a. r F'e r A £ hi a. r- e Price (1n T L ) B C Shares A OutS tc B ending C Total ( I n A Ha. r Let billion B Value TL) C 1 3 0 ,000 ¥. 7,500 20,000 1 0, 0 0 0 1 mil. 1 mil. 500,000 3 0 20 5 9 20,000 10,000 4 mil. 1 mil. 500,000 30 20 5 3 5,000 18,000 9,000 4 mil. 1 mil. 500,000 20 18 4.5 4 10,000 25,000 ¥ ¥ 12,000 4 mi 1 . 1 mil. 500,000 40 25 6 5 5,500 IS,000 9,000 S m i 1 .1 mil. 500,000 44 25 6
* stock A goes to 4:1 stock split in this time period
stoci< A goes to a 100 % capital increase by giving a pre e m p t i v e right to its shareholders (Exercise price of a right = TL 1000).
Table 2 Hypothetical mark.et value data
For example, assume that we wish to create a hypotethical DJIA for stocks A, B and C in Table 2 as of the first period. Bumming the prices and dividing by three the index value would be TL 20,000.
makes it a pr i ce-we i g h t ed 3,vera.ge. That is a high priced stoc)< carries more weight in the average than a low-priced stock.
Subsequent value a s s u iTj i I'l g 10 % decrease
Initial In stock In stock In stock
value A B c £ t Cl c k A Stock B Stock. C Sum Average TL 30,000 20,000 10,000 TL 60,000 20,000 Per c e n t a g e chi a ri g e TL 27,000 TL 30,000 TL 30,000 20,000 18,000 20,000 10,000 10,000 9,000 TL 87,000 TL 58,000 TL 59,000 19,000 19,333.3 19,666.7 -5.00 -3.33 -1.67
T a b l e 3 Effects of high-priced S< low-priced stocks in DJIA
A given % 10 decrease in the high-priced stock A results in a 5 % decrease in the average versus only 3.33 % s,nd 1.67 % decrease in the average assuming a 10 % decrease in the
low-p'riced stoclrs B and C (Table 3).
However, an adjustment to this procedure has to be made whenever a firm splits its shares. For example in year 2 of Table 2, stock A has a 4;1 stock split, and its market price per share drops to TL 7,500. It would be silly to simply sum year 2 prices and divide by 3 , the index value would exhibit an artificial decline caused by the split. There are two ways in wfiich one could account for such splits. One way is to explicitly
adjust the numerator by multiplying stocl< A ’s price by a
a d j ' u s i n L & r t t f a . c t o r ' \ For our case, this factor would be 4 and the new index would be CEilculated as follows:
(TL 7,500 * 4) + TL 20,000 + TL 10,000 TL 20,000 =
The second way is to adjust the denominator so that when " B-Y) adjusted divisor’^ is divided into post-split sum of stock ]jrices, the index d o e s n ’t cfiange. Following stock A ’s 4 for 1 split, this new divisor would be 1*675.
Index value prior to split =
Sum of prices after the split
U e w E) i s o r
Jew divisor' =
Sum of prices after the split Index value p>r i or to s 1 i t
inJe w divisor· =
TL 7,500 + TL 20,000 + TL 10,000 TL 20,000
= 1.87E
The DJIA is calculated using the adjusted divisor approach. Hence any time a stock splits, its relative importance in the
index decreases. It is also valid for our case. After the split a given percentage change in the price of stock A has a smaller
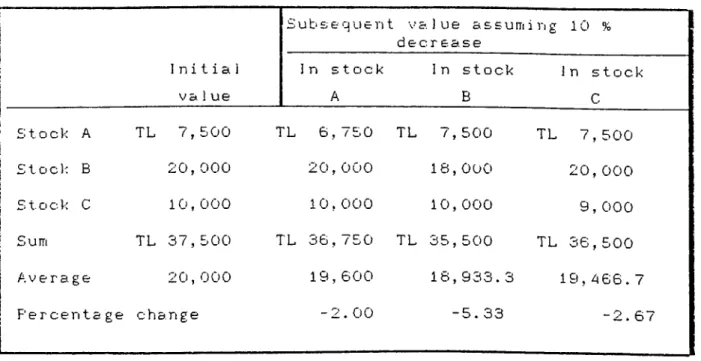
i 1 1 u £; t r·a. 1 ed as f o I 1 o s :
£ u hi s e q u e n t a 1 u e a s s u m i V) g 10 %
In stock 1 n stock In stock
A B C Initial \/ a 1 u e Stock A TL 7,500 TL 6,750 TL 7, 500 TL 7,500 Stools B 20,000 20,000 16,000 20,000 S t. o c \< C 10,000 10,000 10,000 9,000 Sum TL 37,500 TL 36,750 TL 35,500 TL 36,500 Average 20,000 19,600 18,933.3 19,466.7 F’ercentage change -2.00 -5.33 -2. 67
Table 4 The effect of a stock split to the relative weight of a stock in DJIA.
To interpret the results, one can assume that the new shares obtained in a split were sold and the proceeds used to buy additional shares of the non- s p l i t stocks. If shares which undergo splits are those whose prices increase the most over time, this would result in a policy of continually selling the shares of high-price growth stocks and buying the shares of low-price growth stocks. The DJIA would be biased downward from the value which would have been obtained if the numerator adjustment approach had been used instead.
Another criticism of DJIA is its representativeness. Critics argue that the sample of 30 large, mature stocks can not reasonably measure market value changes of the typical stock.
Studies of past price movements show that DJIA has not been as variable as other price indexes nor has it showm as a high giov/th rate.
2. AGGREGATE INDEXES
Aggregate indexes include not only the price of the stock but also the number of shares outstanding. The term aggregate is applied because the indexes are based on the aggregate market values of the issues included in the index. There are two well-known aggregate indexes. These^re the Standard and P o o r ’s indexes and the New York Stock Exchange indexes,
i ; Standard P o o r ’s Stock Indexes
Standard ii P o o r ’s Corp. publishes a variety of indexes which largely overcome the problems inherent in the Dow averages by including a larger and more representative number of stocks as well as by concentrating upon changes in a f i r m ’s total market value instead of per share values. T h e r e ’re five Stand a r d and P o o r ’s index series. These are the industrial, the utility, the transportation, the financial and the composite. The industrial is made up of 400 industrial stocks, the utility index is made up of 40 utilities stocks, t r a n s p ortation index is made up of 20 stocks and the financial index is made up of 40 financial institution stocks. These 500 stocks then compose S t andard and P o o r ’s Composite Index.
p e r i o d aggregate a 1 u e is the a v e r a g e aggregate value for- t ti e period 1941-A3. The total market value of all firms is calculated at a future date and divided by this base period value. I'lotat i ona 1 1 y, this can be represer.ted as follows:
S it P C o ni p . 1 n d e X r>oo E P. , * Q. ,b t b t i. = 1 5 0 0
E
bO bO b = 1 X 10 bO i O bt btm&.rket price per share in base period
number of shares outstanding in base period current market price per share for ith stock number of shares currently outstanding
To illustrate the mechanics of the S ^ P^s indexes, we may use the data of Table 2* Assuming year 1 as the base period, the base period aggregate value comes out to be :
1=1
^ “ 30,000^1 mil,+ 20,000^1 mil,+ 10,000^500,000
= TL 55 billion
As of period 2, the market capitalization of the stocks remain unchanged at TL 55 billion.
3
E
b = l p ★ Q b2 b2 7,500*4 mil,+ 20,000*1 mil.+ 10,000*500,000 TL 55 bill ionH e n c e : thie y e a r 2 i n d e x v a l u e w o u l d be
( TL 55 bill ion)
10 = --- * 10 ( T L 55 billion)
Therefore· it is clear that a major advantage of this type of index is t fi a. t it automatically adjusts for s t o c ic s ]:* 1 i t s as total market values are used. Although stock A had a : 1 split and its price fell by 75 % , as the number of shares outstanding became 4 million (1 million in year 1) there was no change in the stool·:’s total market value and no change in the S p index.
Using the same app*roach in recession period, the index value was c a 1c u 1 ated to b e : ^ P E P. * 0 . V 3 -L 3 V = 1 E P.„ Q. . >-0 1.0 v = 1 10 TL 20 bil + TL 18 bil. + TL 4.5 b i 1 TL 55 bil. « 10 7.727 In e x pansion period : S & P
E
P.
«
Q.
V4 V = 1E
P.
*
0
* 10TL AO bil + TL 25 bil. + TL 6 bil. TL 55 bil.
10 = 12.909
However, the S P ’s indexes do require an adjustment whenever a. firm issues additional stock or when a firm is rejz^laced in aii iiidex . Xhis s d 3 ustnient jjrocess rray be represented as foilows :
M.
EP,^ = BP^ . (Equation 1)
where BP,, is the new base period aggregate market value, M is the
N A
current aggregate market value after the change in the f i r m ’s capi ta 1 i r.at i on and lig is the aggregate market value before the change in capitalization.
This can be illustrated by using period 5 of Table 2. Company A issued new stock worth TL 4 billion interms of its par value. The old base period aggregate value was TL 55 billion (period 1), and the current aggregate market value before the issuance of the new common stock was TL 71 b i llion (period 4). Substituting into equat i o n 1. :
B = TL 55 bil. = TL 56.098 billion
TL 71 b i 1.
Thus the new base period aggregate value becomes TL 58.098 b i I’i'i o n .
The Standard i/. P o o r ’s indexes have several advantages over other indexes. First, they are broad covering a large number oi
prominent stocks and provide detailed data on specific
industries. Second, because each s t o c k ’s price is multiplied by number of shares outstanding, all stock splits are automatically accounted for in the numerator of the va 1 ue-we i ghted £ p index and they are not subject to splitting bias of the Dow-Jones indexes. Third, the use of the value weights has intuitive appeal because a value-weighted index is more likely to track actual cfianges in the aggregate market value of common stocks than a p r i c e -weighted or equa 1 1y-weighted index.
i i ,Mew York Stock Exchange (NYSE) Index
In 1966 the I'Jew York Stock Exchange began publishing its own market index. The method of calculating this index parallels that of the S £< P indexes. It differs from the S P index in two respects, however. First, the MYSE Composite Index is made up of all stocks listed on the Exchange whereas S & P index includes only the largest NYSE firms plus a few OTC firms. In this manner, the sampling problem is avoided. Second, the NYSE has a base
index value of 50 as of December 31, 1965. In addition to the Composite Index of all NYSE stocks, various subindexes are also available. There is an industrial index, a tran s p o r t a t i o n index, a utility index, and a financial index. N o t a t i o n a l l y NYSE
Composite Index may be represented as follows :
. 2 P,,
-NYSE Comp. Index = — —
---t n ^ 50
E
vO^
Q.^
vOL= 1
v;here the terms a.re as previously defined,
i i i . AMEX Index
In late 1973, the American Stock Ex c h a n g e instituted a market value index similar to that oi the NYSE and Standard ^ Poor. This index was an arithmetic index that added and subtracted the average change in price of all stocks listed on t^Je AMEX. The only apparent difference from the InIYSE and S p index is that its base period is referenced in terms of 100 instead of 50 as in NYSE Composite and 10 as in S P Composite, iv. Value Line Composite Index (VLCl)
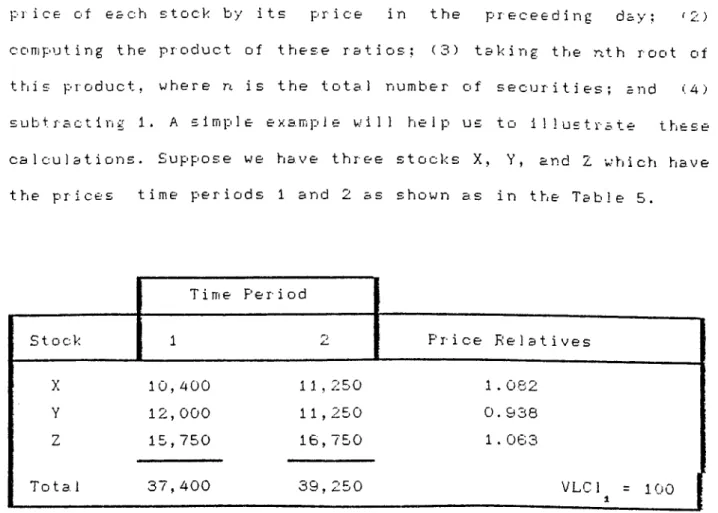
The VLCI is the most broadly based of the major security indexes. It is composed of ap p r o x i m a t e l y 1700 stocks, comprising all of the stocks on NYSE, and a. portion of the AMEX, OTC and a few Canadian securities. Together, this index covers 96 % of the total dollar trading volume in American equity markets. Unlike the other indexes, the Value Line indexes are based upon geometric means of relative price movements. A geometric average of stock price changes is calculated by (1) dividing the closing
rice o f SB c hi stock by its p* r- i c e in t hi e p r e c e e d i n g da y ; f 2.)
coniputing the product of these ratios; (3) taking the n.th root of thiis product, where n is the total number of securities; and (4) s u b t r a G t i n g 1 . A £ i m pi 1 e ex a m \j i e will hi e 1 p us to illy s t r· ate t hi e s e calculations. Suppose we have three stocks X, Y, and 2 which have the prices time periods 1 and 2 as shown as in the Table 5.
Time F‘e r· i 0d
stock 1 2 Price Relatives
X 1 0,400 11,250 1.062
Y 12,000 11,250 0.938
Z 15,750 16,750 1.063
Total 37,400 39,250 VLCl^ = 100 j
Table 5 An example for calculating the VLCI Index
Multiplying the three price relatives and taking the 3 r d root
results in a geometric average relative equal 1.0255.
Geometric Price Relative = y i. oe 2 * o . pa e ^ 1. o<53 = 1.0255
Value Line Index. - (Geometric Average) * VLI Price Relative
Recall that , the method of calculating the DJIA results in its being a price-weighted average and the method of calculating the Standard b Poor's indexes results in value-weighted indexes. However, the use of a g e ometric average in calculating the VLCl results in each stock's being given approximately equal weight in the index and also results in a potential downward bias for the index overtime. If the index was p r i c e -w e i g h t e d , then the average return would be A . 946 % c a l culated as the ratio of the sum of the prices in the tw'o periods minus 1: (39,250/37,400)-! = 0.04946. Thus, for our examp'le, price weighting gives greater weight to
the high-priced .stock and results in a. higher return than does the geometric average.
3. OTHER U.S STOCK INDEXES
i. F i n a . n c i a . 1 T i m & s 1 n d s - x : Its base period is 1.7.1935. Iridex value is calculated by using g eometric average technique.
ii. Neu> Y o r k T i m e ' S I n d u s t r i a l A v e r a . ^ e : It is calculated similar to the E)J IA but uses the split adjustment factor in the f o r m u l a ’s numerator and basedd on 25 stocks.
iii. N A S D A Q C o m p o s i t e I n d e x . : In 1971 the National Association of
Security Dealers began using its Automated Quotation Sy s t e m to determine various market value indexes on OTC stocks. This index covers more than 3,000 OTC stocks representing industrials, utilities, transportation, insurance, banks, and other financial
companies. It is computed in a fashion similar to the S
NYSE indexes, using February 1971, as the base period \,'ith a base value of 100.
c £< P a d
ISTANBUL SECURITIES EXCHANGE CISE) INDEXES A. OLD ISE INDEX
1 the beginning of 1966, the Istanbul Securities Exchange began publishing its own market index as soon as ttie trading activity got started in t ti e m a r· 1< e t . 1 t was valid till the e Ti d of 19c;9. The index is constructed to be equally weighted. All oi the stocks assigned to the first market by the Board of Directors of trie ISE are included in the index. It is computed by taking the ar i t I'lTiet i ca 1 average of the index values of each stock that is i ri c 1 u ci e d in the ISE 1 r. d e x . T ti e i ri d e x value of a. c c· m a n y i s c a ! c Ü I a t e d by d i i d i n g t ti e current mi a r 1·:e t value w i t ti the t* a s e period mar·ket v'a 1 ue arid multiplying the r·esu 1 t by 100.
T i ie T o r miu 1 a of t tie Old ISE Index :
P ^ Q L t 1, t 100 45 P ^ 0 i=l to to E 1.^ * 100 t = l
P = Base period price of the tth stock to
Q = The total number of outstanding shares of the ith stock at to
the base period
P = The price of the ith stock at time t
0 = The total number of outstanding shares of the i t h stock at
time t
If a company increase its capital, the continuity of the index is p>rovided by adjusting the base period market value 'Sf that c o m p a n y .
C A S E 1 : İ f a company included in the index increase its capital by giving free shares from its revaluation fund there is no need to adjust its base period market value. The current mark.et value of the company is computed by multiplying the market price of the stock after the capital increase with the increased number of outstanding s h a r e s .
Example : Company A has a base period paid in capital of TL 1 billion and a base period price of TL 1000. Noting that the nominal value of TL 1000 is accepted as one share in \ S E , the outstanding shares in base period is found to be 1,000,000 and the base period market value is TL 1 billion. Its market }:»rice just before the incresae in capital is TL 24,500 and paid in capital is TL 2 billion. Hence;
T - l
24,500 ^ 2,000,000 1,000 * 1,000,000
^ 100 = 4,900
If company A increases its capital to TL 4 billion by giving a 1:1 free share (assuming that its revaluation fund is at least TL 2 billion) and its market price after the increase in capital is TL 13,750, then its index value may be calculated as follows:
1 = 13,750 « 4,000,000 , ^
1,000 « 1,000,000
C A S E 2 : I f a company included in the index increases its capital
by giving rights to its shareholders (capital increase by cash), t hi e n t hi e base period market value hi a s to hi e adjusted. T‘hi i s a d i u s t m e 711 is made b y a ]:■p 1 y i n g t hi e i o 1 1 o w i 7i g p r· o c e d u r· e .
a) The amount of capital inci-ease in cash is added to the market value at the day before the increase in capital.
b) This sum is divided by the index value at the day before the i 71 c r e a s e i 7i c a p· i t a 1 .
c) This value in (b) is the new base period market value and it is used as the base period mark.et value i 71 all of the c a lculations afterwards.
Example : Company A, in the example i7i Case 1;, increase its capital 100 % by giving rights to its shareholders. Its market price after the increase in capital is TL 13,000.
M nr, 1 4 . 1 2,000,000 ^ 24,500 + 2 billion
Isle’w B.P. market value = — ---1 b_____Z L Ji--- ^ 100
4900
1 L i , 0 4 0 , 6 1 6 , o 27
13,000 ^ 4,000,000 't+1 1,040,816,327
« 100 = 499G.08
This means that the market value of the company has increaased 1.96 % ( (96.08/4900)»il00) .
C A S E 3 : Company A iricreases its capital to TL 6 billion by giving free shares ot par value of TL 2 billion and by collecting TL 2 billion cash from the rights. Its market price after the increase in capital is TL 9,000. Therefore the index value after the increase in capital may be computed as follows:
9,000 6.000,000 1,040,816,327
* 100 = 5188.24
Substitutions can be a troublesome problem for an index ;cimputed from a smal 1 sairiple but the Old 1SE Index tiad been using ail of the stocks quoted i 71 the first market. T ti e r e m a y b e a s u b 5 1 i t i o n , deletion or addi tion only if there i s a. t r a n s f e r bet i·; e e n t fj e f i r- s t and t ti e second market of ISE. F 0 r these situations the ISE Index is multiplied by an a d j u £ t m e n t. coefficient,
The C r i t i q u e s that the Old ISE Index Faces :
Untill the 2nd half of 1989, the ISE meant nothing for most of the investors. Its daily trading volume was about TL 250 million and it was a typical "very thin m a r k e t ” with the poor frequency of trading of its stocks. In those days,nearly 100 % of the investors has been investing in foreign exchange, gold and
should саге İSE or its index. In the begi n n i n g of 19S9, the Central Bank got the control of foreign exchange rates and the demand for foreign exchange began to decrease. On the other hand, t ti e г e w a. s a supply pressure c- n gold in t ti e world and t hi i s a 1 s о effected the gold price in our country. Hence, the Turl-'ish investors began seeking for a new investment instrument and this new instrument was nothing but 1 £ E . In t hi e beginning of C' c t о In e r· 1969, the ISE Index has reached to 1600 caused by a demand boom. ISE hias managed to be the focal point of not only the Turkish investor's but also thie foreigners. As a natural result of this interest, investors have started to examine ISE. What has to be done in order to develop this market? How to build a good future for this market? The answers given to these questions put the problems of ISE into the picture. The ISE Index is one but not the most important of these problems. However, as its solution is easier than the others, this problem of the ISE w^as handled by the Board of Directors of ISE firstly. The critics that were given by the financial analyst and researchers to the Old ISE Index could be sun'imarized in two topics :1) Weighting 2) Sample size ^ Г' e p r· e s e n t a t i V e n e s s
1) W E I G H T I N G : Equal weights should not be used. Instead a
s e c u r i t y ’s weight in the index should be proportional to the fraction of total market value represented by all the f i r m s ’ shares outstanding. This problem could be best understood by the help of a small example.
E >: c·.ri! p 1 e :
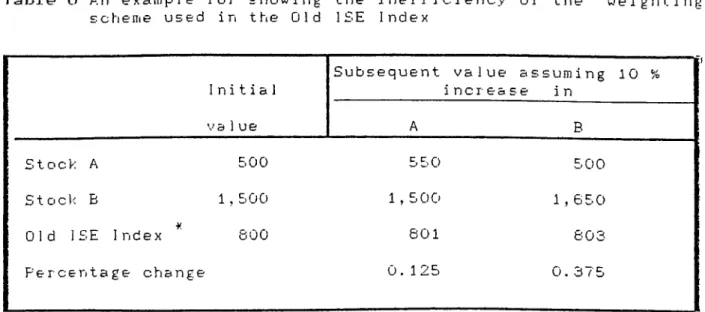
Table 6 An example for showing the inefficiency of the weighting E c i ‘i e m e u s e d i n t h e O l d 1 S E I n d e x
Initial
Subsequent value assuming 10 % increase in
V a 1 u e A B
£ t o c k A 500 550 500
S t o c ]< B 1,500 1,500 1,650
Old ISE Index 800 801 803
P e I' c e n t a g e c hi a n g e 0.125 0.375
^ The other 48 stocks are also included in the index but they are excluded from the table just for the sake of simpilicity. They are assumed to be kept constant in both cases.
Nearly 20 % of the total daily trading volume is made on stock A, o n the other hand only 1 % o f the total trading volume is made on stock B. As a logical consequence of this statement, an increase in stock A should affect the index value 20 times more than the same amount of increase in stock B. However, as stiown in Table 5, 10 % increase in stock B affects ttje Old 1£E Index more than 10 % increase in stock A which creates a big contrad i ct i on.
2) S A M P L E S I Z E R E P R E S E N T A T I V E N E S S : The size and the
traded will create a serious '’missirıg information'^ problem. In t ti e Old 1 £ E Index, t ti i s missing i n f o x- m a t. i o ri is sol v e d h- y c a x- x· >' i rj g forward the latest transaction price without change but this method was reducing the ability of the index to captuxe the g eu'i e r a 1 t x e n d in p x· i c e s . A more appropriate solution is to e X elude s ucfi b t o c 1··; s f x- om t tie i rid e x . A s a m ]:»1 e of sise 1 £ - 20 s fiou 1 d be selected to construct an index, and this sample should contain e 1 e m e ri t s x· e }:> x· e s e n t i n g all s e c t o i‘ s of t hi e industry.
B. NEW ISE INE^EX
In order to solve the problems associated with the Old ISE Index, ISE experts set up a, new index which w^as valid as of January 2,1990. It is a value-weighted index and is very similar to S ^ P Composite auid NYSE Indexes. It differs from them by its base period value that was set equal to 100. For the New ISE İ7idex the calculation is as follows :
5 0 New ISE = i-t 50 * 0 I l « 100 E * Q. ^ . lO vO \.= 1
w'tiexe P , Q. , P. . Q. эге as defined earlier
vt vt \ 0 1.0
In order to prevent a misadaption in the first a p p l i c a t i o n day of the new index, the total base period market value was adjusted. The market capi ta 1 i za t i oil of the stocks that were included in the index was TL 15,575,5E’.2, A O O , 000 and the Old ISE Index was 2217.6615 as of 29,12,1969. Hence the adjusted total
b a £ e jj e r i o d m a r· k e t v a. 1 u e :
5 0
E f*· - ^ 0
\.o t o IS,575,582.400, 0002217.6615
T' h 6 IJ0 W 1 h- E I n d t X r G CJ U i r 0 5 B. n G. d j U £· t n*i G Ti t VJ h G Ti G V G r G. Î 1 1· H'l issues additional stock or when a substitution is made in the index.
C.4SE' 1 : If a firm issues additional stocl: by giving free shares to their £ f) a. r e Ü 1 d e r· s , the index automatically adjusts. T fi e r· e ’ 1 1
be no change in the total base period value,only the
ou t s t a n d i n g shares number of the firm is cha.nged.
C A S E 2 : If a firm issues additionc». 1 stock by collecting cash
from its shareholders, the New ISE Index do require an adjus t m e n t in its total base period market value. This adjust merit process may be represented as follows :
BP BP ^ 1-1 CMC + C I O t - 1 (Equation 2) MC t - i
BP , BP : Ease period market value at t and t-1
i t - i ^
CIC : Capital increase in cash
HC , MC : The market capitalization at t a7*)d t-l t-i
Equ a t i o n 2 should be simplified furthermore by using the foriPiUla o f 11) e New ISE Index.
MC _ İSE ^ BP
İSE = i— i— ^ 100 ^ MC = --- i— i---(Eqn. 3)
t-1 t-1
BP
1-1 100
S u bstituting Equation 3 into Equation 2 ;
BP = BP *(1 + £ 1 £ _ ) = BP » ( 1 + --- 2İ.2---<· <-”1 t-1 MC BP * ISE t-1 t-1 t-1 ^ 1 0 0) Equation 4
Example : Kepez Elektrik Inc. has increased its capital from TL 10 billion to TL 20 billion by giving rights to its shareholders in January 22,1990. The base period value before the increase in capital was TL 7 0 2 , 3 4 2,643,365 and the ISE Index was 3 7 1 1 . 6 3 . H e n c e ; BP = TL 702,342,643,365 t-1 CIC =TL 10,000,000,000 ISE =3711,63 t- 1
S u b s t ituting these values into Equation 4, results in a new base period value of TL 702,612,066,772.
BP = 702,342,643,365 + « 100 = TL 7 0 2 , 6 1 2,066,772
C. RAPIDLY CHANGING FEATURES of the ISTANBUL STOCK E X C H ^ U G E
In order to construct the luost suitable merl'et index for the ISE v;hich will give an indication of the prices of the entire population under consideration, first of all, the features of the ISE has to be exainined. Hasan Ersel and M. Fatih Çoşan'^has done a similar work in 196G in which they attemipted to derive the most suitable sfiare pr-ice index for tfie ISE. After reviewing of the main features of t hie Ex chisinge , thiey came up w i t hi a ]:ji' i c e - we i ghi ted index composed of most actively traded shares and calculated by arithimetic mean. Their study is no more valid today as the
features of thie ISE hi as totally changed.
In thieir study they set up a table w hi ich shiows the frequency of trading of the 53 shares traded on the first market between January G, and February 7, 198G.
No. c> f d a. y s ^ l>lo. of stocks % S hi a, r e in Total S t o c k s
25 1 1.9 20 - 24 1 1.9 15 - 19 7 13.2 10 -- 14 8 15. 1 1 - 9 34 64.1 0 2 3.8 1) No o f d a y s a t I s a s t a p r i c e q u o t a t i o n i s a u a i l a b l e
İt wa.E apparent from their table that the i£E was a typical very ^’thin marlief’ (Table 7;. Preparing the same table for May 7- June & 1990 period, the big development in the market could easily be seen (Table 8) .
ÎNİo . of day s ^ InJo. of stocks % Share in Total Stocks
25 50 96.2 20 - 24 1 1.9 1 5 - 1 9 — 0.0 10 - 14 0. 0 1 - 9 1 0.0 0 0 0.0
i> U a o f d a y s a t I eas t a p r i c & q'u.o t a l i o n t s az?ai I a b I e
T a b l e 8 Frequency of trading for First Market stocks of ISE for the period May 7 - June 8, 1990
Vvhiile only one stock (1.9 %) was traded in every session in Table I f this number has reached to 50 (96.2 %) in Table 6 . If the
frequency of trading criterion is taken as to be traded in more than half of the sessions, only 12 stocks (22.64 %) in Table 7 car» be identified as satisfying ttiis condition wtiereas this number reaches to 51 (98.1 %) for Table 8. Hence, the first market of the ISE is no more a typical very "thin market" and the problems they claim to be caused by that structure of the market in c o m p u tation of an index seems to be d i iri i n i s h e d .