On the mechanism of CO adsorption on a silica-supported
ruthenium catalyst
Margarita Kantcheva∗ and Safak Sayan
Department of Chemistry, Bilkent University, 06533 Bilkent, Ankara, Turkey
E-mail: margi@fen.bilkent.edu.tr
Received 19 July 1998; accepted 16 April 1999
The adsorption of CO at room temperature on a Ru/SiO2catalyst has been studied by means of FTIR spectroscopy. Spectral evidence for formation of water molecules and a quantity of very dispersed ruthenium on the catalyst surface during CO adsorption was found. On the basis of these experimental results a new reaction scheme for the interaction of CO with a silica-supported ruthenium catalyst is proposed.
Keywords: silica-supported ruthenium, CO adsorption, morphology change, mechanism
1. Introduction
Supported ruthenium catalysts show high activity in the Fischer–Tropsch synthesis of long-chain hydrocarbons by CO hydrogenation [1,2]. For this reason, it is important to study how carbon monoxide molecules are adsorbed on the Ru clusters in the catalysts.
Literature data on the species arising during CO ad-sorption over ruthenium-containing catalysts and their main characteristics are summarized in a recent paper of Hadjiivanov et al. [3]. A variety of carbonyls have been proposed to depend upon the type of support, catalyst pre-cursor, reduction conditions and metal dispersion. It is gen-erally accepted that the spectrum of adsorbed CO on com-pletely reduced ruthenium supported on refractory oxides is characterized by three bands, a low-frequency (LF) band at 2040± 10 cm−1and two high-frequency bands appear-ing at 2140± 10 cm−1(HF1) and 2080± 10 cm−1(HF2).
There is agreement in the interpretation of the LF band, whose assignment to linearly adsorbed CO on metal crys-tallites comes from the data of CO adsorption on Ru single crystals [4,5]. However, there remain controversies about the origin of the high-frequency bands and different mod-els have been proposed. Several workers [6–9] attributed these bands to monocarbonyls formed on Run+ions or Ru
atoms in direct contact with oxygen, whereas dicarbonyl species have been assumed by others [10–20]. Zecchina et al. [15–17] attributed these bands to a complex of the type Ru(CO)2in which ruthenium is in different oxidation states
(Ru(II) or Ru(III)). Their assignment is based on investiga-tion of the decarbonylainvestiga-tion process of adsorbed Ru3(CO)12
on the support surface.
In several papers [3,21–26] the bands at ca. 2140 and 2080 cm−1are attributed to tricarbonyls with C3v
symme-∗To whom correspondence should be addressed.
try, in which a formal oxidation state of 2+ is assigned to the ruthenium by a majority of the authors. Arguments for this assignment are provided by experiments with 13CO
[3,24–26] and analogy with the IR spectral features of tricarbonyl halides of Ru(II) [24,25]. The intensity ratio HF1/HF2 observed for these species is found to be equal
to 0.5 if the sample is completely reduced [25]. The ini-tial oxidation state of ruthenium influences the value of the intensity ratio HF1/HF2 and the position of LF and HF1
bands [25].
The existence of oxidized ruthenium sites on well-reduced materials has been widely discussed. Some authors [6,8,10,15,20,27,28] suggest that Run+ions originate from the procedure of catalyst preparation and are left after the reduction. On the other hand, IR [3] and XPS [24] results strongly support the idea that CO oxidizes Ru0, i.e., corro-sive adsorption of CO takes place. However, the mecha-nism of this process is not clear. Solymosi and Rasko [19] proposed that the surface hydroxyl groups of Ru/Al2O3act
as an oxidizing agent and, as a result, molecular hydrogen is formed. An analogous reaction scheme was assumed by Robbins [24] and Yokomizo et al. [25] for Ru sup-ported on TiO2 and SiO2, respectively. They have
pro-posed oxidation of metallic Ru to Ru2+ and formation of the (MO)2Ru2+(CO)3 species according to the reaction:
Ru + 2M–OH + 3CO (MO)2Ru(CO)3+ H2
where M = Si4+ or Ti4+.
This reaction implies disruption of the Ru–Ru bond in the ruthenium clusters, i.e., the adsorption of CO is accom-panied by morphology changes in the catalyst. The high bond energy of Ru–CO is believed to be the driving force in this process [19]. The evidence for the occurrence of this interaction relies on the intensity decrease of the IR absorption due to isolated OH groups during CO adsorp-tion [19].
It should be pointed out that morphology change of metal clusters upon CO exposure is not limited to ruthenium and was observed first with supported rhodium [29–33]. CO-induced oxidative disruption is assumed also to take place with the latter catalysts.
EXAFS [34–36] and IR studies [3,19,35,36] have shown that the local structure around the metal atoms in Ru/TiO2 [3], Ru/γ-Al2O3[19,35,36] and Ru/MgO [36]
cat-alysts is influenced by CO adsorption. Mizushima et al. [35,36], however, questioned the occurrence of oxidative disruption of Ru clusters emphasizing the reductive prop-erties of CO. The reaction scheme above contradicts the experimental fact that the removal of adsorbed CO leads to restoration of the original spectrum in the ν(OH) re-gion [36]. Moreover, formation of Run+ ions during CO adsorption occurs on almost completely dehydroxylated surfaces [3]. In addition, all attempts to detect molecu-lar hydrogen have failed [29,35]. From their EXAFS and IR studies [34–36], Mizushima et al. [36] proposed another reaction scheme. According to these authors, the hydrogen atoms of isolated hydroxyl groups remain on the catalyst’s surface contrary to the proposal of hydrogen formation. The consumption of isolated OH groups of the support and their transformation to an associated form has been explained in terms of hydrogen bonding between the carbonyl group of mobile Ru(CO)xspecies and surface OH groups [36].
Other explanations for the appearance of Run+ ions in completely reduced samples include dissociation or dispro-portionation of CO [3,37–39]. However, in these cases there is no direct evidence to support the proposed mecha-nisms.
Since the mechanism of CO adsorption on supported ruthenium catalysts is still controversial, we studied the Ru/SiO2–CO system. In this paper we present new results
on the mechanism of CO adsorption on Ru/SiO2 obtained
by FTIR spectroscopy. In order to elucidate the role of the support hydroxyl groups in the interaction with CO and to enable the identification of the surface species produced, a partially deuteroxylated surface was also used.
2. Experimental
The silica support used for preparation of the catalyst was a commercial material (Degussa) having a surface area of 300 m2/g. The catalyst was prepared by the incipient
wetness technique (4 wt% of nominal ruthenium content) using ruthenium nitrosyl-nitrate solution (Strem Chemicals, 1.5 wt% Ru).
The FTIR spectra were recorded on a Boomed-MB102 (Hartmann & Braun) FTIR spectrometer at a resolution of 4 cm−1 (512 scans). A specially designed IR cell allowed registration of the spectra at ambient temperature and cat-alyst activation at higher temperatures. The cell was con-nected to a vacuum/adsorption apparatus. Self-supporting discs were used for the FTIR studies.
The sample was reduced in hydrogen (350◦C, 300 Torr, for 30 min) and after that evacuated at the same temperature
for 30 min. This procedure was repeated three times. Af-ter the final reduction, the sample was evacuated at 350◦C for 1 h. This treated sample is denoted as Ru/SiO2. To
replace the surface OH groups of the Ru/SiO2 sample by
OD groups, D2O (99.9%) vapor at 3 Torr was introduced
into the IR cell for 5 min at 350◦C and after that the cell was evacuated for 1 h at the same temperature (sample now denoted Ru/SiO2-OD). The notation Ru/SiO2-RO signifies
a sample which was reoxidized at room temperature with dry oxygen at 20 Torr for 10 min (after the reduction proce-dure described above) followed by evacuation for 30 min at 350◦C. The spectra of the catalysts thus activated taken at ambient temperature were used as a background reference. The carbon monoxide (99.95%) used was passed through an oxy-trap (Alltech) and a trap cooled by liquid nitrogen before admission to the IR cell.
3. Results
3.1. Adsorption of CO on Ru/SiO2 after reduction with hydrogen
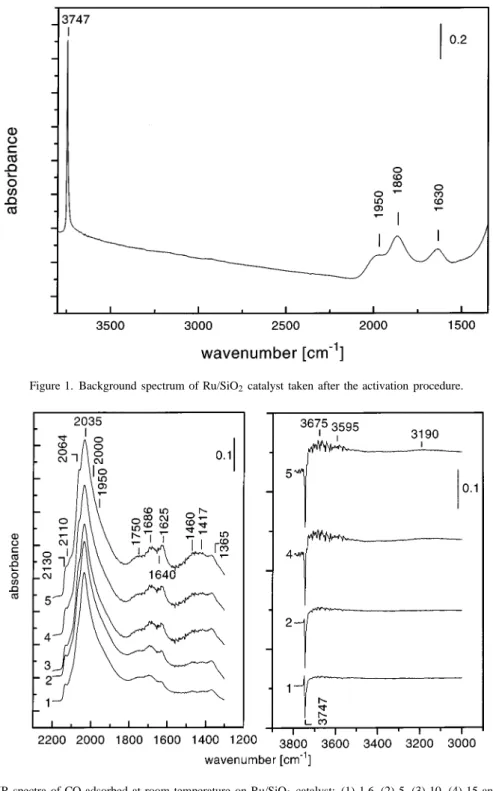
The background spectrum of the Ru/SiO2 catalyst after
the activation procedure is shown in figure 1. The spec-trum is characterized by three broad bands within the 2000– 1600 cm−1region. These absorptions are due to overtones of lattice vibrations (1950 and 1630 cm−1) and a combi-nation frequency at 1860 cm−1 [40]. The “cut-off” of the sample due to its self-absorption is at ca. 1350 cm−1. In the region of the OH stretching modes there is a narrow band with a maximum at 3747 cm−1 due to terminal Si– OH groups [41,42].
The spectra of adsorbed CO at room temperature (pres-sures in the range of 1.6–30.0 Torr) are presented in fig-ure 2. The increase in the amount of adsorbed CO leads to appearance of overlapping bands in the carbonyl region. Four bands at 2130, 2110, 2064 and 2035 cm−1are clearly detected together with poorly resolved absorptions at about 2000 and 1950 cm−1. The band at 2110 cm−1disappears after evacuation of the gaseous CO (not shown in the fig-ure), whereas the other bands decrease slightly in intensity. All these bands together with the broad absorption at about 1750 cm−1characterize different types of carbonyls formed upon CO adsorption.
In the low-frequency region (1700–1300 cm−1) a series of bands is observed. The weak absorption between 1460 and 1365 cm−1, the band at 1640 cm−1 (which appears as a shoulder of the band at 1625 cm−1) and the band at 1686 cm−1 could be assigned to carbonate structures [28, 43] arising from the interaction of CO with some unreduced ruthenium phase. The origin of the band at 1625 cm−1will be discussed below.
In the OH stretching region (figure 2) a sharp negative band at 3747 cm−1 develops with increase of the amount of CO admitted to the IR cell. Its behavior suggests that the number of isolated OH groups are decreased by CO ad-sorption. In addition, an absorption in the 3700–3450 cm−1
Figure 1. Background spectrum of Ru/SiO2catalyst taken after the activation procedure.
Figure 2. FTIR spectra of CO adsorbed at room temperature on Ru/SiO2catalyst: (1) 1.6, (2) 5, (3) 10, (4) 15 and (5) 30 Torr.
region together with a weak broad band centered at about 3190 cm−1 appears. The observed changes in the spectra indicate that some of the isolated OH groups are trans-formed into associated ones.
3.2. Adsorption of CO on a deuteroxylated sample (Ru/SiO2-OD)
The spectra in the carbonate–carbonyl region are shown in figure 3. The envelope of the carbonyl bands has some similarities with that of the Ru/SiO2 sample.
The adsorption of CO on the deuteroxylated sample (fig-ure 3) causes a gradual decrease of the intensity of the isolated Si–OD groups (negative band at 2760 cm−1 [42]) analogous to that observed for Si–OH groups in the case of Ru/SiO2 (figure 2). It should be pointed out that in
the first stages of CO adsorption (pressures between 1 and 10 Torr) the change of the band intensities is mainly as-sociated with the OD groups. The Si–OH groups are al-tered to a smaller extent. Here, again a transformation of isolated hydroxyl/deuteroxyl groups (3745/2760 cm−1) to associated ones is observed (weak bands at about 3675 and 3595 cm−1, and at 2734 and 2675 cm−1, respectively).
Figure 3. FTIR spectra of CO adsorbed at room temperature on Ru/SiO2-OD catalyst: (1) 1.6, (2) 5, (3) 10, (4) 15 and (5) 30 Torr.
Figure 4. FTIR spectrum in the carbonate–carbonyl region obtained by subtraction of the spectrum of adsorbed CO (30 Torr) on Ru/SiO2-OD catalyst from the spectrum of adsorbed CO (30 Torr) on Ru/SiO2catalyst.
At the same time, a broad absorption centered at about 3200 cm−1 (2635 cm−1) appears.
The main differences between the sample containing hy-droxyl groups and the deuteroxylated one are illustrated by the spectrum in figure 4. It is obtained by subtraction of the spectrum of adsorbed CO (30 Torr) on Ru/SiO2-OD from
the corresponding spectrum of Ru/SiO2. The differences
are as follows:
(1) Lower total absorbance of the bands in the carbonyl region in the case of Ru/SiO2-OD suggesting some
ag-glomeration of the Ru particles [7] caused by the D2O
vapor treatment. The decrease in the ruthenium disper-sion in the Ru/SiO2-OD catalyst affects the
consump-tion of the OD groups: at 30 Torr of CO it is approx-imately three times lower than that of the OH groups (compare figures 2 and 3).
(2) Strongly reduced intensity (disappearance) of the band at 1625 cm−1in the case of the deuteroxylated sample. (3) Appearance of an easily detectable absorption at
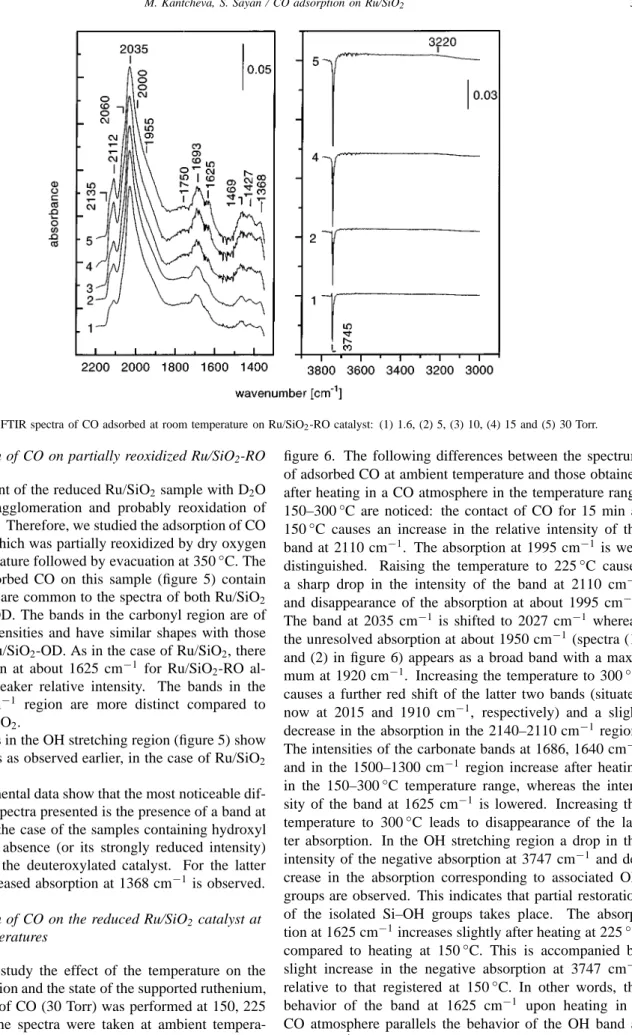
Figure 5. FTIR spectra of CO adsorbed at room temperature on Ru/SiO2-RO catalyst: (1) 1.6, (2) 5, (3) 10, (4) 15 and (5) 30 Torr.
3.3. Adsorption of CO on partially reoxidized Ru/SiO2-RO The treatment of the reduced Ru/SiO2sample with D2O
vapor causes agglomeration and probably reoxidation of some Ru0sites. Therefore, we studied the adsorption of CO
on a catalyst which was partially reoxidized by dry oxygen at room temperature followed by evacuation at 350◦C. The spectra of adsorbed CO on this sample (figure 5) contain features which are common to the spectra of both Ru/SiO2
and Ru/SiO2-OD. The bands in the carbonyl region are of
comparable intensities and have similar shapes with those observed on Ru/SiO2-OD. As in the case of Ru/SiO2, there
is an absorption at about 1625 cm−1 for Ru/SiO2-RO
al-though with weaker relative intensity. The bands in the 1500–1350 cm−1 region are more distinct compared to those for Ru/SiO2.
The changes in the OH stretching region (figure 5) show the same trends as observed earlier, in the case of Ru/SiO2
(figure 2).
The experimental data show that the most noticeable dif-ference in the spectra presented is the presence of a band at 1625 cm−1in the case of the samples containing hydroxyl groups and its absence (or its strongly reduced intensity) in the case of the deuteroxylated catalyst. For the latter sample an increased absorption at 1368 cm−1is observed. 3.4. Adsorption of CO on the reduced Ru/SiO2 catalyst at
higher temperatures
In order to study the effect of the temperature on the CO chemisorption and the state of the supported ruthenium, the adsorption of CO (30 Torr) was performed at 150, 225 and 300◦C. The spectra were taken at ambient tempera-ture in the presence of CO and the results are shown in
figure 6. The following differences between the spectrum of adsorbed CO at ambient temperature and those obtained after heating in a CO atmosphere in the temperature range 150–300◦C are noticed: the contact of CO for 15 min at 150◦C causes an increase in the relative intensity of the band at 2110 cm−1. The absorption at 1995 cm−1is well distinguished. Raising the temperature to 225◦C causes a sharp drop in the intensity of the band at 2110 cm−1 and disappearance of the absorption at about 1995 cm−1. The band at 2035 cm−1 is shifted to 2027 cm−1whereas the unresolved absorption at about 1950 cm−1(spectra (1) and (2) in figure 6) appears as a broad band with a maxi-mum at 1920 cm−1. Increasing the temperature to 300◦C causes a further red shift of the latter two bands (situated now at 2015 and 1910 cm−1, respectively) and a slight decrease in the absorption in the 2140–2110 cm−1 region. The intensities of the carbonate bands at 1686, 1640 cm−1 and in the 1500–1300 cm−1 region increase after heating in the 150–300◦C temperature range, whereas the inten-sity of the band at 1625 cm−1 is lowered. Increasing the temperature to 300◦C leads to disappearance of the lat-ter absorption. In the OH stretching region a drop in the intensity of the negative absorption at 3747 cm−1 and de-crease in the absorption corresponding to associated OH groups are observed. This indicates that partial restoration of the isolated Si–OH groups takes place. The absorp-tion at 1625 cm−1increases slightly after heating at 225◦C compared to heating at 150◦C. This is accompanied by slight increase in the negative absorption at 3747 cm−1 relative to that registered at 150◦C. In other words, the behavior of the band at 1625 cm−1 upon heating in a CO atmosphere parallels the behavior of the OH band at 3747 cm−1.
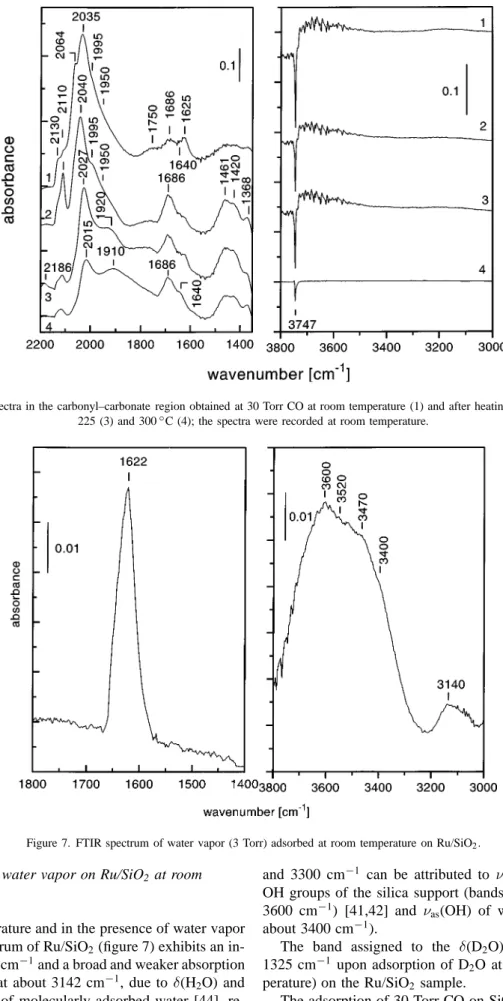
Figure 6. The FTIR spectra in the carbonyl–carbonate region obtained at 30 Torr CO at room temperature (1) and after heating for 15 min at 150 (2), 225 (3) and 300◦C (4); the spectra were recorded at room temperature.
Figure 7. FTIR spectrum of water vapor (3 Torr) adsorbed at room temperature on Ru/SiO2.
3.5. Adsorption of water vapor on Ru/SiO2 at room temperature
At room temperature and in the presence of water vapor at 3 Torr, the spectrum of Ru/SiO2(figure 7) exhibits an
in-tense band at 1622 cm−1and a broad and weaker absorption with a maximum at about 3142 cm−1, due to δ(H2O) and
νs(OH) vibrations of molecularly adsorbed water [44],
re-spectively. The strong and broad absorption between 3800
and 3300 cm−1 can be attributed to ν(OH) of H-bonded OH groups of the silica support (bands at 3470, 3520 and 3600 cm−1) [41,42] and νas(OH) of water molecules (at
about 3400 cm−1).
The band assigned to the δ(D2O) mode appears at
1325 cm−1upon adsorption of D2O at 3 Torr (room
tem-perature) on the Ru/SiO2 sample.
The adsorption of 30 Torr CO on SiO2 does not lead to
Table 1
Integrated absorbances (in arbitrary units) of the bands at different CO pressures obtained from curve-fitting procedure.
CO pressure Absorption band (cm−1)
(Torr) 2130 2110 2064 2035 1995 1930 3747 3740–3410 1625 HF2130 1 /HF2 (HF1) (HF1) (HF2) (LF) 1.6 0.37 0.42 7.90 15.42 12.82 10.04 0.53 3.79 0.38 0.05 5.0 0.51 0.80 8.47 23.53 13.73 6.50 0.59 4.98 0.85 0.06 10.0 0.59 1.07 10.41 23.06 13.92 6.88 0.62 5.57 2.12 0.06 15.0 0.68 1.23 11.47 21.35 14.49 7.00 0.65 6.17 2.45 0.06 22.0 0.72 1.29 12.21 21.50 14.74 7.12 0.67 7.23 2.67 0.06 30.0 0.89 1.48 13.63 19.24 15.55 9.67 0.73 8.19 2.81 0.06
Figure 8. The result of the curve-fitting procedure applied to the FTIR spectrum obtained at 30 Torr CO on the Ru/SiO2catalyst.
3.6. Results of the curve-fitting procedure
The spectra in the carbonyl region are complex and not well resolved. In order to analyze them, we used a curve-fitting procedure. The results of the adsorption of CO on Ru/SiO2 catalyst (at ambient temperature) in the pressure
range 1.6–30.0 Torr are presented in table 1. In this ta-ble the integrated absorbance of the negative OH bands at 3747 cm−1 and that of the broad positive band in the 3740–3410 cm−1 ν(OH) stretching region are also given.
The data for the band at 1625 cm−1 are included as well. Figure 8 shows a result of the curve-fitting procedure ap-plied to the spectrum in the carbonyl region obtained after adsorption of 30 Torr CO.
4. Discussion
4.1. State of the supported ruthenium
Table 2 summarizes the assignment of the bands ob-served in the carbonate–carbonyl region during CO adsorp-tion at room temperature on the catalysts studied.
The bands at 2130 and 2110 cm−1 indicate that CO is chemisorbed over reduced (Ru0) and oxidized (Run+) sites, respectively [25]. The latter sites are probably due to an incomplete reduction of the sample under the con-ditions employed. This conclusion is supported by the in-creased relative intensity of the band at 2110 cm−1on the reoxidized Ru/SiO2-RO sample. All of the samples
stud-ied contain an asymmetric broadening below 2000 cm−1. A similar absorption has been reported in other publications [13,20,24,28,45,46]. Some authors [13,15,35,36,38,46,49] have attributed the bands at 1900–1700 cm−1 to bridged carbonyls of the Ru0
2–CO type. Gupta et al. [28] have
observed bands at about 1995 and 1950 cm−1 on Ru– RuOx/TiO2 and have assigned them to CO linearly bonded
with ruthenium in different oxidation states. Other authors [20,24,45] attributed the low-frequency shoulder at about 2000 cm−1 to CO adsorbed on Ru atoms of low coor-dination which are located on steps, corners, high index faces. These defects are typical for very dispersed ruthe-nium. Based on the latter consideration, we interpret the band at 1995 cm−1 as an indication of high surface dis-persion of the deposited ruthenium. In the spectra of
ad-Table 2
Assignment of the IR bands observed in the carbonate–carbonyl region during CO adsorption at room temperature on the catalysts studied.
Nomenclature Frequency Possible assignment Ref. (cm−1)
HF1 2130 O2−–Ru(CO)3 [25]
HF2 2064 O2−–Ru(CO)3+ RuOx(CO)3+ RuOx(CO) [25]
HF1 2110 RuOx(CO)3 [25]
LF 2034 Ru(CO) [25]
– 2000 Isolated CO molecules adsorbed on [20,24,45] low-coordinated Ru atoms located on very
small Ru particles
1950 Ru2(CO) [13,15,35,36,38,46]
– 1750 µ-bonded carbonyl [46] – 1680, 1645, Carbonate species located on oxidized [this work]
1470–1370 ruthenium phase
sorbed CO on all of the samples studied a weak, broad absorption at about 1750 cm−1 is observed. Similar ab-sorption is reported for CO adsorbed on Ru/TiO2 [46],
Ru/Al2O3 [47] and Ru/SiO2 [48] and is assigned to a
µ-bonded carbonyl complex in which both the carbon and
oxygen atoms of the adsorbed CO are coordinated to a ruthenium site [47].
The experimental results suggest coexistence of reduced and oxidized ruthenium on the catalyst surface. The pres-ence of the latter sites can be associated with the use of Ru(NO)(NO3)3 as a precursor for the catalyst preparation.
In situ IR diffuse-reflectance spectra of the catalyst stud-ied [50] do not show the presence of NO3 groups after
reduction of the catalyst with hydrogen at 350◦C. How-ever, residual NO species (which display higher thermal stability than NO3 groups [50]) could survive after the
pro-cedure of catalyst activation. Their detection probably is obscured by the strong absorption of the silica support in the region 2100–1500 cm−1. A similar effect of residual Cl−ions on the oxidation state of Ru was observed for cata-lysts prepared from a RuCl3precursor. They retain chlorine
[20,49,51,52] and cannot be completely reduced with hy-drogen even at temperatures as high as 600◦C [53–56]. It is believed that the residual chloride is associated with the supported metal [52].
In a recent paper, Hadjiivanov et al. [3] propose the idea of direct oxidation of a part of the Ru by CO after its admission to the IR cell. They assumed dissociation of CO to occur in the IR beam on some particular ruthenium sites (defects, less regular planes). It is possible to assume that oxidized Run+sites (detected by the Run+(CO)
3 band
at 2110 cm−1) on the Ru/SiO2 catalyst studied could be
formed by an analogous process. However, according to other literature [13,51,57,58] and our data (see below) the decomposition of CO over Ru-containing catalysts takes place with measurable rate at temperatures above 140◦C. Although the possibility of some decomposition of CO at room temperature cannot be ruled out, we believe that the oxidized ruthenium sites are probably due to NOx
impuri-ties.
The experimental data in figure 6, spectrum (2), show that the decomposition of CO molecules over the Ru/SiO2
occurs to an appreciable extent at 150◦C: the heating of the catalyst at this temperature in the presence of CO results in a strong increase in the amount of Run+ions (the intensity of the band at 2110 cm−1is considerably higher). However, as the temperature is increased to 225◦C, CO can act as an effective reductant (observed also by others [20]). As a re-sult of this, the amount of Run+ions on the catalyst surface
has strongly decreased (figure 6, spectrum (3)). The weak absorption at 2186 cm−1which appears under these condi-tions could be attributed to physisorbed CO [28]. Further heating of the sample to 300◦C does not lead to complete reduction. It could be assumed that in the CO atmosphere two competitive processes take place: reduction of Run+
ions by CO at a temperature higher than 150◦C and low-temperature oxidation of some Ru0 atoms by CO during
lowering the temperature to ambient. The red shift of the band at 2035 cm−1 (room-temperature adsorption of CO) to 2015 cm−1(after heating in a CO atmosphere at 300◦C) and the disappearance of the band at 1995 cm−1after heat-ing at 225◦C can be explained in terms of the equilibrated phase of adsorbed CO as proposed by Guglielminotti et al. [45]. The growth of the bands at about 1950–1920 cm−1 (shifted to 1915 cm−1after heating at 300◦C) is associated with an enhancement in the amount of bridged carbonyls. The changes in the IR band intensities and positions can be related to temperature-induced structural reorganization and probably to carbon deposition [27] resulting from dis-sociative adsorption of CO.
Finally, the weak bands seen in the 1350–1700 cm−1 region upon CO adsorption at room temperature can be attributed to carbonate species, probably bridged carbonates with syn–syn and syn–anti structures [17]. This assignment is supported by their resistance toward evacuation. The carbonate structures can be formed by interaction between Run+ions and CO. Similar bands are reported in [16] and are associated with adsorption of CO2(which was found to
be a product of the interaction of CO with RuOx/TiO2 at
4.2. CO-induced fragmentation of supported ruthenium clusters
During the adsorption of CO on all of the catalysts stud-ied, a depletion of isolated OH/OD groups and appearance of associated OH/OD groups is observed. Consumption of isolated OD groups prior to OH groups suggests different reactivity of the surface hydroxyls. It is reasonable to as-sume that the most reactive OH groups are exchanged first for OD groups which are then involved in further interac-tions.
The decrease in the absorption intensity of isolated hy-droxyls/deuteroxyls and increase of absorption intensity of associated (hydrogen-bonded) ones can be interpreted as an indication that structural changes take place on our Ru/SiO2 sample. The most striking point is that in the
case of the deuteroxylated sample the band at 1625 cm−1 has almost vanished but it is easily observed in the case of OH-containing samples (reduced and reoxidized). This band develops together with an absorption associated with hydrogen-bonded hydroxyls. Based on the spectrum of ad-sorbed water vapor on Ru/SiO2, the band at 1625 cm−1is
attributed to the δ(HOH) mode of water molecules formed during CO adsorption. This assignment is further supported by the synchronous behavior of the band at 1625 cm−1and the negative band at 3745 cm−1 during the heating of the Ru/SiO2 catalyst in the atmosphere of CO. Treatment of
the catalysts with CO at 300◦C followed by cooling down to room temperature caused disappearance of the band at 1625 cm−1 and partial restoration of the isolated Si–OH groups. In the spectra of adsorbed CO on the deuterox-ylated sample, Ru/SiO2-OD, an increased absorption at
1368 cm−1was observed which we assign to the δ(DOD) mode of adsorbed D2O. Obviously, the structural changes
in the Ru/SiO2 catalyst induced by CO adsorption are
ac-companied by formation of water molecules. This confirms the assumption of Mizushima et al. [36] that the hydrogen remains on the surface during the adsorption of CO on sup-ported ruthenium catalysts. In addition, this provides evi-dence that mobile Ru–CO species migrate and replace the hydrogen from the Si–OH groups. The liberated protons are coordinated to surface (cus) O2− ions (giving rise to H-bonded OH groups) and recombine with Si–OH groups to produce water molecules. Part of the mobile Ru0–CO
species could form very small Ru particles on which CO is linearly adsorbed. The following scheme illustrates the proposed process:
Ru0x+ xCO(g)→ (Ru0–CO)x−1+ (Ru 0
–CO)m (1)
(Ru0–CO)m→ (Ru 0
–CO)surf (2)
(Ru0–CO)m+ (OH−)surf →
(O2−–Ru–CO)surf+ (H +
)surf (3)
(O2−–Ru–CO)surf+ 2CO→ (O 2−
–Ru(CO)3)surf (4)
(H+)surf+ (O2−)surf → (OH−)surf (5)
(OH−)surf+ (OH−)surf→ (OH−· · ·OH−)surf (6)
(H+)surf+ (OH−)surf→ (H2O)ads (7)
where Rux are ruthenium atoms on the surface of the
Ru clusters; (Ru0–CO)
x−1 represents the monocarbonyls
formed on the surface of the extended Ru phase (LF band at 2030 cm−1); (Ru0–CO)
mis the mobile carbonyl species;
(O2−–Ru–CO)
surf is a transient species which coordinates
two additional molecules of CO forming a tricarbonyl species (O2−–Ru(CO)
3)surfcharacterized by a portion of the
HF1 band at 2064 cm−1 and the HF2 band at 2130 cm−1;
(Ru0–CO)
surf represents nearly isolated Ru0–CO species to
which we assign the absorption at 1995 cm−1.
The data in table 1 show that with the increase in CO pressure from 5.0 to 30.0 Torr the total absorbance of the band at 2035 cm−1decreases, i.e., the concentration of the Ru0–CO species on the surface of the extended Ru phase decreases with increase in the CO coverage. This fact leads to the conclusion that the process of CO-induced disruption of the Ru clusters occurs with those Ru atoms which are in closest proximity to the support surface.
It could be assumed that the rate-determining step is the CO-induced disruption of the ruthenium atoms from the clusters (reaction (1)). Therefore, if the proposed mech-anism is valid, the following linear relationships can be expected: between the concentration of the monocarbonyl species located on the surface of the Ru clusters (LF band at 2035 cm−1) and
(i) the concentration of the tricarbonyl species, O2−–
Ru(CO)3 (HF1 band at 2130 cm−1); and
(ii) the concentration of the isolated Ru0–CO species
char-acterized by the adsorption at 1995 cm−1.
In addition, the amount of OH groups consumed (the negative band at 3745 cm−1) should correlate linearly with the amount of the O2−–Ru(CO)3formed according to
reac-tions (3) and (4), on the one hand, and with the amount of water molecules produced (reaction (7)) and the amount of hydrogen-bonded OH groups (reactions (5) and (6)), on the other hand. The latter two concentrations are pro-portional to the integrated absorbance in the region 3740– 3410 cm−1which includes the ν(OH) stretching vibration of the hydrogen-bonded OH groups and νas(OH) modes of
the water molecules produced.
All these plots are presented in figure 9. The observed linearity shows direct correlation between the concentra-tions of surface species which are consumed and produced during the CO adsorption and supports the validity of the proposed mechanism.
The points in figure 9 (a) and (b) corresponding to the lowest equilibrium pressure of CO (1.6 Torr) applied do not fit to the linear correlation. The integrated absorbance of the band at 2035 cm−1 obtained upon 1.6 Torr of CO (table 1) is much lower compared to that which could be obtained by extrapolation of the corresponding values at higher CO pressures. The reason for this could be the preferential CO adsorption on sites near the surface of the pellet, as suggested in [24,45]. At low equilibrium CO pres-sures, this process should predominate over CO adsorption
Figure 9. Correlation between the integrated absorbances of the species consumed and those produced on the surface of Ru/SiO2 catalyst during CO adsorption in the pressure range 1.6–30.0 Torr: (a) the integrated absorbance of the HF1band (2130 cm−1) versus the integrated absorbance of LF band (2035 cm−1); (b) the integrated absorbance of the band at 1995 cm−1versus the integrated absorbance of LF band (2035 cm−1); (c) the integrated absorbance of the HF1band (2130 cm−1) versus the integrated absorbance of the negative Si–OH band at 3747 cm−1; and (c) the integrated
absorbance in the region 3740–3410 cm−1versus the integrated absorbance of the negative Si–OH band at 3747 cm−1.
in the sample pores. This suggests presence of Ru parti-cles which are not covered by CO under these conditions and accounts for the observed deviations in the correlation diagrams.
The gradual increase in the CO coverage leads to two effects:
(i) Increase in the intensity of the band at 1995 cm−1 (at-tributed to nearly isolated Ru0–CO species) at the
ex-pense of the band at 2035 cm−1due to Ru0–CO species located on the extended Ru clusters. This means that the adsorption of CO leads to increase in the dispersion of the Ru particles.
(ii) Water molecule formation due to replacement of pro-tons from the surface OH groups by mobile Ru0–
CO species. As a result of this process O2−–Ru(CO) 3
species are formed. The latter are directly coordi-nated to the silica surface and, as a consequence of this, the character of the ruthenium atom is affected by the nearby O atom. A model which ascribes the HF bands to CO on Ru which strongly interacts with species like O, Cl or OH, was proposed by Brown and Gonzales [6] and Chen et al. [7]. The liberated protons further recombine with surface OH groups producing H2O. The adsorbed water molecules dissociate at
tem-peratures above 225◦C. This process is accompanied by partial restoration of the isolated Si–OH groups and further morphology changes leading to agglomeration of the Ru particles (bands at 1920–1910 cm−1 due to
bridged carbonyls which appear with increased inten-sity).
It is reasonable to assume the reaction scheme pre-sented above because of the known acidity of Si–OH groups [41,59]. This process is associated with mobile surface Ru0–CO species since it does not occur on pure silica when CO is adsorbed. The extent of proton replacement in the Si–OH groups by the mobile Ru0–CO species will depend
on their amount. The higher the number of mobile species, i.e., the larger the dispersion of Ru, the stronger the alter-ation of the isolated OH groups and the larger the amount of water molecules produced. We believe that the lower decrease in the intensity of the Si–OD groups compared to that of the silanol groups is due to a lowering in the ruthe-nium dispersion during the high-temperature treatment of the Ru/SiO2 catalyst with D2O vapor.
Mizushima et al. [36] reported no fragmentation to oc-cur during CO adsorption on a Ru/SiO2 catalyst. Their
conclusion about absence of Ru–Ru bond breaking in the Ru/TiO2 catalyst [36] is also not in agreement with that
reported in [3]. Hadjiivanov et al. [3] established an in-crease in the metal dispersion by 20% in reduced Ru/TiO2
catalyst when the CO adsorption temperature is raised from 100 K to ambient temperature. The reason for this discrep-ancy might be associated with the type of supports used [3] and different dispersion of the ruthenium in the catalysts employed. We do not have data on the size of the ruthe-nium particles in our Ru/SiO2 catalyst. However, there is
indirect evidence of formation of very dispersed Ru on the silica surface: the presence of a low-frequency component
(at 1995 cm−1) of the band at 2030 cm−1 [20,24,45]. If we assume that the decrease in the integrated absorbance of the LF band (table 1, figure 9 (a) and (b)) can be used as a measure of the increasing Ru dispersion during CO adsorp-tion at room temperature, it is possible to estimate that the metal dispersion is augmented by 18% in the 5.0–30.0 Torr CO pressure range.
An important factor which could be associated with the involvement of the surface OH groups in the process of CO adsorption on Ru-containing catalysts is their acidity. In the case of the Ru/SiO2 catalyst studied, the
fragmenta-tion of the Ru clusters leads to water molecule formafragmenta-tion due to the tendency of Si–OH groups to donate protons [41,59]. It is known that Ti–OH [39] and Mg–OH groups [60,61] have a basic character and that the surface Al–OH groups possess weak Brønsted acidity [59]. In these oxides (when used as supports for Ru catalysts) mobile protons cannot be expected or the amount of the water molecules eventually produced due to proton recombination with the surface OH groups would be too low to be detected. In this case, the appearance of associated OH groups upon CO ad-sorption is explained by the reaction scheme proposed by Mizushima et al. [36]. It should be pointed out that for Ru/SiO2 catalyst a hydrogen bonding between the surface
hydroxyls and located in the vicinity carbonyl species can-not be excluded to occur. Probably, the less reactive Si–OH groups are involved in this interaction. This assumption is supported by the fact that the integrated absorbances of the band at 1625 cm−1(δ(H2O)) obtained at different CO
pres-sures are not linearly related to the integrated absorbances of the negative OH band at 3747 cm−1. The process of al-teration of the surface hydroxyl groups could be controlled by diffusional transport phenomena and this might be the reason that in the case of the Ru/TiO2 catalyst studied by
Hadjiivanov et al. [3] the Ti–OH groups were not affected during CO adsorption despite the observed Ru–Ru bond breaking induced by the adsorbate.
Finally, two potential sources of experimental error re-lated to the origin of the band at 1625 cm−1 due to the
δ(H2O) mode of adsorbed water should be considered. It
is known [51,57,58,62] that during CO adsorption on Ru-containing catalysts at temperatures above 140◦C the fol-lowing reactions take place:
CO→ Cs+ Os (8)
Os+ CO→ CO2 (9)
When hydrogen is present in addition to CO, the surface oxygen Os can be removed by the reaction
Os+ H2 → H2O (10)
which is more efficient than reaction (9) [62].
If we assume that decomposition of CO occurs below 150◦C (this possibility has already been discussed above) the purity of CO admitted to the IR cell is of great impor-tance to the reliability of the results. The hydrogen content in the CO used by us is 10 ppm. Other impurities such
as CO2, H2O and hydrocarbons are removed with a
liq-uid nitrogen trap before the admission of CO to the IR cell. We believe that the amount of water eventually pro-duced according to reaction (10) during the adsorption of CO at room temperature would be negligible for two rea-sons: (i) the low hydrogen concentration in the CO and (ii) the low number of Ru active sites able to initiate re-action (8) at this temperature. Moreover, our experimental results confirmed that CO decomposition takes place to an appreciable extent at 150◦C. This means that, if water is produced according to reaction (10), its amount is expected to be greatest under these conditions. The spectra in fig-ure 6 show that there is no increase in the absorbance at 1625 cm−1(compared to that at room temperature). Also no CH stretching frequencies are detected. However, the occurrence of reaction (9) can influence the amount of ad-sorbed CO2. This could explain the fact that after heating
in CO there is an increase in the intensities of the bands in the 1700–1630 and 1500–1300 cm−1regions (correspond-ing to carbonate structures) compared to those obtained at room temperature.
The possibility of water adsorption due to a leaking IR cell can be ruled out. If there were a leakage, the spectra of adsorbed CO would be altered by the oxygen which would enter the IR cell together with the water. There were no changes in the FTIR spectra of adsorbed CO (1.6 and 10.0 Torr, respectively) for a period of 6 h, i.e., the band at 2110 cm−1due to Run+–(CO)
3 did not grow with
the time of CO contact.
5. Conclusions
The main conclusions of our study can be summarized as follows:
The adsorption of CO on a Ru/SiO2catalyst causes
dis-ruption of the Ru–Ru bond in the metal clusters and, as a result, mobile Ru0–CO species are formed. Some part of
them interact with the isolated Si–OH groups and replace the protons of the hydroxyl groups. This process leads to transformation of the isolated hydroxyl groups to associ-ated ones and to water molecule formation. In addition to this, O2−–Ru(CO)
3 species are produced which are
di-rectly bonded to the silica surface. The mobile Ru0–CO
species form nearly isolated Ru0–CO species, i.e., a
quan-tity of very small Ru particles is produced on which CO is chemisorbed. As a consequence of these processes the metal dispersion in Ru/SiO2 catalyst is increased.
Acknowledgement
We thank Dr. Deniz ¨O. ¨Uner for providing the catalyst. We also appreciate the helpful comments of Professor Dr. S. S¨uzer on the manuscript.
References
[1] J.H. Sinfelt, Adv. Catal. 23 (1973) 91. [2] M.A. Vannice, J. Catal. 37 (1975) 449.
[3] K. Hadjiivanov, J.-C. Lavalley, J. Lamotte, F. Mange, J. Saint-Just and M. Che, J. Catal. 176 (1998) 415.
[4] F.M. Hoffman and M.D. Wesel, Surf. Sci. 269/270 (1992) 495. [5] K.L. Kostov, H. Rauscher and D. Menzel, Surf. Sci. 278 (1992) 62. [6] M.F. Brown and R.D. Gonzales, J. Phys. Chem. 80 (1976) 1731. [7] H.-W. Chen, Z. Zhong and J.M. White, J. Catal. 90 (1984) 119. [8] J. Evans and G.S. McNulty, J. Chem. Soc. Dalton Trans. 80 (1984)
1123.
[9] C.H. Peden and F.M. Hoffmann, Catal. Lett. 10 (1991) 91. [10] A.A. Davydov and A.T. Bell, J. Catal. 49 (1977) 332.
[11] V.L. Kuznetsov, A.T. Bell and Y.I. Yermakov, J. Catal. 65 (1980) 374.
[12] A. Bossi, G. Carniso, F. Gabrassi, G. Guinchi, G. Petrini and L. Zanderighi, J. Catal. 65 (1980) 16.
[13] H. Yamasaki, Y. Kobori, S. Naito, T. Onishi and K. Tamaru, J. Chem. Soc. Faraday Trans. I 77 (1981) 2913.
[14] F. Solymosi, A. Erd¨ohelyi and M. Kocsis, J. Chem. Soc. Faraday Trans. I 77 (1981) 1003.
[15] A. Zecchina, E. Guglielminotti, A. Bossi and M. Camia, J. Catal. 74 (1982) 225.
[16] E. Guglielminotti, A. Zecchina, A. Bossi and M. Camia, J. Catal. 74 (1982) 240.
[17] E. Guglielminotti, A. Zecchina, A. Bossi and M. Camia, J. Catal. 74 (1982) 252.
[18] A. Beck, S. Dobs and L. Guczi, Inorg. Chem. 27 (1988) 3220. [19] F. Solymosi and J. Rasko, J. Catal. 15 (1989) 107.
[20] E. Guglielminotti and G.C. Bond, J. Chem. Soc. Faraday Trans. 86 (1990) 979.
[21] G.M. Zanderighi, C. Dossi, R. Ugo, R. Psaro, A. Theolier, A. Choplin, L. D’Ornelas and J.M. Basset, J. Organomet. Chem. 296 (1985) 127.
[22] H. Kn¨ozinger, Y. Zhao, B. Tesche, R. Barth, R. Epstein, B.C. Gates and J.P. Scott, Faraday Discuss. Chem. Soc. 72 (1985) 53. [23] L. D’Ornelas, A. Theolier, A. Choplin and J.M. Basset, Inorg. Chem.
27 (1988) 1261.
[24] J.L. Robbins, J. Catal. 115 (1989) 120.
[25] G.H. Yokomizo, C. Louis and A.T. Bell, J. Catal. 120 (1989) 1. [26] H. Landmesser and H. Miessner, J. Phys. Chem. 95 (1991) 10544. [27] Z. Schay, K. L´az´ar, J. Mink and L. Guczi, J. Catal. 87 (1984) 87. [28] N.M. Gupta, V.S. Kamble, R.M. Iyer, K. Ravindranathan Thampi
and M. Gr¨atzel, J. Catal. 137 (1992) 473.
[29] F.J. van’t Blik, J.B.A.D. van Zon, T. Huizinga, J.C. Vis, D.C. Koningsberg and R. Prins, J. Am. Chem. Soc. 107 (1985) 3139.
[30] F. Solymosi and M. Pasztor, J. Phys. Chem. 89 (1985) 4783. [31] F. Solymosi and M. Pasztor, J. Phys. Chem. 90 (1986) 5312. [32] P. Basu, D. Panayotov and J.T. Yates, Jr., J. Phys. Chem. 91 (1987)
3133.
[33] P. Basu, D. Panayotov and J.T. Yates, Jr., J. Am. Chem. Soc. 110 (1988) 2074.
[34] T. Mizushima, K. Tohji and Y. Udagawa, J. Am. Chem. Soc. 110 (1988) 4459.
[35] T. Mizushima, K. Tohji and Y. Udagawa, J. Phys. Chem. 94 (1990) 4980.
[36] T. Mizushima, K. Tohji, Y. Udagawa and A. Ueno, J. Am. Chem. Soc. 112 (1990) 7887.
[37] G.J. Goodwin, Jr. and C. Naccache, J. Catal. 64 (1980) 482. [38] E. Guglielminotti, Langmuir 2 (1986) 812.
[39] K. Hadjiivanov and D. Klissurski, Chem. Soc. Rev. 25 (1996) 61. [40] F. Poignant, J. Saussey, J.-C. Lavalley and G. Mabilon, J. Chem.
Soc. Chem. Commun. (1995) 89. [41] J.B. Peri, J. Phys. Chem. 70 (1966) 2937.
[42] A.J. McFarlan and B.A. Morrow, J. Phys. Chem. 95 (1991) 5388. [43] G. Busca and V. Lorenzelli, Mater. Chem. 7 (1982) 89.
[44] T. Lopez, P. Bosch, M. Asomoza and R. Gomez, J. Catal. 133 (1992) 247.
[45] E. Guglielminotti, S. Spoto and A. Zecchina, Surf. Sci. 161 (1985) 202.
[46] M.W. McQuire and C.H. Rochester, J. Catal. 157 (1995) 396. [47] C.S. Kellner and A.T. Bell, J. Catal. 71 (1981) 296. [48] M.W. McQuire and C.H. Rochester, J. Catal. 141 (1993) 355. [49] Sh.-I. Pien and S.S.C. Chuang, J. Mol. Catal. 68 (1991) 313. [50] S. Sayan, S. S¨uzer and D.O. Uner, J. Mol. Struct. 111 (1997) 410. [51] G.G. Low and A.T. Bell, J. Catal. 57 (1979) 397.
[52] T. Narita, H. Miura, K. Sugiyama, T. Matsuda and R.G. Gonzalez, J. Catal. 103 (1987) 492.
[53] G. Blanchard, H. Charcosset, M.T. Chenebauz and M. Primet, in:
Stud. Surf. Sci. Catal., Vol. 3 (Elsevier, Amsterdam, 1978) p. 197.
[54] A. Bossi, F. Garbassi, A. Orlandi, G. Petrini and L. Zanderighi, in:
Stud. Surf. Sci. Catal., Vol. 3 (Elsevier, Amsterdam, 1978) p. 405.
[55] P.G.J. Koopman, A.P.G. Kieboom and H. van Bekkum, J. Catal. 69 (1981) 172.
[56] J.A. Don, A.P. Pijpers and J.J.F. Scholten, J. Catal. 80 (1983) 296. [57] J.A. Rabo, A.P. Risch and M.L. Poutsma, J. Catal. 53 (1987) 295. [58] G.H. Yokomizo, C. Louis and A.T. Bell, J. Catal. 120 (1989) 15. [59] A. Davydov, IR Spectroscopy Applied to Surface Chemistry of Oxides
(Nauka, Novosibirsk, 1984).
[60] A.J. Tench and D. Giles, J. Chem. Soc. Faraday Trans. I 68 (1972) 193.
[61] A.J. Tench, J. Chem. Soc. Faraday Trans. I 68 (1972) 197. [62] J.G. Ekerdt and A.T. Bell, J. Catal. 58 (1979) 170.