Contents lists available atScienceDirect
Economics Letters
journal homepage:www.elsevier.com/locate/ecolet
Predictability dynamics of emerging sovereign CDS markets
Ahmet Sensoy
a,*
, Frank J. Fabozzi
b, Veysel Eraslan
caBilkent University, Faculty of Business Administration, Ankara 06800, Turkey bEDHEC Business School, BP3116, Nice Cedex 3, 06202, France
cBorsa Istanbul, Equity Market Department, Emirgan, Istanbul 34467, Turkey
h i g h l i g h t s
• Time-varying weak-form efficiency of emerging sovereign CDS markets is analyzed. • We use permutation entropy with a rolling-window framework.
• Emerging sovereign CDS markets have different degrees of time-varying efficiency. • CDS markets can be weak-form efficient even in the crises episodes.
• We find strong negative relation between sovereign risk and CDS market efficiency.
a r t i c l e i n f o
Article history:
Received 11 July 2017
Received in revised form 10 September 2017
Accepted 14 September 2017 Available online 20 September 2017
JEL classification: C53 C65 G14 G15 Keywords:
Efficient market hypothesis (EMH) CDS
Permutation entropy
a b s t r a c t
We compare the time-varying weak-form efficiency of Credit Default Swap (CDS) markets of 15 emerging countries by using permutation entropy approach. We find that CDS markets have different degrees of time-varying efficiency. Using several robustness test, we find that Thailand, China, South Korea and Malaysia have the most efficient CDS markets while South Africa, Colombia and Turkey are the least efficient. Our results show that CDS markets can be efficient even in the crisis episodes. Our findings also suggest a strong negative relation between sovereign risk and CDS market efficiency.
© 2017 Elsevier B.V. All rights reserved.
1. Introduction
Since the trading of credit default swaps (CDSs) began in 1994, market participants have used this credit derivative market not only for transferring credit risk but also as an indicator of the potential default risk of sovereign and corporate bonds. A typical CDS contract involves one party agreeing to sell credit protection (protection seller) to another party (protection buyer) who pays periodically a fee over the contract’s tenor. If a credit event occurs, the protection buyer terminates the fee payments and receives compensation from the protection seller. Despite the global impor-tance of this market, there have only been a few studies of its price
efficiency in any of the forms defined byFama(1970), — weak,
*
Corresponding author.E-mail address:[email protected](A. Sensoy).
semi-strong, and strong. Our study focuses on the weak-form of market efficiency for the sovereign sector of the CDS market, a market not covered in previous studies.
The implication of a weak-form efficient sovereign CDS market is that information is impounded into CDS spreads in a timely manner, and that the country’s default probability has an unpre-dictable pattern. Whereas in the case of weak-form inefficiency, the default probability follows a more or less predictable path over a long horizon. In other words, trading the weak-from inefficient sovereign CDS contracts could be profitable for an investor who is skilled enough to exploit market inefficiencies. On the other hand, weak-form efficient sovereign CDSs are less likely to be used as the sole trading instrument to gain speculative returns. From a macroeconomic perspective, if CDSs are assumed to be a general indicator of a country’s economy, the predictability pattern may not only be observed in daily CDS changes, but also in other economic indicators as well.
http://dx.doi.org/10.1016/j.econlet.2017.09.015
Only five studies have examined the price efficiency of the CDS market, four focusing on the corporate CDS sector and one on
the sovereign CDS sector. Two studies,Zhang and Zhang(2013)
andJenkins et al.(2016), test the semi-strong form for the U.S. corporate CDS market. Both studies find that this sector of the
CDS market is informationally efficient. However, althoughJenkins
et al.(2016) find that the U.S. corporate CDS market is efficient before and after the global crisis in 2008, they call into question its efficiency during the crisis period.Avino and Nneji(2014) find that European corporate CDS spreads are characterized by the existence of a predictable pattern and conclude that this CDS market sector is not weak-form efficient. Investigating the U.S. and European corporate CDS markets,Kiesel et al.(2016) conclude that the mar-ket is not truly efficient. Investigating the weak-form,Gunduz and
Kaya(2013) is the only study that focuses on the sovereign CDS
markets for 10 Eurozone developed countries. They report that the European CDS market has been efficient even during the recent financial crisis.
In this study we look at the pricing efficiency in its weak-form for a sector the CDS market that has not been covered by previous studies: the emerging sovereign CDS market. Our methodological framework differs from prior studies on the weak-form of the efficiency of the CDS market in two ways. First, prior studies generally estimate a fixed level of market efficiency for the entire sample period. In contrast, we employ a time-varying approach by using rolling samples, giving us the flexibility of not being forced to impose cutoff dates which are usually subject to criticism in em-pirical studies. Second, we employ a relatively new methodology,
permutation entropy, introduced byBandt and Pompe(2002). This
methodology, has several advantages over the methodologies used in prior studies.
We find that emerging sovereign CDS markets (1) have different degrees of time-varying dependence structures, (2) can be efficient even in crisis episodes and, (3) exhibit a strong negative relation between CDS market efficiency and sovereign risk.
2. Methodology
As noted above, we apply permutation entropy to test for weak-form efficiency. Given the time series of CDS spreads, we first consider market efficiency as a dependency concept and translate the problem of dependency into a symbolic dynamic. Then we use the special entropy measure associated with these symbols to test the dependence present in the time series. This approach
has four advantages as explained bySensoy et al.(2015). First,
the measure depends only on ordinal patterns of time series and since it is unaffected by the data’s volatility, it can detect
non-linear temporal dependence in contrast to autocorrelation.1
Sec-ond, because there is no assumption about the distribution of the data, it has a general applicability compared to the variance ratio
test (Lo and MacKinlay, 1988).2 Third, no moment is required to
apply the methodology to time series. This is relevant because asset returns have been shown to be non-normally distributed and, for some distributions such as the Pareto distribution, the variance is infinite (Rachev et al., 2005). Finally, the test is invariant under monotonic transformation of the data which guarantees that
no information is lost.3 Zunino et al.(2012) and Sensoy et al.
1Autocorrelation is also sensitive to structural breaks such as mean or volatility
shift.
2Moreover, the variance ratio test is asymptotic so that for a finite sample the
sampling distributions of the test statistics is approximated by its limiting distri-bution.Lo and MacKinlay(1989) find that for small samples the null distribution is right skewed and under rejects in the left tail.
3Another alternative way to test the weak-form efficiency is using theHurst
(1951) parameter. However,Bassler et al.(2006) have recently shown that the estimation of the Hurst parameter alone cannot be used to determine the efficiency of markets. They showed that there are cases that are perfectly consistent with Markov processes when Hurst parameters H̸=0.5.
(2015) apply permutation entropy in testing the efficient market
hypothesis.
In this section, in describing our methodology we mainly follow the work ofMatilla-Garcia and Marin(2008). Let
{
Xt}
t∈Ibe areal-valued time series. For a positive integer m
≥
2, Smdenotes thesymmetric group of order m
!
(i.e. the group formed by all thepermutations of length m). Let
π
i=
(i1,
i2, . . . ,
im)∈
Sm. Anelement
π
iin the symmetric group Smis called a symbol, and mis usually referred to as the embedding dimension.
Now we define an ordinal pattern for a symbol
π
i=
(i1,
i2,
. . . ,
im)∈
Smat a given time t∈
I. For this purpose, we consider that the time series is embedded in an m-dimensional space as Xm(t)=
(Xt+1,
Xt+2, . . . ,
Xt+m) for t∈
I. Then, it is said that ‘‘t is ofπ
i type’’ if and only ifπ
i=
(i1,
i2, . . . ,
im) is the uniquesymbol in the group Smsatisfying the two following conditions:
(1) Xt+i1
≤
Xt+i2≤ · · · ≤
Xt+im and (2) is−1≤
isif Xt+is−1=
Xt+is.The second condition guarantees uniqueness of the symbol
π
i. This is justified if the values of Xt have a continuous distribution so that equal values are uncommon, with a theoretical probability of occurrence of 0.Notice that for all t such that t is of
π
i-type, the m-history Xm(t)is converted into a unique symbol
π
i. Thisπ
i describes how theordering of the dates t
+
0<
t+
1< · · · <
t+
(m−
1) is converted into the ordering of the values in the time series under scrutiny.Also, given a time series
{
Xt}
t∈Iand an embedding dimension m, one could easily compute the relative frequency of a symbolπ ∈
Smbyp(
π
):=
pπ=
#{
t∈
I|
t is ofπ
-type}
|
I| −
m+
1where
|
I|
denotes the cardinality of set I. Under this setting, the permutation entropy of a time series{
Xt}
t∈I for an embedding dimension m is defined as the Shannon’s entropy of the m!
distinct symbols as the following:h(m)
= −
∑
π∈Sm
pπln(pπ)
.
Permutation entropy h(m), is the information contained in
com-paring m consecutive values of the time series. By definition, 0
≤
h(m)
≤
ln(m!
) where the lower bound is achieved for an increasing or decreasing sequence of values, and the upper bound for acom-pletely random system where all m
!
possible permutations appearwith the same probability. More simply, higher permutation en-tropy means that the data-generating process is more complex and unpredictable. If a financial time series has a permutation entropy that is significantly low, it implies market inefficiency because the weak-form of market efficiency suggests the unpredictability of future movements for the financial variables (In our analysis,
we normalize the permutation entropies (dividing by ln(m
!
)) toachieve a maximum level of 1). 2.1. Independence test
Matilla-Garcia and Marin (2008) developed a consistent test of independence by using permutation entropy. Accordingly, let
{
Xt}
t∈I be a real-valued time series with|
I| =
T , and h(m) de-notes the permutation entropy of this series for a fixed integer embedding dimension m>
2. If{
Xt}
t∈I is i.i.d., then the affinetransformation G(m) of the permutation entropy, G(m)
=
2(T−
m
+
1)(ln(m!
)−
h(m)), is asymptoticallyχ
m2!−1distributed. Then to test the null hypothesis that{
Xt}
t∈Iis i.i.d., the decision rule at100(1
−
α
)% confidence level is to accept the null hypothesis if0
≤
G(m)≤
χ
m2!−1,α, otherwise reject the null hypothesis. Later,Lopez et al.(2010) show that the identicalness property in the null hypothesis can be dropped.
The only point left to decide upon is the embedding dimension m in order to compute permutation entropy and therefore to calculate the G(m) statistic. According toMatilla-Garcia and Marin
(2008), for a given data set of T observations, the embedding di-mension should be selected as the largest m that satisfies 5m
! ≤
T .3. Data
Our sample set, obtained from Bloomberg Financial Markets, covers the daily 5-year sovereign CDS spreads in US dollar terms (from January 5, 2004 to March 18, 2016) for the 15 emerging market countries (five Latin American, five Asian, and five EMEA
countries) shown inTable 1. The starting point of the dataset is
the earliest date that all CDS spreads were being calculated for the selected countries. Daily changes of each country’s CDS spread is calculated as log-returns.
4. Results
We start by choosing a four-year (1,009 observations) time window (that shifts 5 points at a time) since it corresponds to the duration of a general political cycle and it is large enough to provide satisfactory statistical significance. The procedure is as follows. We calculate permutation entropy in each window for the corresponding time series. Then, we call a window ‘‘significant’’ if the null hypothesis of independence is rejected. The rolling-window approach reveals how often the null hypothesis is rejected by the selected test statistic, and hence the percentage of sub-samples with an insignificant test statistic (which we call the efficiency ratio) can be used to compare the relative efficiency of the CDS markets studied. (A similar rolling-window technique is used to test for market efficiency bySensoy et al.(2015) for the equity markets.)
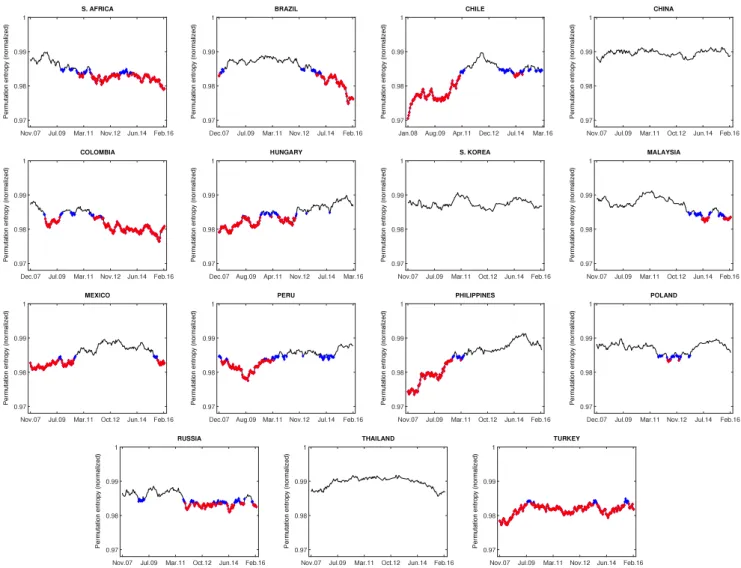
Fig. 1 displays time-varying permutation entropy for each CDS market. In the figure, blue and red markers represent the rejection status of the null hypothesis of independence at 5% and 1% significance levels respectively. The date on the horizontal axis stands for the end of the sample used in the estimation of permutation entropy. Therefore, for a date November 2007, the permutation entropy was evaluated for the sample beginning with 1,009 observations earlier and ending in November 2007 and so forth. We see that the emerging sovereign CDS market has different degrees of time-varying dependence. For example, the dependence level of Brazil, Chile and Philippines CDS markets are more volatile than others. On the other hand, China and South Korea CDS markets have fairly stable dependence levels.
Another important finding that can be observed fromFig. 1is
that CDS markets can be efficient even in the crisis period as in the case of China, South Korea, Malaysia, Thailand, and Poland. These markets are the ones with the highest efficiency ratios reported in Table 1. Hence, we can deduce that an economic crisis may not necessarily affect the market efficiency adversely. Based on log-returns and a four-year rolling window, the third and fourth
columns inTable 1 shows the relative efficiency performances
according to the previously introduced concept of efficiency ra-tios at the 1% and 5% significance levels. For both significance levels, Thailand, China, and South Korea are the most indepen-dent/unpredictable CDS markets and South Africa, Colombia and Turkey are the most dependent/predictable CDS markets. Interest-ingly, with the exception of Poland, top five CDS efficient countries are Asian countries.
We also see that the first five countries with the highest
effi-ciency ratio in the third and fourth columns inTable 1(Thailand,
China, South Korea, Malaysia, and Poland) have the least daily average CDS levels during the sample period (98, 70, 85, 89 and 91 bps relatively), which means that these countries have the
least sovereign default risk. Turkey, being the last ranked in the table (highly predictable), has the highest daily average sovereign default risk (233 bps) among emerging markets included in the study. We investigated this further by estimating the Pearson (Spearman rank) correlation between average CDS scores and the corresponding efficiency ratios. We found that these correlations are
−
0.71 (−
0.58) and−
0.68 (−
0.53) for 1% and 5% efficiency sig-nificance levels respectively. Both correlations are significant at the 1% level, strongly suggesting that there is a strong negative relation between sovereign risk and CDS market efficiency. This finding is further supported by the following observations: The countries with the most weak-form efficient sovereign CDS markets in our sample, such as Thailand, China, South Korea, and Malaysia, have the highest current account surplus averages in the period of 2010 to 2016 (3.94%, 2.36%, 5.03%, and 5.63% respectively), whereas countries that have the least weak-form efficient sovereign CDS markets, such as South Africa, Colombia and Turkey, have the highest average current account deficits in the sample during the same period (−
3.96%,−
4.04%, and−
5.59% respectively). A similar picture arises in terms of savings ratio (savings/GDP) during the same period. Besides, Turkey and South Africa are members of ‘‘fragile five economies’’.Selection of window length is important when using a rolling-window framework because its selection may significantly affect the results. For this reason, we repeated the analysis in order to see if window length matters by using a shorter (3 years with 756 data points) or a longer (6 years with 1513 data points) window
length. Table 1 shows the new efficiency ratios for these two
window lengths. The results of both the three-year and six-year rolling window frameworks indicate that although there are some quantitative differences from the results presented for the four-year rolling window, the qualitative conclusion is very similar. Although there are some changes in the predictability ranking of some countries, the countries that can be classified as least predictable and most predictable are almost the same.
4.1. Alternative approach
In this subsection, we statistically compare the means of the permutation entropies generated by the four-year length rolling-windows in the previous analysis. The rolling-window procedure produces a collection of permutation entropy values, therefore there is a mean permutation entropy for each CDS market in our analysis. Since higher permutation entropy means that the data-generating process is more unpredictable, then a non-parametric statistical mean permutation entropy comparison between CDS markets can give us an alternative view about their predictability. In this case, the CDS market with a statistically significantly higher mean permutation entropy value is considered as less predictable. And, if there is no statistical difference between their mean per-mutation entropy values, we can confirm that there are some cases where efficiency performances of CDS markets are almost indistinguishable.
Different from the previous efficiency ratio approach, we also take the actual estimated permutation entropy values into account with this mean comparison methodology. Therefore, the results of
this subsection and Section4are complementary.Fig. 2shows the
mean permutation entropy comparison between the CDS markets investigated. Based on the results presented inFig. 2, we can assign the countries to four groups, from least predictable to the most predictable as follows: low predictable group (Thailand and China), low-to-mid predictable group (South Korea, Malaysia and Poland), mid-to-high predictable group (Brazil, Mexico, Philippines, Peru, Russia, Hungary and Chile), and high predictable group (Colom-bia, South Africa, and Turkey). This result confirms the findings
presented in the second and third columns inTable 1, as well as
indicating that efficiency performance of some emerging sovereign CDS markets are almost distinguishable.
Fig. 1. Time varying normalized permutation entropies for each CDS log-return series. Blue and red markers denote the rejection of independence in series at 5% and 1%
significance levels respectively. (For interpretation of the references to colour in this figure legend, the reader is referred to the web version of this article.)
Table 1
Average CDS (bps) and the efficiency ratios of emerging country CDS markets based on log-returns and GARCH(1,1) filtered returns.
Country Avg. CDS 4-year window (log) 3-year window (log) 6-year window (log) 4-year window (GARCH) 1% level 5% level 1% level 5% level 1% level 5% level 1% level 5% level Thailand 97.53 1.000 1.000 1.000 1.000 1.000 1.000 1.000 1.000 China 69.64 1.000 1.000 1.000 1.000 1.000 1.000 1.000 1.000 South Korea 84.65 1.000 1.000 1.000 1.000 1.000 1.000 0.984 0.820 Poland 91.36 0.975 0.865 0.933 0.760 1.000 0.993 0.939 0.903 Malaysia 88.58 0.888 0.756 0.883 0.779 0.904 0.836 0.930 0.825 Brazil 214.52 0.736 0.634 0.734 0.614 0.770 0.618 0.764 0.514 Russia 200.18 0.684 0.470 0.825 0.667 0.509 0.321 0.759 0.620 Peru 165.44 0.656 0.442 0.656 0.577 0.400 0.176 0.716 0.423 Mexico 118.75 0.644 0.579 0.718 0.560 0.855 0.681 0.715 0.580 Philippines 210.61 0.633 0.568 0.625 0.518 0.500 0.473 0.663 0.447 Chile 74.05 0.563 0.366 0.504 0.328 0.552 0.313 0.648 0.455 Hungary 202.30 0.556 0.444 0.685 0.478 0.484 0.331 0.586 0.395 South Africa 153.02 0.507 0.329 0.656 0.496 0.288 0.276 0.526 0.263 Colombia 185.73 0.380 0.282 0.515 0.311 0.152 0.079 0.250 0.079 Turkey 232.88 0.089 0.000 0.363 0.083 0.000 0.000 0.112 0.014
4.2. Results using GARCH filtered returns
A stylized fact that has been observed for financial market returns is that they exhibit volatility clustering (Rachev et al., 2005). CDS markets returns in our study exhibit the same behavior.
Matilla-Garcia and Marin(2008) noted that the existence of the ARCH effect in the data may reduce the statistical power of the permutation entropy test. In order to overcome this problem, we
repeat our analysis in Section4by using GARCH (1, 1) filtered
returns. In particular, we estimate the following model: rt
=
µ+ε
t, where rt= [
r1,t, . . . ,
rn,t]
′ is the vector of n CDS returns,µ
is a vector of constants with length n, andε
t=
[
ε
1,t, . . . , ε
n,t]
′ is the vector of residuals. Following that, we get the conditional volatilities hi,t from univariate GARCH(1,1) process h2i,t=
ω +
αε
2i,t−1
+
β
h2i,t−1. Consequently, we implement the permutation entropy methodology on the standardized residuals ui,t=
ε
i,t/
hi,t.Fig. 2. Non-parametric mean comparison between the permutation entropies of
CDS markets. Circles (i.e. their projections onto the horizontal axis) denote the mean permutation entropy values of the corresponding market. Solid bars passing through the circles determine the 95% confidence interval for the mean permutation entropies.
The last two columns inTable 1show the efficiency ratios based on the standardized return series. Although there are slight changes in the ranking of some countries (compared to the third and
fourth columns ofTable 1), the conclusion is almost the same:
Thailand, China, South Korea, Malaysia, and Poland being the least predictable CDS markets; South Africa, Colombia and Turkey are the most predictable ones.
5. Conclusion
The efficiency of financial markets has always been on the agenda of investors, policy makers, regulators, and researchers. Our study is the first to study the pricing efficiency of the sovereign CDS market for developing countries. Employing permutation en-tropy combined with an independence test, we test for the weak-form of market efficiency for 15 sovereign CDS markets of emerg-ing countries. By adoptemerg-ing a time-varyemerg-ing approach, weak-form efficiency of the daily CDS of these 15 countries are investigated from early 2004 to mid 2016. There are four principal findings.
First, we find that degree of dynamic efficiency varies among CDS markets. This finding supports the idea that time-varying models might be considered as superior to static approaches in efficiency analysis. Second, CDS markets can be efficient even in the crisis periods, indicating that adverse effects of financial crises on CDS market efficiency can be limited or non-existent at all. Third, we find that CDS markets of all Asian countries in our sample, as well as Poland, perform better in terms of market efficiency. Finally, we find that there is a strong negative linear and rank correlation between a country’s sovereign CDS efficiency and the daily average CDS levels. Accordingly, default risk of a sovereign debt can be an important factor impacting the pricing efficiency of its CDS market.
References
Avino, D., Nneji, O., 2014. Are CDS spreads predictable? An analysis of linear and non-linear forecasting models. Int. Rev. Financ. Anal. 34, 262–274.
Bandt, C., Pompe, B., 2002. Permutation entropy — a natural complexity measure for time series. Phys. Rev. Lett. 88, 174102.
Bassler, K.E., Gunaratne, G.H., McCauley, J.L., 2006. Markov processes, Hurst expo-nents, and nonlinear diffusion equations: With application to finance. Physica A 369, 343–353.
Fama, E.F., 1970. Efficient capital markets: A review of theory and empirical work. J. Finance 25, 383–417.
Gunduz, Y., Kaya, O., 2013. Sovereign default swap market efficiency and country risk in the eurozone, Bundesbank Discussion Paper, vol. 8.
Hurst, E.H., 1951. Long term storage capacity of reservoirs. Trans. Am. Soc. Civil Eng. 116, 770–808.
Jenkins, N.T., Kimbrough, M.D., Wang, J., 2016. The extent of informational efficiency in the credit default swap market: Evidence from post-earnings announcement returns. Rev. Quant. Finance Account. 46, 725–761.
Kiesel, F., Kolaric, S., Schiereck, D., 2016. Market integration and efficiency of CDS and equity markets. Q. Rev. Econ. Finance 61, 209–229.
Lo, A.W., MacKinlay, A.C., 1988. Stock market prices do not follow random walks: Evidence from a simple specification test. Rev. Financ. Stud. 1, 41–66. Lo, A.W., MacKinlay, A.C., 1989. The size and power of the variance ratio test in finite
samples: A Monte Carlo investigation. J. Econometrics 40, 203–238.
Lopez, F., Matilla-Garcia, M., Mur, J., Marin, M.R., 2010. A non-parametric spatial independence test using symbolic entropy. Reg. Sci. Urban Econ. 40, 106–115. Matilla-Garcia, M., Marin, M.R., 2008. A non-parametric independence test using
permutation entropy. J. Econometrics 144, 139–155.
Rachev, S.T., Menn, C., Fabozzi, F.J., 2005. Fat-tailed and Skewed Asset Return Dis-tributions: Implications for Risk Management, Portfolio Selection, and Option Pricing. Wiley, Hoboken, NJ.
Sensoy, A., Aras, G., Hacihasanoglu, E., 2015. Predictability dynamics of Islamic and conventional equity markets. N. Am. J. Econ. Finance 31, 222–248.
Zhang, G., Zhang, S., 2013. Information efficiency of the US credit default swap market: Evidence from earnings surprises. J. Financ. Stab. 9, 720–730. Zunino, L., Bariviera, A.F., Guercio, M.B., Martinez, L.B., Rosso, O.A., 2012. On the