Genetic Circuits To Detect Nanomaterial Triggered Toxicity through
Engineered Heat Shock Response Mechanism
Behide Saltepe,
†,‡Eray Ulaş Bozkurt,
†,‡Nedim Hacıosmanoğlu,
†,‡and Urartu Özgür Şafak Şeker
*
,†,‡†UNAM−Institute of Materials Science and Nanotechnology, National Nanotechnology Research Center, Bilkent University, 06800
Ankara, Turkey
‡Institute of Materials Science and Nanotechnology, Bilkent University, 06800 Ankara, Turkey
*
S Supporting InformationABSTRACT: Biocompatibility assessment of nanomaterials has been of great interest due to their potential toxicity. However, conventional biocompatibility tests fall short of providing a fast toxicity report. We developed a whole cell based biosensor to track biocompatibility of nanomaterials with the aim of providing fast feedback to engineer them with lower toxicity levels. We engineered promoters of four heat shock response (HSR) proteins utilizing synthetic biology approaches. As an initial design, a reporter coding gene was cloned downstream of the selected promoter regions. Initial results indicated that native heat shock protein (HSP) promoter regions were not very promising to generate signals with low background signals. Introducing riboregulators to native promoters eliminated unwanted background signals almost entirely. Yet, this approach also led to a decrease in expected sensor signal upon stress treatment. Thus, a repression based genetic circuit, inspired by the HSR
mechanism of Mycobacterium tuberculosis, was constructed. These genetic circuits could report the toxicity of quantum dot nanoparticles in 1 h. Our designed nanoparticle toxicity sensors can provide quick reports, which can lower the demand for additional experiments with more complex organisms.
KEYWORDS: nanotoxicity, nanomaterial triggered toxicity, heat shock response, synthetic biology, whole-cell biosensors
C
ytotoxicity and biocompatibility assessment are the crucial steps during the development of new biomaterials. For any clinical use, such evaluation is required in order to have a better understanding, and prevention of possible complications may be caused by newly developed materials in patients. In order to perform such assessments, many methods have been developed. There are mainly three approaches to assess toxicity: (i) analytical methods, (ii) in vitro, and (iii) in vivo models. Among them, analytical methods such as flow cytometry, mass spectrometry, and other spectroscopic and microscopic techniques are efficient and reliable. Yet, they are expensive and require high degree of expertise.1Thus, in vitro and in vivo models are mostly preferred. However, there is an ongoing need for a cytotoxicity test with high degree of speed and reliability.2 The International Organization for Stand-ardization (ISO) defines three types of in vitro cytotoxicity test in ISO 10993−5.2MTT assay is the most widely used and a colorimetric assay based on reduction of yellow MTT to purple formazan by mitochondrial dehydrogenase activity. Thus, the color change indicates cell’s activity instead of cytotoxicity causing several false-positive results in many cases.2−4 Furthermore, it requires specific equipment and chemicals to test toxicity, making it relatively expensive and time-consuming (3−5 days for cell culture period and 4−6 h for toxicity assessment).5 Agar overlay method can also beused to evaluate toxicity to visualize the destruction of cells caused by toxicant via electron microscopy. This method is easier to apply; however, it requires expensive tools (i.e., special facility equipped with a proper electron microscopy) and considerably longer times.2 Direct contact method is used to track morphological changes of cells upon toxicant treatment, which requires specific equipment and higher expertise.2,6 However, toxicity testing of nanoparticles (NPs) has specific challenges. Their small size results in greater surface-to-volume ratio, and therefore higher biological reactivity causing stress response,7−9reactive oxygen species (ROS) generation,7,8and DNA damage response.7Furthermore, other unique properties such as high adsorption, hydrophobicity, surface charge, and catalytic activities can interfere with conventional methods. Guadagnini et al. used six NPs with different properties and tested with conventional in vitro assessment methods, inflammatory response, and oxidative stress methods and showed that NPs interfere with many of the tests used (WST-1, MTT, lactate dehydrogenase, neutral red, propidium iodide, 3H-thymidine incorporation, ELISA for inflammatory re-sponse, monobromobimane, dichlorofluorescein, and NO assays for oxidative stress).10 As an alternative, many model
Received: July 12, 2019
Published: September 19, 2019
pubs.acs.org/synthbio Cite This:ACS Synth. Biol. 2019, 8, 2404−2417
organisms including daphnia,11 algae,12 zebrafish,13−15 mice,16,17and monkeys17 are also employed to test NPs. To develop a fast-acting toxicity assessment method, the choice of an appropriate model organism is vital, and using micro-organisms, either prokaryote or eukaryote, has significant advantages over higher eukaryotes. Due to their higher growth rate, microorganisms can ensure sufficient biomass, which will lead to a considerable amount of reporter signal in shorter times. Moreover, microorganisms are easier to handle and manipulate. Most importantly, the motivation behind utilizing microorganisms is to assess possible toxicity prior to more complex, expensive, and time-consuming experiments and trials including higher eukaryotes such as mice, monkeys, and humans.18On the other hand, in general, in vivo studies require special model organisms (daphnia,11 algae,12 zebrafish,13−15 mice,16,17 or monkeys17) and utilize indirect measure of toxicity (i.e., mortality rate, swimming speed, and body length measurements are examined in zebrafish.).12−15 In addition, they need longer periods of time to report toxicity.11,14 Development of biosensor-based assays became a promising solution to overcome most of the above-mentioned problems since they are relatively fast, cheap, and easy-to-use. In early stages, luminescent bacterial toxicity assays (LBTAs), such as Microtox, have been utilized to assess mostly environmental toxicity. Later, these systems were criticized due to hormesis effect, stimulation of luminescence from tested chemicals, and false positive results. Therefore, these systems were lacking in precision and specificity, and problematic in application.19 Later, semispecific biosensors utilizing stress regulators were developed to detect toxicity, and heat shock protein (HSP) promoters were the most commonly used elements in these studies.20−23Although they brought a new perspective to the field, a gap remains to be fulfilled by a quantitative assay with a high degree of speed and low leakage. Thus, synthetic biology approaches can compensate the need for more developed biosensors by employing heat shock response (HSR) elements to detect toxicity.
Heat shock mechanism is a universal process exhibited by cells to any kind of stress such as heat, osmotic stress, chemicals, ions, or nanomaterials (NMs).24 Several tran-scriptomic analyses indicate that exposure to any stress agent, especially to toxic compounds, prompts changes in gene expression profile, specifically genes related to stress response,7−9 reactive oxygen species (ROS) metabolic processes,7,8 DNA damage response,7 and cell redox homeo-stasis.7 In order to maintain cellular integrity and survival, nanomaterial exposure (i.e., silver nanoparticles (NPs),25silica NPs,26 quantum dots (QDs),27 or carbon nanotubes28) triggers the production of a set of HSPs.29 The HSPs are a subgroup of molecular chaperones: accessory proteins that manage mechanisms crucial for the cell survival and maintenance including protein folding and assembly mecha-nisms.30Some chaperones such as Hsp60, Hsp70, and Hsp90 cope with misfolded proteins to refold them properly,31while others, such as ClpB (or its eukaryotic homologue Hsp104), Lon, and HtrA degrade protein aggregates in cells.32,33 Although HSR is controlled differently in many organisms, some of the chaperones play a common role in different organisms like Hsp70, which is the major stress related chaperone protein in bacteria as well as in eukaryotes.
In Escherichia coli, main HSR is conducted by DnaK (Hsp70)-DnaJ (Hsp40)-GrpE machinery. Unlike many tran-scription mechanisms in E. coli, HSPs are not regulated byσ70
factor, a universal subunit of RNA polymerase. Instead, HSPs are controlled by a special stress-inducible subunit, namely,σ32 factor, encoded by rpoH gene.30,34 Under normal growth conditions,σ32level is maintained at constant levels due to its unstable nature; however, after exposure to any stress,σ32level is dramatically elevated via improved stability as well as increased synthesis.30,35,36 σ32 is regulated by a negative feedback loop controlled by a DnaK-DnaJ-GrpE mechanism.37 Accumulation of chaperones in this mechanism holdsσ32and blocks its activity,38,39leading to degradation ofσ32by FtsH, a specialσ32degrading protease.40
Therefore, monitoring of HSP levels in cells can be used as a promising stress indicator of heavy metals and newly developed nanomaterials.
Detection of heavy metal toxicity41−43 and other toxic compounds44through HSR mechanism is a quick and more straightforward way to evaluate negative effects caused by different stress agents.20
Many HSP promoters9,21,45 such as dnaK, grpE, clpB, or fxsA have been studied in the literature with different reporter genes such as gfp,20,22,46,47 lacZ, or lux41,44,46,48,49 to detect the stress response caused by pollutants and many chemicals. Cha et al. designed GFP-based biosensors by fusing promoter elements ofσ32, clpB and dnaK to the upstream of the reporter to detect cellular stress caused by heat and ethanol. They observed the maximum response at eighth hour after stress exposure.20Similarly, Seo et al. utilized 2 h of heat shock treatment for HSR induction with the same approach (σ32, clpB, and dnaK promoters fused with reporter), and similar results were observed.21 In another study, grpE promoter was fused to fluorescence reporter and ethanol was used as inducer. The study concluded that fluorescence signal was not significant in short period of time (90th min), and 10th hour of fluorescence signal was significant enough due to reporter accumulation to make an assessment.46 Martinez et al. utilized four stress promoters (katG for oxidative stress, dnaK for protein damage, fabA for membrane damage, and recA for DNA damage) and treated these sensors with specific stressors (H2O2, ethanol, SDS, and mitomycin, respectively). Stress sensor with dnaK showed less than 2-fold response in 2 h.50 Although these biosensors eliminated high cost and provided easy usage, they were inadequate in shortening the response time and preventing false positive signal. After the development of advanced synthetic biology tools, many opportunities arose to redesign and optimize existing mechanisms. Thus, applying synthetic biology approaches allows construction of different biosensors with complex genetic circuits51to detect analyte of interest52,53 (i.e., heavy metal exposure). In this manner, a biosensor circuit coupled with HSP promoters and a reporter is one of our objectives to detect stress response of cells caused by NM-triggered toxicity.
Nanomaterials and nanoparticles are of great interest for their wide range of applicability across many areas from medicine to optoelectronics. They have size-dependent tunable optical and physical properties, which are not usual for bulk materials.54−56NMs are widely used in innovative applications such as in medical diagnostics, drug delivery, and targeted photothermal therapy, which necessitates patient interaction with NMs.57Also, utilization of NMs in consumer goods may contaminate environment, food, and textiles.58NMs have high surface-to-volume ratio, which makes them desirable elements for many chemical reactions or self-assembly applications. Despite their success in many applications, the small size of NMs makes them able to penetrate through cellular barriers
easily; besides, their high surface-to-volume ratio opens a room for causing cellular stress. Furthermore, stress caused by NMs in cells might provoke protein unfolding,59DNA damage,60,61 ROS generation,62−64and disruption of gene expression60,61,65 leading potential health problems. The relation between toxicity and surface-to-volume ratio has also a critical effect on membrane passage. As the size of the NMs decreases, the ratio of NMs passing the membrane increases, eventually causing many stress related problems summarized above. Additionally, defects on NMs increase the surface area of NMs, which facilitates protein corona formation through adsorption of molecules in the cellular environment (i.e., proteins like serum albumin, immunoglobulin,fibrinogen, etc.) on NMs via several forces such as hydrogen bonds or van der Waals interactions.59This process may cause blocking of membrane pores, leading starvation and cell death.66At the system level, NMs can trigger inflammation and alter immune system response.67−69
Recently, a few efforts have been made in order to assess toxicity of QDs by employing different organisms such as daphnids,11algae,12and zebrafish, which is the most common model organism in QD toxicity studies.13−15 In these experiments, indirect quantitative methods, such as mortality
rate for daphnids11 and swimming speed, heartbeat, or body length for zebrafish15
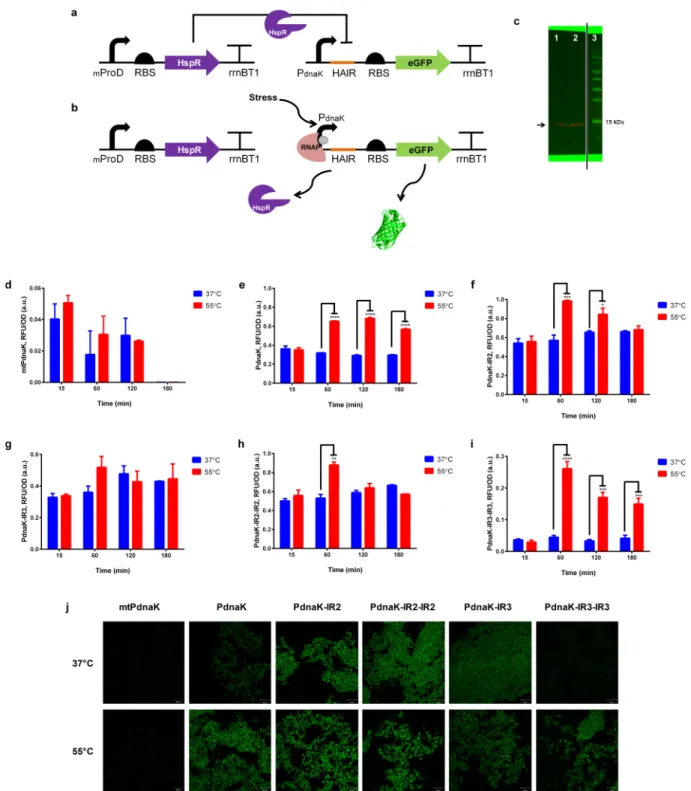
have been used. Also, such methods require days to make a comment on toxicity of particular QDs and the measurements may not reflect a dose-responsive analysis. On the other hand, although QD toxicity has been analyzed with viability assays, microscopy, microcalorimetry, growth inhibition, membrane damage assessments, and transcriptomic analysis in bacteria, there is no HSR sensor-based toxicity evaluation of NM-triggered toxicity.63,70−72 Thus, development of a quick, dose-responsive and cheap sensor system that reports NM-triggered toxicity is very critical to monitor biocompatibility of NMs prior tofield application. In this work we have demonstrated the utilization of engineered HSR mechanism as a powerful candidate to build ordered genetic circuits to report NM-triggered toxicity. Unlike recent reports utilizing HSR mechanism as stress indicating biosensors, we integrated promoter engineering strategies (i.e., modifications of HSP promoters with riboregulators and repressor binding sequences from HSR of Mycobacterium tuberculosis) to obtain optimum signal upon stress. Thus, compared with in vitro or in vivo toxicity tests, a fast-acting biosensor responding NM-triggered toxicity has been aimed. This initial data can be used as a feedback to engineer or Figure 1.Fluorescence signal results of initial stress sensors and riboregulator-mediated stress sensors. (a) Representative plasmid map of stress sensors with native HSP promoters. A reporter (gf p) is expressed under the control of heat shock promoters: dnaK, clpB, fxsA, or ibpA. (b) Representative plasmid map of stress sensors with engineered riboregulators. Both taRNA and crRNA are controlled by the same HSP promoter. (c) Working mechanism of engineered riboregulators. In the absence of taRNA, reporter expression is blocked by crRNA with a loop formation. However, taRNA favorably forms a complex with crRNA, which makes RBS free so that gene expression starts. Fluorescent signal results of heat treated toxicity sensors with native HSP promoters and their riboregulator-mediated constructs for PdnaK(d), PclpB (e), PfxsA(f), and PibpA(g)
circuits. Experiments were performed as three biological replicates in different days. Heat shock was applied at 55 °C water bath for 30 min, and control samples were kept at 37°C. Sensors with native HSP promoters and sensors with riboregulators in each group were normalized between each other based on formula stated in theMaterials and Methodssection. p≤ 0.0001 is represented with four stars, while statistically nonsignificant results have no stars. (h) Representativefluorescent microscopy images of sensors at 60 min after heat treatment. Each column represents stress sensors with HSP promoter (left) and its riboregulator-mediated construct (right) (PdnaK, PclpB, PfxsA, and PibpA, respectively). Each row indicates 37
and 55°C heat treatment after 60th min, respectively. Scale bar indicates 20 μm.
modify the toxic NMs to make them biocompatible before human contact. This study aims to construct a NM-triggered toxicity sensor in order to evaluate biocompatibility of NMs to
provide quick feedback for further engineering strategies and to make the sensor rapid, tightly controlled, easy-to-use, and cheap.
Figure 2.Heat shock response of repressor mediated circuits. Working principle of HspR is shown in (a) and (b). At normal growth conditions, constitutively expressed HspR recognizes specific sequences on promoter region blocking the gene expression (a), while releasing those specific sequences upon stress exposure initiating gene expression (b). (c) Western Blot results for HspR expression. HspR expression from uninduced (1) and induced (2) E. coli BL21 (DE3) cells carrying T7-HspR-pET22B expression vector were shown at∼14 kDa. PageRuler Prestained Protein Ladder (3) (Thermo Fisher Scientific) was used as reference. Image generated by Chemidoc (BioRad) Imaging System. Fluorescence signal results of repressor-mediated stress sensors with mtPdnaK(d), PdnaK(e), PdnaK‑IR2(f), PdnaK‑IR3(g), PdnaK‑IR2‑IR2(h), and PdnaK‑IR3‑IR3(i). Experiments were
performed as three biological replicates in different days. Heat shock was applied at 55 °C water bath for 30 min, and control samples were kept at 37°C. Fluorescence intensity of each group was compared with each other and normalized according to formula stated in theMaterials and Methodssection. p≤ 0.05, p ≤ 0.01, p ≤ 0.001, and p ≤ 0.0001 are represented with one, two, three, and four stars, respectively. Statistically nonsignificant results have no stars. (j) Representative fluorescent microscopy images of repressor mediated stress sensors at the 60th min after heat treatment. Each column represents different modifications of promoters (mtPdnaK, PdnaK, PdnaK‑IR2, PdnaK‑IR2‑IR2, PdnaK‑IR3, and PdnaK‑IR3‑IR3,
respectively). Each row indicates 37 and 55°C heat treatment after 60 min, respectively. Scale bar indicates 20 μm.
■
RESULTS AND DISCUSSIONConstruction and Characterization of Initial Stress Sensors. Selection of a proper promoter is crucial in whole cell biosensor studies since reporter expression rate highly depends on promoter strength. HSR pathway offers many promoter options with varying strengths from very low to high expression level. We chose HSP promoters which show moderate or high expression levels in response to heat induction.9 Among them, we considered following HSP promoters which were characterized in previous studies namely: dnaK,9,20,21,45 clpB,20,21,45 fxsA,9 and ibpA.9 Initial stress sensor circuits (Figure 1a) were constructed with these highly stress-inducible HSP promoters controlling the expression of a reporter (gf p). Before toxicity assessment, we characterized all constructed circuits with elevated heat stress, the main stressor of HSR mechanism. Also, we aimed at finding the best performing promoter between the selected ones so that we could fully characterize the most promising stress sensor candidate afterward.
The native HSP promoters are active in cells while the cells are growing. To be able to make a significant comparison, the 15th min following heat induction was used as the starting point. This allows us to eliminate any errors due to the delay in sampling and measurements. In general, reporter expression reaches its maxima at 1 h after heat induction at 55°C for 30 min, and the signal decreases afterward (Figure 1). Previous studies have reported that cells start adapting themselves to the environment and decreasing σ32-dependent gene expression. Besides transcription, decrease in translation efficiency might cause a decline in signal accumulation.9 Thus, not only promoters but also RBS strength might be engineered to overcome insufficient signal output.
Among the four initial circuits, the one harboring the clpB promoter region (originally active in the synthesis of the ClpB heat shock protein) did not give a useful signal. However, the rest of the initial circuits gave high signals both in the presence and the absence of the stress condition, which was the elevated temperature. Although ClpB shows similar function with DnaK machinery (preventing aggregation of denatured proteins), its expression is lower at elevated heat conditions.73−75Thus, clpB promoter might not be activated significantly upon heat treatment. Therefore, the increase in the signal upon heat treatment was not significant. On the basis of the high background signal, it was suspected that initial circuits with HSP promoters were leaky. By taking this point into consideration, we engineered them with riboregulators adapted from Isaacs et al.76to prevent any background signal in initial circuits. We modified our initial toxicity sensor circuits with riboregulators to eliminate any leakage that may be caused by HSP promoters (Figure 1b). Isaacs et al. characterized a library of artificial riboregulators to tightly control the gene expression. Working principle of riboregulators has been summarized in Figure 1c: This system employs small noncoding RNAs (sncRNAs) found in cells. At normal growth conditions, one of the sncRNAs, namely, cis-repressing RNA (crRNA), blocks the gene expression with a loop formation on ribosome-binding site (RBS). Upon induction, trans-activating RNA (taRNA) has been expressed to form a complex with crRNA. As a result of crRNA-taRNA complex formation, RBS becomes accessible to ribosome which initiates the gene expression. The riboregulators constructed by Isaacs et al. were coupled with HSP promoters at transcription initiation sites of
toxicity sensors. The test results of the initial circuits with increased heat stress were presented in Figure 1d,1e, 1f, 1g, and riboregulator-modified and nonmodified initial sensor circuits were compared, and representative fluorescent microscopy images were shown in Figure 1h. Riboregulator-mediated toxicity sensors showed a dramatic decrease in background signal, except for clpB promoter as discussed above. Although riboregulators decreased the background signal almost entirely, a significant fold-expression was not observed upon heat treatment. Nevertheless, riboregulator-mediated ibpA promoter showed the best performance compared to the dnaK promoter, clpB promoter, and fxsA promoter upon heat treatment. IbpA protein, in cooperation with IbpB protein, is responsible for inclusion body prevention in cells. It has been shown that IbpA expression increases with elevated heat and in some cases with chemical exposure that causing inclusion body formation under stress.77Elevated heat treatment (55 °C, 30 min) might induce inclusion body formation in cells driving expression from ibpA promoter. Yet, further engineering strategies to increase the sensor signal was required.
A Repressor-Based HSR of Stress Sensors. HSR mechanism varies among prokaryotes. Unlike HSR mechanism in E. coli, M. tuberculosis regulates its HSR mechanism with a special repressor, HspR, synthesized from dnaKJE-hspR operon via a self-controlled feedback mechanism. HspR recognizes specific sequences found in the promoter region called HspR-associated inverted repeats (HAIR) with the assistance of DnaK chaperone and blocks its own operon under normal growth conditions. However, upon stress, HspR and DnaK dissociates from the promoter initiating gene expression.78Additionally, it has been shown that HspR does not require DnaK assistance during HAIR recognition; in particular, DnaK improves binding of HspR on promoter.79 Native HSR system of E. coli has transcription factor working as an activator in the pathway, which may cause high background signal in circuits since these transcription factors are already active in cells at basal level. We proposed that a repression-based sensor design might be a solution to suppress high background signal. This hypothesis led us to design circuits with HSR systems from M. tuberculosis.
In repression-based circuits, we employed a transcription repressor, HspR, found in the HSR pathway of M. tuberculosis,80 to build a hybrid sensor system. We engineered natural E. coli dnaK promoter (PdnaK) with inverted repeat motifs (IR2 and IR3 sequences) of HAIR sequences81 from natural M. tuber-culosis dnaK promoter (mtPdnaK) to construct toxicity sensor circuits. Downstream of PdnaKwas engineered with single and double repeats of IR motifs in one plasmid while HspR was cloned under a constitutive promoter, mproD, and cloned onto another plasmid. Proposed mechanism is to block reporter expression via constitutively expressed HspR under normal growth conditions (Figure 2a) as HspR dissociates from the promoter driving reporter expression upon stress (Figure 2b). A comparison on the repression strengths of HspR on native mtPdnaKcircuits and native PdnaKcircuits have been shown in
Figure 2d,2e. Additionally, recombinant HspR expression in E. coli was demonstrated in Western Blot analysis (Figure 2c). Western blotting showed that even though HspR was not a native protein to E. coli, it could be expressed successfully after codon optimization.
Results confirmed that HspR favorably bound to mtPdnaK promoter region and repressed the gene expression. Yet, unlike
our expectation, heat treatment was not enough to turn on the gene expression completely (Figure 2d). On the other hand, HspR repressed native E. coli PdnaKless favorably compared to its native promoter, mtPdnak. It is proposed that HspR dissociated from promoter upon heat treatment, which led to a 2-fold increase after 60 min (Figure 2e). Comparing the engineered PdnaK sensors with HAIR motifs, single IR motifs showed no or little significant difference in terms of gene expression upon stress exposure (see Figure 2f for IR2 and
Figure 2g for IR3). These results confirmed that HspR favorably repressed the gene expression in the presence of IR2 and IR3 sequences in the circuits. Meanwhile, these sequences might trigger a lower degree of dissociation of HspR from promoter so that gene expression could not begin through stress promoters even though there was a stress as an input. Also, double IR2 repeat indicated the same gene expression pattern with single IR repeats upon heat treatment (Figure 2h). On the other hand, double IR3 repeat significantly enhanced HspR repression of PdnaK blocking the gene expression under normal growth conditions. Data showed the highest HspR repression with the lowest background signal
between HspR-mediated sensors (Figure 2i). Also, upon heat treatment, we observed a 3-fold increase in GFP expression, which was the highest reporter expression-fold compared with other modifications. The data were supported by representa-tivefluorescent microscopy images in Figure 2j.
Besides reporter expression, HspR association with promoter regions has been shown with a gel retardation assay (Supplementary Figure S1) to confirm that HspR could associate all engineered promoters. First, HspR binding on its native promoter (mtPdnaK) was characterized as Bucca et al. described before.82 Further, HspR binding on E. coli DnaK promoter and its modifications with HAIR sequences was shown with native polyacrylamide gel electrophoresis (PAGE). Each promoter regions were isolated by PCR and incubated with and without HspR protein. Results indicated that HspR addition caused retardation of PCR fragment showing an additional retarded fragment (represented by “R” on the figure) on the gel. Thus, background signal reduction due to HspR repression was verified by showing promoter-repressor interaction with the conducted gel retardation assay.
Figure 3.Fluorescence signal results of CdTe QD treated riboregulator-mediated stress sensors with PdnaK(a), PclpB(b), PfxsA(c), and PibpA(d).
Experiments were performed as three biological replicates in different days. 300 nM QD was applied as stress factor. All data were normalized according to formula stated inMaterials and Methods section. p≤ 0.05, p ≤ 0.01, and p ≤ 0.001 are represented with one, two, and three stars, respectively. Statistically nonsignificant results have no stars. (e) Representative fluorescent microscopy images of riboregulator mediated stress sensors at the 60th min after QD treatment. Each column represents different modifications of promoters (PdnaK, PclpB, PfxsA, and PibpA, respectively).
Scale bar indicates 20μm.
As a conclusion, HspR binding on all promoters has been shown blocking the reporter expression at normal growth conditions, where as it has been turned on upon heat treatment. However, all engineered promoters showed di ffer-ent characteristics that might be caused by differffer-ent interaction dynamics with the repressor. Besides, not only can they be repressed equally by the HspR, but also their dissociation behavior differs. Among utilized promoters, it can be concluded that double IR3 sequence plays a strong role in HspR recruitment and turning the promoters ON/OFF. Data supports that the HAIR motifs are good candidates to be used in design of genetic circuits to monitor stress level. HspR toxicity sensors have a lower background signal under normal growth conditions, while gene expression might dramatically increase upon stress.
Sensing the Nanomaterial Triggered Toxicity. QDs are used for many applications such asfluorescent labeling or drug delivery since they exhibit high photostability and are easy to functionalize.83Due to the high demand for the utilization of QDs, we aimed to use them as potential test materials for their toxicity. Testing NMs for their cytotoxicity is a common approach in every synthesis work for biomedicine related applications.84Yet, there is no specific and rapid biosensor to assess toxicity of QDs. Here we are proposing a fast feedback about the NM-triggered toxicity that can be obtained from the whole cell sensor system. Such information can help one to engineer NPs and save a significant amount of time without carrying out complex tests at every step. QDs show toxicity on bacteria through photogeneration and ROS formation. Light induced release of heavy metals from QD surface might Figure 4.Fluorescence signal results of CdTe QD treated HspR mediated stress sensors with mtPdnaK(a), PdnaK‑IR2‑IR2(b), and PdnaK‑IR3‑IR3(c).
Experiments were performed in three biological replicates on different days. 300 nM of QD was applied as stress agent. All data were normalized according to formula stated in theMaterials and Methodssection. p≤ 0.05, p ≤ 0.01, p ≤ 0.001, and p ≤ 0.0001 are represented with one, two, three, and four stars, respectively. Statistically nonsignificant results have no stars. (d) Representative fluorescent microscopy images of each stress sensors at the 60th min after QD treatment were demonstrated. Scale bar indicates 20μm. (e) RT-qPCR analysis for ROS-related sodA gene expression in HspR-mediated PdnaK‑IR3‑IR3sensor induced with CdTe QDs. Experiments were performed as three biological replicates in different days. Samples were collected for RNA isolation at the 60th min after stress treatment. All data were normalized to untreated control sample. p≤ 0.01 is represented with two stars. (f) Fluorescent signal of HspR-mediated PdnaK‑IR3‑IR3sensor treated with 200μM TBHP. Experiments were performed in three biological replicates on different days. All data were normalized according to formula stated in the Materials and Methods
section. p≤ 0.0001 is represented with four stars. (g) RT-qPCR analysis for ROS-related sodA gene expression in of HspR-mediated PdnaK‑IR3‑IR3 sensor treated with 200μM TBHP. Experiments were performed as three biological replicates in different days. Samples were collected for RNA isolation at the 30th min after stress treatment. All data were normalized to untreated control sample. p≤ 0.0001 is represented with four stars.
increase heavy metal ion uptake by cells that cause DNA damage, loosen membrane integrity, interrupt electron transfer chain, or oxidize proteins and lipids in cells.63,83
After characterization of constructed circuits with heat, two sets of selected stress sensors were screened by employing red emitting CdTe QDs to analyze NM-triggered toxicity, as the main motivation was to detect toxicity of NMs. CdTe QDs were selected as representative NMs used for many applications (i.e., fluorescent labeling or drug delivery) in medicine. The first set, riboregulator-mediated sensors, were treated with CdTe QDs and showed a quick stress response right after QD treatment, except for ibpA-mediated sensor (Figure 3). Stress could activate different pathways such as SOS, ROS, and HSR. Yet, not all of the elements in these pathways could be activated by each stress conditions. For instance, elevated temperatures fully activate HSR, but not the oxyR dependent ROS response, or vice versa for H2O2 exposure.85 IbpA, referring to inclusion body binding protein A, is one of the sHSPs playing roles in protein aggregate prevention. It was shown that IbpA expression increases at elevated temperatures, which might lead to aggregation. However, although IbpA responds immediately to heat treatment, it does not respond with the same fashion to all chemicals.86,87 Our result indicated that CdTe QD exposure did not initiate gene expression from PibpA (Figure 3d), but from others (Figure 3a,3b,3c), and a quick and high response was observed in each case independent from the promoter type. The data were supported by representative fluorescent microscopy images inFigure 3e.
Following, we aimed at analyzing the IbpA-mediated sensor working principle at transcription level so that we measured its response to heat as well as to QDs. Using RT-qPCR, a representative set of experiment was carried out. Results showed that gene expression was increased up to 90-fold upon heat treatment (Supplementary Figure S5A), while QD treatment had no dramatic effect compared with untreated control group (Supplementary Figure S5B). The data support that elevated heat treatment has an adverse effect on cells, perhaps causing inclusion body formation.
We also tested growth kinetics of cells upon both heat and QD treatment and observed that both stressors slowed down cell growth compared with the untreated control group (Supplementary Figure S2, S3, S4). However, no detrimental cell death was observed upon QD treatment at the applied concentration, 300 nM. The same observation was also valid for heat treatment at 55°C.
After characterization of the first set, which was riboregulator-mediated stress sensors with QD treatment, a second set with selected HspR-mediated stress sensors was also treated with CdTe QDs. Similarly, they showed quick response to QDs. On one hand, sensor with mtPdnaK(Figure 4a) showed no response, indicating strong repression by HspR that inhibited transcription initiation of the reporter. On the other hand, the sensor with PdnaK‑IR2‑IR2 (Figure 4b) and the sensor with PdnaK‑IR3‑IR3 (Figure 4c) showed dramatic fluorescence increase upon QD treatment. Besides, overall signal upon induction was higher than the riboregulator-mediated sensors, making them good candidates to determine nanotoxicity. Our observations fromfluorescent measurement are supported by representativefluorescent microscopy images inFigure 4d. As we did in riboregulator-mediated sensors, we selected a representative HspR-mediated sensor to analyze gene expression at transcription level with heat and QD
treatment. The sensor showed the highest expression level after heat treatment (Supplementary Figure S5C), while QD treatment indicated lower expression (∼6-fold) compared to heat treatment (∼20-fold) (Supplementary Figure S5D). Yet, sensor response upon QD exposure was notable and significant, making it a good candidate to evaluate terial-triggered toxicity in biocompatibility tests of nanoma-terials.
Further, we expanded the toxicity evaluation of QDs through ROS mechanism since QD exposure activates not only HSR but also other stress related mechanisms such as oxidative stress pathways. E. coli has two oxidative-stress mechanisms: SoxR and OxyR. The former is related with superoxide and nitric oxide sensing and regulation of the related genes (sodA, acnA, nfo, etc.), while the latter is activated by hydrogen- and alkyl hydroperoxide and regulates oxyS, katG, ahpCF, grxA, and gorA expression.88 Thus, HspR-mediated PdnaK‑IR3‑IR3 sensor, as the best nanotoxicity sensor candidate, was selected to evaluate ROS formation upon QD treatment (Figure 4e) and superoxide dismutase (sodA) gene expression was quantified via RT-qPCR after 1 h upon QD treatment. Results indicated that sodA expression increased with QD treatment, showing CdTe QDs caused ROS formation in cells. Since SodA is responsible from superoxide deactivation, results proposed that CdTe QDs led to superoxide radicals in cells, which activated sodA expression up to 3-fold. Furthermore, stress and ROS formation in cells was verified by 200 μM of tert-Butyl hydroperoxide (TBHP), a well-known positive control agent for ROS formation, treatment of cells for 30 min. Sensors with PdnaK‑IR3‑IR3showed bothfluorescence increase indicating HSR activation (Figure 4f), and 12-fold of sodA expression indicating ROS formation (Figure 4g) upon treatment. As a conclusion, HspR-mediated PdnaK‑IR3‑IR3sensor was characterized in terms of HSR and ROS pathway activation upon QD treatment.
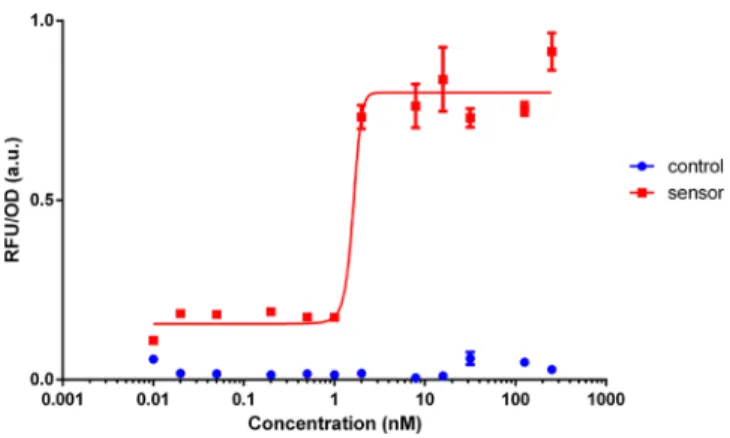
Following QD characterization with selected sensors, we chose HspR-mediated PdnaK‑IR3‑IR3 sensor as potentially to be the best nanotoxicity determinant. Further, we analyzed dynamic range of this sensor via CdTe QD treatment (Figure 5) to determine sensor characteristics of analyte detection (i.e., detection limit). Induction concentrations were selected from 0-to-250 nM of QDs. Results indicated that the toxicity sensor
Figure 5. Dynamic range analysis of selected HspR mediated PdnaK‑IR3‑IR3 sensor treated with CdTe QDs. Experiments were
performed as three biological replicates on different days. Measure-ments were taken at the 60th min after QD treatment. All data were normalized according to formula stated in theMaterials and Methods
section.
could detect the presence of QDs even at lower concen-trations, showing that detection limit of the sensor was very low. Also, as shown by previous studies, QD toxicity is concentration dependent;72,89 thus, higher concentrations of QDs in the media can cause higher cellular uptake or ROS generation. This can trigger higher and faster stress response compared to lower concentrations. Moreover, to demonstrate that QDs do not interfere with the GFP signal, we treated and evaluated constitutively expressed GFP as a positive control (Supplementary Figure S6). These results showed that GFP signal continued increasing even in the presence of higher concentrations of QDs (Supplementary Figure S6A). Also, time-resolvedfluorescence spectroscopy (TRF) measurement indicated that QDs had no effect on GFP quenching (Supplementary Figure S6B). Additionally, reporter of the sensor (GFP) is interchangeable so that one can use different reporter genes in the case of interference of GFP with NM of interest to eliminate possible quenching of the signal.
Toxicity response to NMs is highly depending on cell type and chemical composition. Membrane structure and compo-sition affects nanomaterial uptake through cells. For instance, even Gram negative and Gram positive bacteria do not respond similarly to the same NM since they have different membrane composition. Besides, thinner peptidoglycan layer makes Gram negative cells more vulnerable against nano-toxicity.83Here we demonstrate that our engineered bacterial NM-triggered stress sensors are able to sense and respond accordingly to the stress conditions. Considering that HSR mechanism is common in each cell type, we expect to transfer and modify this bacterial system to other cell types. Still, cell type response might require some further optimization to tune gene expression based on NM concentration and type. However, in general, we propose a whole cell sensor that can produce quick information about the toxicity of the NMs of interest from a global perspective. On the other hand, the proposed sensor does not provide detailed information about the NM-triggered toxicity including its action mechanism at the downstream of pathways of interests.
■
CONCLUSION AND FUTURE PERSPECTIVESRecent developments in nanotechnology accelerated nanoma-terial applications in various fields. Their unique proper-ties54−56such as small size, high surface-to-volume ratio, and catalytic activity make them potentially dangerous to living systems because they have the ability to penetrate through tissues and cells easily.59−65,67−69 Thus, an early diagnostic toxicity assessment procedure is a necessity prior to NM application on living systems as well as on environment. Here we propose synthetic genetic circuits that are capable of sensing early stages of stress caused by NMs using an engineered HSR system.29 In this study, all stress responsive circuits were characterized by exposing the circuit harboring cells to elevated temperatures; later, selected cells were used as the candidate sensors for NM exposure. Stress responsive circuits with mostly expressed native HSP promoters controlling a reporter output, GFP, were found to have a looser control on the expression, and as a result, high background signals were observed. Coupled with a set of synthetic riboregulators, engineered native HSP promoters were found to be more functional as sensing elements. Among the chosen native promoters, PibpApromoter also seemed to be the best performing promoter under stress conditions when coupled with a riboregulator system. The riboregulator we
used prevented leaky protein expression as expected. In addition to the native HSR system in E. coli, we searched for different HSR systems in other bacteria. Interestingly, M. tuberculosis has a repression-based system where E. coli has an activation-based HSR system. Thus, we employed M. tuberculosis HSR mechanism and designed a circuit to sense the NM-triggered toxicity. In this approach, we did not need to employ a riboregulator system as the circuit itself has a repressor based operation preventing high degrees of protein expression leakage. Native HSR system is leaky in terms of synthesizing the HSR proteins, which has biological basis as the cells are continuously bearing stress conditions during growth. A basal level of DnaK protein, for example, is crucial for the cell to keep its proteins functioning. However, for synthetic biology applications, functionality of the cells and engineered circuits should be programmed so that the native/ non-native systems can be adapted for certain needs.
Whole cell sensors have a great potential for numerous future applications such as monitoring NM-triggered toxicity. In general, NM-triggered toxicity is a complex phenomenon. After the NPs enter the bloodstream or interact with the cells, many molecular mechanisms are triggered. However, to track these changes at genome and proteome levels is a labor intensive and costly process. Hence, we believe that our quick reporter systems will provide crucial initial data to make judgments about the level of toxicity. However, one should notice that our proposed circuit design is not tissue or organism specific but gives a general idea if the NM of interest triggers any toxicity. To be more specific about the reasons for the toxicity, specific biomarkers should be identified using genome, transcriptome, or proteome level analysis for each type of NP available with varying surface properties. Such an attempt may have a potential to develop whole cell sensors with complex circuit designs including logic-based operations.
■
MATERIALS AND METHODSMedia and Strains. E. coli DH5α (NEB) was grown in LB medium (1% (w/v) tryptone, 0.5% (w/v) yeast extract, 0.5% (w/v) NaCl) with proper antibiotics at 37 °C and 180 rpm shake in Erlenmeyerflasks. Overnight cultures were prepared from frozen glycerol stocks and incubated for 16 h with the same culturing conditions mentioned previously. 1% of inoculums from overnight cultures were used to start experimental cultures and monitored via spectrophotometer (GENESYS 10 Bio, Thermo Scientific) until OD600 reaches 0.4-to-0.6 before induction steps were applied.
Plasmid Construction. E. coli heat shock promoters were amplified from E. coli DH5α genomic DNA while M. tuber-culosis dnaK promoter was amplified from Mycobacterium bovis genomic DNA, which has the same promoter sequence with M. tuberculosis, by primers shown in Table S1. Codon optimized M. tuberculosis HspR repressor and engineered riboregulators with PclpB promoter part and PibpA-taRNA part were synthesized by GENEWIZ Company. Q5 Hot Start High-Fidelity DNA Polymerase (New England Biolabs, Inc.) was used for all PCR reactions. To construct the stress sensor plasmid backbone, pZa-tetO-eGFP vector was digested with XhoI-KpnI restriction enzymes (New England Biolabs, Inc.) and pET-22b(+) was digested with SalI-SpeI restriction enzymes (New England Biolabs, Inc.) for repressor plasmid backbone construction (pET22b-mProD-HspR). NucleoSpin Gel and PCR Clean-up kit (Macherey-Nagel) was used according to the manufacturer’s instructors to purify digested
DNA samples or PCR products from 1 to 1.8% Agarose gels stained with SYBR Safe DNA Gel Stain (Thermo Fisher Scientific). Plasmid construction was made via ligation with DNA T4 ligase (New England Biolabs, Inc.) or via Gibson Assembly method described by Gibson et al.90 Expression vector for HspR (T7-HspR-pET22b) was constructed via Gibson Assembly method. First, backbone was digested with XbaI-XhoI enzymes, and HspR was amplified at two round PCR with specified primers in Table S1. After all assembly methods, mixes were directly transformed into chemical competent E. coli DH5α cells. Colonies were screened by plasmid digestion. Constructed genetic circuits were sequence verified by Sanger Sequencing (GENEWIZ) (Supplementary Figure S14). All genetic part sequences used the manuscript is introduced in Table S2, and all constructed vector maps are indicated inSupplementary Figure S15−S18.
Heat Shock Experiments and Toxicity Assay. After OD600of experimental cultures reached 0.4-to-0.6, Erlenmeyer flasks corresponding to heat shock treatment were immersed in 55°C water bath for 30 min as describe by Rodrigues et al.,9 while Erlenmeyer flasks corresponding to toxicity assay were treated with water-soluble thiol-capped CdTe QDs with varying concentrations. QDs were prepared using the method as explained in a previous work Seker et al.91 For tert-Butyl hydroperoxide (TBHP) induction, 200μM TBHP was applied on cells and incubated at 37°C for 30 min. Control flasks were kept as untreated at 37 °C. Three independent biological replicas were prepared for each group.
Fluorescence Measurement and Data Analysis. All fluorescence measurement studies were conducted via micro-plate reader (SpectraMax M5, Molecular Devices). Excitation and emission wavelengths for eGFP were set as 485 and 538 nm, respectively. Each measurement was conducted in Corning 96-well clear flat bottom polystyrene plates with 250μL culture sample resuspended in 1xPBS (137 mM NaCl, 2.7 mM KCl, 4.3 mM Na2HPO4, 1.47 mM KH2PO4, pH 7.4). For signal normalization, raw fluorescence intensity was divided by OD600 values of each sample. For each treatment (corresponding temperature or concentration), its control group (cells with mock vector) was subtracted from sensor data. Only dose response curve (Figure 5) was drawn with two sets of groups (control and sensor) without mock subtraction. For 0-to-1 normalization, each value was subtracted from minimum value and divided by difference between maximum and minimum values in related groups. The data for the initial expression level was recorded as the 15th min to eliminate errors caused by delays in early protein expression. Raw data of all QD treated sensors is provided inSupplementary Figure S7. HspR Expression and Western Blot Analysis. E. coli BL21 (DE3) cells (New England Biolabs, Inc.) carrying HspR expression vector (T7-HspR-pET22b) was grown in LB medium with proper antibiotics at 37 °C and 180 rpm in Erlenmeyer flasks. 1% of inoculums from overnight cultures were used to start expression cultures and monitored until OD600reaches 0.4-to-0.6 before induction steps were applied. A control culture was kept as uninduced and other culture was induced with 1 mM isopropylthio-galactoside (IPTG) for 3 h. Afterward, cells were collected, resuspended in 10 mM imidazole buffer (pH 7.4) supplemented with 1 mM phenyl methyl sulfonyl fluoride (PMSF) (AMRESCO Inc.), and proteins were extracted via freeze−thaw method. Protein concentrations were determined with BCA Assay (Thermo Fisher Scientific) and diluted to final concentration of 740 μg/
mL. Proteins were denatured and resolved on 15% SDS-PAGE gel prepared with BioRad SDS Gel casting system. TwentyμL from protein samples were run on gel by using 6× Loading Dye (375 mM Tris-HCl (pH 6.8), 9% SDS (w/v), 50% Glycerol (v/v), 0.03% Bromophenol blue (v/v)). All samples were boiled at 95 °C for 5 min prior to run on gel. 1× SDS Running Buffer (25 mM Tris-HCl, 200 mM Glycine, 0.1% (w/ v) SDS) was used during the run. Further, gel was transferred to polyvinylidene difluoride (PVDF) membranes (Thermo Fisher Scientific). Membrane was blocked with 5% freeze-dried nonfat milk in TBS-T for 1 h at room temperature, and then incubated at 4°C overnight with primary antibody (His-Tag mouse McAb) (Proteintech Europe) diluted at 1:10 000 in blocking solution. Afterward, membrane was washed with TBS-T and incubated with HRP conjugated goat antimouse secondary antibody (abcam) diluted at 1:10 000 in blocking solution for 1 h and visualized by enhanced chemilumines-cence (Bio-Rad) according to the manufacturer’s protocol on ChemiDoc Imaging System with Image Lab Software− Bio-Rad.
RNA Purification and cDNA Synthesis. NucleoSpin RNA kit (New England Biolabs, Inc.) was used according to the manufacturer’s instructors to isolate total RNA from each sample. Three independent biological replicas were prepared for each group. RNA concentration was quantified with NanoDrop 2000 spectrophotometer (Thermo Fisher Scien-tific). Samples were stored at −80 °C until cDNA synthesis.
Reverse transcribed RNA concentration were set to 500 ng in 20 μL reaction volume for each sample. iScript cDNA Synthesis Kits (Bio-Rad) were used to convert RNAs into cDNAs according to the manufacturer’s instructions (5 min at 25°C, 20 min at 46 °C, and 1 min at 95 °C).
qPCR and Data Analysis. After cDNA preparation, qPCR experiment was performed with 1μL cDNA for each sample via SsoAdvanced Universal SYBR Green Supermix (Bio-Rad) for egf p, sodA, and a housekeeping gene (hcaT) according to the manufacturer’s instructions. Primers were specified in
Table S1. Three technical replicas were prepared for each independent biological replica. PCR cycles were proceeded as follows: initial denaturation for 3 min at 95°C, denaturation for 10 s at 95°C, annealing for 15 s at 60 °C, extension for 10 s at 72°C for 39 cycles, 10 s at 95 °C. Product specificity was confirmed by a melting curve analysis (65−95 °C). Comparative Ct method (ΔΔCt) was used to analyze results. Time Resolved Fluorescence Spectroscopy. Experi-ments were performed using a PicoQuant Fluo Time 200 time-correlated single photon counting system. A laser diode operating at 375 nm has a repetition rate of 80 MHz with 200 ps width. 300 nM 500 μL of QDs were added to quartz cuvette, and cell number was kept around 4× 10⁸. To prevent the aggregation of the QDs upon addition of the cells, the mixture was mixed rigorously. The measurements were taken by adjusting the emission maxima of the GFP. Data from these experiments is presented inFigure S8.
Electron Mobility Shift Assay (EMSA). The following promoters used in electrophoretic mobility shift assay were amplified by PCR with stated primers in Table S1: mtPdnaK, PdnaK, PdnaK‑IR2, PdnaK‑IR2‑IR2, PdnaK‑IR3 and PdnaK‑IR3‑IR3 from plasmids mtPdnaKGFP pZa, PdnaKGFP pZa, PdnaK‑IR2GFP pZa, PdnaK‑IR2‑IR2GFP pZa, PdnaK‑IR3GFP pZa, and PdnaK‑IR3‑IR3GFP pZa, respectively. HspR protein was produced as stated above and purified from total protein by using HisTrap HP affinity columns (GE Healthcare Life Sciences) according to the
manufacturer’s protocol. After purification, protein buffer was exchanged to HspR Buffer (20 mM Tris-HCl (pH 7.5), 10 mM NaCl, 1 mM DTT, 20% (v/v) glycerol, 1 mM CaCl2, 0.1 mM EDTA, and 1 mM PMSF) via protein concentrators (Thermo Fisher Scientific). EMSA binding reactions were performed according to Bucca et al.82Briefly, 20 μL of EMSA binding reaction (20 mM Tris-HCl (pH 7.5), 10 mM NaCl, 1 mM DTT, 5 mM MgCl2, 1 mM CaCl2, 30−40 ng DNA, and 40μg HspR) was prepared and incubated at 25 °C for 30 min. Before loading the samples on prerun 4% TBE-PAGE gel, Orange DNA Loading Dye (Thermo Fisher Scientific) was added, and samples were run at 10 V/cm at 4°C. Finally, the gel was stained with SYBR Safe (Thermo Fisher Scientific in 0.5× TBE buffer for visualization. Gel was visualized by ChemiDoc Imaging System with Image Lab Software− Bio-Rad, according to the manufacturer’s protocol.
Microscopy. Samples were prepared together with each fluorescence measurement assays with specified time points in each figure. All imaging was conducted with LSM 510 Confocal Microscope (Zeiss). Samples were excited with Argon 488 nm for reporter imaging and emission was collected with LP 505filter for eGFP, while QD samples were excited with HeNe 543 nm laser, and emission was collected with LP 585 filter. For dose−response curve analysis, bright field imaging of samples were also conducted, which were merged with corresponding fluorescence images afterward. All microscopy images of the sensors are provided in Supple-mentary Figure S8−S13.
Statistical Analysis. All data were expressed as mean ± standard error mean. Depending on the groups of interest, either one-way analysis of variance (ANOVA) or two-way ANOVA with Dunnett’s/Tukey’s/Sidak’s multiple comparison tests (GraphPad Prism v6) were used to compare groups.
■
ASSOCIATED CONTENT*
S Supporting InformationThe Supporting Information is available free of charge on the
ACS Publications website at DOI: 10.1021/acssyn-bio.9b00291.
A list of primers, a list of gene sequences, Sanger sequencing verification results of all vectors, plasmid maps of all vectors,fluorescent microscopy images, time-resolved fluorescent spectroscopy analysis, RT-qPCR results, Western Blot result of HspR expression, electron mobility shift assay (EMSA), growth curves of heat and QD treated samples, and associated references (PDF)
■
AUTHOR INFORMATIONCorresponding Author
*E-mail:[email protected].
ORCID
Behide Saltepe: 0000-0002-4338-6463
Urartu Özgür Şafak Şeker: 0000-0002-5272-1876
Author Contributions
UOSS conceived the idea. UOSS and BS designed the circuits and the experimental plan. BS carried out all of the clonings and assembly of genetic circuits, and ran the toxicity tests. BS and EUB carried out the Q-PCR experiments and EMSA assays together. BS and NH carried out the expression analysis of HspR protein. UOSS and BS analyzed the data and wrote the manuscript.
Notes
The authors declare the following competing financial interest(s): UOS Seker is cofounder of Synbiotik LLC.
■
ACKNOWLEDGMENTSWe thank Prof. Hilmi Volkan Demir for the generous gift of the QDs from his laboratory, and Dr. Esra Yuca for technical support. UOSS acknowledges the TUBA-GEBIP Award, Science Academy BAGEP Award. This project was supported by The Scientific and Technological Research Council of Turkey (TUBITAK- Grant No 114Z653).
■
ABBREVIATIONScrRNA, cis-repressing RNA; HAIR, HspR-associated inverted repeats; HSP, heat shock protein; HSPR, heat shock protein response; IR2, inverted repeat 2; IR3, inverted repeat 3; QD, quantum dot; RBS, ribosome-binding site; ROS, reactive oxygen species; sncRNAs, small noncoding RNAs; taRNA, trans-activating RNA.
■
REFERENCES(1) Collins, A. R., Annangi, B., Rubio, L., Marcos, R., Dorn, M., Merker, C., Estrela-Lopis, I., Cimpan, M. R., Ibrahim, M., Cimpan, E., Ostermann, M., Sauter, A., El Yamani, N., Shaposhnikov, S., Chevillard, S., Paget, V., Grall, R., Delic, J., Goni-de-Cerio, F., Suarez-Merino, B., Fessard, V., Hogeveen, K. N., Fjellsbo, L. M., Pran, E. R., Brzicova, T., Topinka, J., Silva, M. J., Leite, P. E., Ribeiro, A. R., Granjeiro, J. M., Grafstrom, R., Prina-Mello, A., and Dusinska, M. (2017) High throughput toxicity screening and intracellular detection of nanomaterials. WIREs. Nanomed. Nanobiotechnol. 9, e1413.
(2) Li, W. J., Zhou, J., and Xu, Y. Y. (2015) Study of the in vitro cytotoxicity testing of medical devices. Biomed. Rep. 3, 617−620.
(3) Wang, X. F., Ge, J. B., Wang, K. Q., Qian, J. Y., and Zou, Y. Z. (2006) Evaluation of MTT assay for measurement of emodin-induced cytotoxicity. Assay Drug Dev. Technol. 4, 203−207.
(4) Jo, H. Y., Kim, Y., Park, H. W., Moon, H. E., Bae, S., Kim, J., Kim, D. G., and Paek, S. H. (2015) The Unreliability of MTT Assay in the Cytotoxic Test of Primary Cultured Glioblastoma Cells. Exp. Neurobiol. 24, 235−245.
(5) van Meerloo, J., Kaspers, G. J. L., and Cloos, J. (2011) Cell Sensitivity Assays: The MTT Assay, In Cancer Cell Culture: Methods and Protocols (Cree, I. A., Ed.), pp 237−245, Humana Press, Totowa, NJ.
(6) Kirkpatrick, C. J., Bittinger, F., Wagner, M., Kohler, H., van Kooten, T. G., Klein, C. L., and Otto, M. (1998) Current trends in biocompatibility testing. Proc. Inst. Mech. Eng., Part H 212, 75−84.
(7) Poynton, H. C., Lazorchak, J. M., Impellitteri, C. A., Blalock, B., Smith, M. E., Struewing, K., Unrine, J., and Roose, D. (2013) Toxicity and Transcriptomic Analysis in Hyalella azteca Suggests Increased Exposure and Susceptibility of Epibenthic Organisms to Zinc Oxide Nanoparticles. Environ. Sci. Technol. 47, 9453−9460.
(8) Simon, D. F., Domingos, R. F., Hauser, C., Hutchins, C. M., Zerges, W., and Wilkinson, K. J. (2013) Transcriptome Sequencing (RNA-seq) Analysis of the Effects of Metal Nanoparticle Exposure on the Transcriptome of Chlamydomonas reinhardtii. Appl. Environ. Microb. 79, 4774−4785.
(9) Rodrigues, J. L., Sousa, M., Prather, K. L. J., Kluskens, L. D., and Rodrigues, L. R. (2014) Selection of Escherichia coli heat shock promoters toward their application as stress probes. J. Biotechnol. 188, 61−71.
(10) Guadagnini, R., Kenzaoui, B. H., Walker, L., Pojana, G., Magdolenova, Z., Bilanicova, D., Saunders, M., Juillerat-Jeanneret, L., Marcomini, A., Huk, A., Dusinska, M., Fjellsbo, L. M., Marano, F., and Boland, S. (2015) Toxicity screenings of nanomaterials: challenges due to interference with assay processes and components of classic in vitro tests. Nanotoxicology 9, 13−24.
(11) Lovern, S. B., and Klaper, R. (2006) Daphnia magna mortality when exposed to titanium dioxide and fullerene (C-60) nanoparticles. Environ. Toxicol. Chem. 25, 1132−1137.
(12) Hund-Rinke, K., and Simon, M. (2006) Ecotoxic effect of photocatalytic active nanoparticles TiO2 on algae and daphnids. Environ. Sci. Pollut. Res. 13, 225−232.
(13) Lee, K. J., Nallathamby, P. D., Browning, L. M., Osgood, C. J., and Xu, X. H. N. (2007) In vivo imaging of transport and biocompatibility of single silver nanoparticles in early development of zebrafish embryos. ACS Nano 1, 133−143.
(14) King-Heiden, T. C., Wiecinski, P. N., Mangham, A. N., Metz, K. M., Nesbit, D., Pedersen, J. A., Hamers, R. J., Heideman, W., and Peterson, R. E. (2009) Quantum Dot Nanotoxicity Assessment Using the Zebrafish Embryo. Environ. Sci. Technol. 43, 1605−1611.
(15) Zhang, W., Lin, K. F., Miao, Y. N., Dong, Q. X., Huang, C. J., Wang, H. L., Guo, M. J., and Cui, X. H. (2012) Toxicity assessment of zebrafish following exposure to CdTe QDs. J. Hazard. Mater. 213, 413−420.
(16) Chong, Y., Ma, Y. F., Shen, H., Tu, X. L., Zhou, X., Xu, J. Y., Dai, J. W., Fan, S. J., and Zhang, Z. J. (2014) The in vitro and in vivo toxicity of graphene quantum dots. Biomaterials 35, 5041−5048.
(17) Liu, J. W., Erogbogbo, F., Yong, K. T., Ye, L., Liu, J., Hu, R., Chen, H. Y., Hu, Y. Z., Yang, Y., Yang, J. H., Roy, I., Karker, N. A., Swihart, M. T., and Prasad, P. N. (2013) Assessing Clinical Prospects of Silicon Quantum Dots: Studies in Mice and Monkeys. ACS Nano 7, 7303−7310.
(18) Gutierrez, J. C., Amaro, F., and Martin-Gonzalez, A. (2015) Heavy metal whole-cell biosensors using eukaryotic microorganisms: an updated critical review. Front. Microbiol., DOI: 10.3389/ fmicb.2015.00048.
(19) Ma, X. Y. Y., Wang, X. C. C., Ngo, H. H., Guo, W. S., Wu, M. N. N., and Wang, N. (2014) Bioassay based luminescent bacteria: Interferences, improvements, and applications. Sci. Total Environ. 468, 1−11.
(20) Cha, H. J., Srivastava, R., Vakharia, V. M., Rao, G., and Bentley, W. E. (1999) Green fluorescent protein as a noninvasive stress probe in resting Escherichia coli cells. Appl. Environ. Microbiol. 65, 409−414. (21) Hyun Seo, J., Gyun Kang, D., and Joon Cha, H. (2003) Comparison of cellular stress levels and green-fluorescent-protein expression in several Escherichia coli strains. Biotechnol. Appl. Biochem. 37, 103−107.
(22) Nemecek, S., Marisch, K., Juric, R., and Bayer, K. (2008) Design of transcriptional fusions of stress sensitive promoters and GFP to monitor the overburden of Escherichia coli hosts during recombinant protein production. Bioprocess Biosyst. Eng. 31, 47−53.
(23) Sorensen, S. J., Burmolle, M., and Hansen, L. H. (2006) Making bio-sense of toxicity: new developments in whole-cell biosensors. Curr. Opin. Biotechnol. 17, 11−16.
(24) Hietakangas, V., and Sistonen, L. (2006) Regulation of the heat shock response by heat shock transcription factors, In Chaperones: 16 (Braakman, I., Ed.), pp 1−34, Springer, Berlin, Heidelberg.
(25) Ahamed, M., Posgai, R., Gorey, T. J., Nielsen, M., Hussain, S. M., and Rowe, J. J. (2010) Silver nanoparticles induced heat shock protein 70, oxidative stress and apoptosis in Drosophila melanogaster. Toxicol. Appl. Pharmacol. 242, 263−269.
(26) Petrache Voicu, S., Dinu, D., Sima, C., Hermenean, A., Ardelean, A., Codrici, E., Stan, M., Zarnescu, O., and Dinischiotu, A. (2015) Silica Nanoparticles Induce Oxidative Stress and Autophagy but Not Apoptosis in the MRC-5 Cell Line. Int. J. Mol. Sci. 16, 29398−29416.
(27) Migita, S., Moquin, A., Fujishiro, H., Himeno, S., Maysinger, D., Winnik, F. M., and Taniguchi, A. (2014) Quantum dots induce heat shock-related cytotoxicity at intracellular environment. In Vitro Cell. Dev. Biol.: Anim. 50, 367−372.
(28) Cicchetti, R., Divizia, M., Valentini, F., and Argentin, G. (2011) Effects of single-wall carbon nanotubes in human cells of the oral cavity: Geno-cytotoxic risk. Toxicol. In Vitro 25, 1811−1819.
(29) Lindquist, S., and Craig, E. A. (1988) The Heat-Shock Proteins. Annu. Rev. Genet. 22, 631−677.
(30) Arsene, F., Tomoyasu, T., and Bukau, B. (2000) The heat shock response of Escherichia coli. Int. J. Food Microbiol. 55, 3−9.
(31) Verghese, J., Abrams, J., Wang, Y. Y., and Morano, K. A. (2012) Biology of the Heat Shock Response and Protein Chaperones: Budding Yeast (Saccharomyces cerevisiae) as a Model System. Microbiol. Mol. Biol. R. 76, 115−158.
(32) Parsell, D. A., Kowal, A. S., Singer, M. A., and Lindquist, S. (1994) Protein Disaggregation Mediated by Heat-Shock Protein Hsp104. Nature 372, 475−478.
(33) Laskowska, E., KuczynskaWisnik, D., SkorkoGlonek, J., and Taylor, A. (1996) Degradation by proteases Lon, Clp and HtrA, of Escherichia coli proteins aggregated in vivo by heat shock; HtrA protease action in vivo and in vitro. Mol. Microbiol. 22, 555−571.
(34) Grossman, A. D., Erickson, J. W., and Gross, C. A. (1984) The Htpr Gene-Product of Escherichia-Coli Is a Sigma-Factor for Heat-Shock Promoters. Cell 38, 383−390.
(35) Straus, D. B., Walter, W. A., and Gross, C. A. (1987) The Heat-Shock Response of Escherichia-Coli Is Regulated by Changes in the Concentration of Sigma-32. Nature 329, 348−351.
(36) Yura, T., and Nakahigashi, K. (1999) Regulation of the heat-shock response. Curr. Opin. Microbiol. 2, 153−158.
(37) Nakahigashi, K., Yanagi, H., and Yura, T. (1995) Isolation and Sequence-Analysis of Rpoh Genes Encoding Sigma(32) Homologs from Gram-Negative Bacteria - Conserved Messenger-Rna and Protein Segments for Heat-Shock Regulation. Nucleic Acids Res. 23, 4383−4390.
(38) Tilly, K., Mckittrick, N., Zylicz, M., and Georgopoulos, C. (1983) The Dnak Protein Modulates the Heat-Shock Response of Escherichia-Coli. Cell 34, 641−646.
(39) Tomoyasu, T., Ogura, T., Tatsuta, T., and Bukau, B. (1998) Levels of DnaK and DnaJ provide tight control of heat shock gene expression and protein repair in Escherichia coli. Mol. Microbiol. 30, 567−581.
(40) Tatsuta, T., Tomoyasu, T., Bukau, B., Kitagawa, M., Mori, H., Karata, K., and Ogura, T. (1998) Heat shock regulation in the ftsH null mutant of Escherichia coli: dissection of stability and activity control mechanisms of sigma(32) in vivo. Mol. Microbiol. 30, 583− 593.
(41) Paton, G. I., Campbell, C. D., Glover, L. A., and Killham, K. (1995) Assessment of Bioavailability of Heavy-Metals Using Lux Modified Constructs of Pseudomonas-Fluorescens. Lett. Appl. Micro-biol. 20, 52−56.
(42) Chaudri, A. M., Knight, B. P., Barbosa-Jefferson, V. L., Preston, S., Paton, G. I., Killham, K., Coad, N., Nicholson, F. A., Chambers, B. J., and McGrath, S. P. (1999) Determination of acute Zn toxicity in pore water from soils previously treated with sewage sludge using bioluminescence assays. Environ. Sci. Technol. 33, 1880−1885.
(43) Sato, T., and Kobayashi, Y. (1998) The ars operon in the skin element of Bacillus subtilis confers resistance to arsenate and arsenite. J. Bacteriol. 180, 1655−1661.
(44) Lee, S., Sode, K., Nakanishi, K., Marty, J. L., Tamiya, E., and Karube, I. (1992) A Novel Microbial Sensor Using Luminous Bacteria. Biosens. Bioelectron. 7, 273−277.
(45) Gill, R. T., Cha, H. J., Jain, A., Rao, G., and Bentley, W. E. (1998) Generating controlled reducing environments in aerobic recombinant Escherichia coli fermentations: Effects on cell growth, oxygen uptake, heat shock protein expression, and in vivo CAT activity. Biotechnol. Bioeng. 59, 248−259.
(46) Sagi, E., Hever, N., Rosen, R., Bartolome, A. J., Rajan Premkumar, J., Ulber, R., Lev, O., Scheper, T., and Belkin, S. (2003) Fluorescence and bioluminescence reporter functions in genetically modified bacterial sensor strains. Sens. Actuators, B 90, 2−8.
(47) Aertsen, A., Vanoirbeek, K., De Spiegeleer, P., Sermon, J., Hauben, K., Farewell, A., Nystrom, T., and Michiels, C. W. (2004) Heat shock protein-mediated resistance to high hydrostatic pressure in Escherichia coli. Appl. Environ. Microb. 70, 2660−2666.
(48) Vandyk, T. K., Majarian, W. R., Konstantinov, K. B., Young, R. M., Dhurjati, P. S., and Larossa, R. A. (1994) Rapid and Sensitive
Pollutant Detection by Induction of Heat-Shock Gene-Biolumines-cence Gene Fusions. Appl. Environ. Microbiol. 60, 1414−1420.
(49) Ben-Israel, O., Ben-Israel, H., and Ulitzur, S. (1998) Identification and quantification of toxic chemicals by use of Escherichia coli carrying lux genes fused to stress promoters. Appl. Environ. Microbiol. 64, 4346−4352.
(50) Padilla-Martinez, F., Carrizosa-Villegas, L. A., Rangel-Serrano, A., Paramo-Perez, I., Mondragon-Jaimes, V., Anaya-Velazquez, F., Padilla-Vaca, F., and Franco, B. (2015) Cell damage detection using Escherichia coli reporter plasmids: fluorescent and colorimetric assays. Arch. Microbiol. 197, 815−821.
(51) Saltepe, B., Kehribar, E. S., Yirmibesoglu, S. S. S., and Seker, U. O. S. (2018) Cellular Biosensors with Engineered Genetic Circuits. Acs Sensors 3, 13−26.
(52) Goers, L., Kylilis, N., Tomazou, M., Wen, K. Y., Freemont, P., and Polizzi, K. (2013) Engineering Microbial Biosensors. Methods Microbiol. 40, 119−156.
(53) Park, M., Tsai, S. L., and Chen, W. (2013) Microbial Biosensors: Engineered Microorganisms as the Sensing Machinery. Sensors 13, 5777−5795.
(54) Alivisatos, A. P. (1996) Semiconductor clusters, nanocrystals, and quantum dots. Science 271, 933−937.
(55) Weller, H. (1998) Quantum size colloids: from size-dependent properties of discrete particles to self-organized superstructures. Curr. Opin. Colloid Interface Sci. 3, 194−199.
(56) Nel, A., Xia, T., Madler, L., and Li, N. (2006) Toxic potential of materials at the nanolevel. Science 311, 622−627.
(57) Li, Y., Zhang, Y., and Yan, B. (2014) Nanotoxicity Overview: Nano-Threat to Susceptible Populations. Int. J. Mol. Sci. 15, 3671− 3697.
(58) Ray, P. C., Yu, H. T., and Fu, P. P. (2009) Toxicity and Environmental Risks of Nanomaterials: Challenges and Future Needs. J. Environ. Sci. Heal. C 27, 1−35.
(59) Saptarshi, S. R., Duschl, A., and Lopata, A. L. (2013) Interaction of nanoparticles with proteins: relation to bio-reactivity of the nanoparticle. J. Nanobiotechnol. 11, 26.
(60) Singh, N., Manshian, B., Jenkins, G. J. S., Griffiths, S. M., Williams, P. M., Maffeis, T. G. G., Wright, C. J., and Doak, S. H. (2009) NanoGenotoxicology: The DNA damaging potential of engineered nanomaterials. Biomaterials 30, 3891−3914.
(61) Lindberg, H. K., Falck, G. C. M., Suhonen, S., Vippola, M., Vanhala, E., Catalan, J., Savolainen, K., and Norppa, H. (2009) Genotoxicity of nanomaterials: DNA damage and micronuclei induced by carbon nanotubes and graphite nanofibres in human bronchial epithelial cells in vitro. Toxicol. Lett. 186, 166−173.
(62) Ahmad, J., Ahamed, M., Akhtar, M. J., Alrokayan, S. A., Siddiqui, M. A., Musarrat, J., and Al-Khedhairy, A. A. (2012) Apoptosis induction by silica nanoparticles mediated through reactive oxygen species in human liver cell line HepG2. Toxicol. Appl. Pharmacol. 259, 160−168.
(63) Dumas, E. M., Ozenne, V., Mielke, R. E., and Nadeau, J. L. (2009) Toxicity of CdTe Quantum Dots in Bacterial Strains. Ieee T. Nanobiosci. 8, 58−64.
(64) Lyon, D. Y., Brunet, L., Hinkal, G. W., Wiesner, M. R., and Alvarez, P. J. J. (2008) Antibacterial activity of fullerene water suspensions (nC(60)) is not due to ROS-mediated damage. Nano Lett. 8, 1539−1543.
(65) Sharma, V., Singh, S. K., Anderson, D., Tobin, D. J., and Dhawan, A. (2011) Zinc Oxide Nanoparticle Induced Genotoxicity in Primary Human Epidermal Keratinocytes. J. Nanosci. Nanotechnol. 11, 3782−3788.
(66) Slavin, Y. N., Asnis, J., Hafeli, U. O., and Bach, H. (2017) Metal nanoparticles: understanding the mechanisms behind antibacterial activity. J. Nanobiotechnol.,DOI: 10.1186/s12951-017-0308-z.
(67) Hussain, S., Vanoirbeek, J. A. J., and Hoet, P. H. M. (2012) Interactions of nanomaterials with the immune system. Wiley Interdisciplinary Reviews-Nanomedicine and Nanobiotechnology 4, 169−183.
(68) Truong, L., Tilton, S. C., Zaikova, T., Richman, E., Waters, K. M., Hutchison, J. E., and Tanguay, R. L. (2013) Surface functionalities of gold nanoparticles impact embryonic gene expression responses. Nanotoxicology 7, 192−201.
(69) Tkach, A. V., Shurin, G. V., Shurin, M. R., Kisin, E. R., Murray, A. R., Young, S. H., Star, A., Fadeel, B., Kagan, V. E., and Shvedova, A. A. (2011) Direct Effects of Carbon Nanotubes on Dendritic Cells Induce Immune Suppression Upon Pulmonary Exposure. ACS Nano 5, 5755−5762.
(70) Monras, J. P., Collao, B., Molina-Quiroz, R. C., Pradenas, G. A., Saona, L. A., Duran-Toro, V., Ordenes-Aenishanslins, N., Venegas, F. A., Loyola, D. E., Bravo, D., Calderon, P. F., Calderon, I. L., Vasquez, C. C., Chasteen, T. G., Lopez, D. A., and Perez-Donoso, J. M. (2014) Microarray analysis of the Escherichia coli response to CdTe-GSH Quantum Dots: understanding the bacterial toxicity of semiconductor nanoparticles. BMC Genomics 15, 1099.
(71) Wang, A. Y., and Crowley, D. E. (2005) Global gene expression responses to cadmium toxicity in Escherichia coli. J. Bacteriol. 187, 3259−3266.
(72) Fang, T. T., Li, X., Wang, Q. S., Zhang, Z. J., Liu, P., and Zhang, C. C. (2012) Toxicity evaluation of CdTe quantum dots with different size on Escherichia coli. Toxicol. In Vitro 26, 1233−1239.
(73) Mogk, A., Tomoyasu, T., Goloubinoff, P., Rudiger, S., Roder, D., Langen, H., and Bukau, B. (1999) Identification of thermolabile Escherichia coli proteins: prevention and reversion of aggregation by DnaK and ClpB. EMBO J. 18, 6934−6949.
(74) Caspeta, L., Flores, N., Perez, N. O., Bolivar, F., and Ramirez, O. T. (2009) The Effect of Heating Rate on Escherichia coli Metabolism, Physiological Stress, Transcriptional Response, and Production of Temperature-induced Recombinant Protein: A Scale-Down Study. Biotechnol. Bioeng. 102, 468−482.
(75) Zolkiewski, M. (1999) ClpB cooperates with DnaK, DnaJ, and GrpE in suppressing protein aggregation - A novel multi-chaperone system from Escherichia coli. J. Biol. Chem. 274, 28083−28086.
(76) Isaacs, F. J., Dwyer, D. J., Ding, C. M., Pervouchine, D. D., Cantor, C. R., and Collins, J. J. (2004) Engineered riboregulators enable post-transcriptional control of gene expression. Nat. Biotechnol. 22, 841−847.
(77) LeThanh, H., Neubauer, P., and Hoffmann, F. (2005) The small heat-shock proteins IbpA and IbpB reduce the stress load of recombinant Escherichia coli and delay degradation of inclusion bodies. Microb. Cell Fact. 4, 6.
(78) Bucca, G., Brassington, A. M. E., Schonfeld, H. J., and Smith, C. P. (2000) The HspR regulon of Streptomyces coelicolor: a role for the DnaK chaperone as a transcriptional co-repressor. Mol. Microbiol. 38, 1093−1103.
(79) Bandyopadhyay, B., Das Gupta, T., Roy, D., and Das Gupta, S. K. (2012) DnaK Dependence of the Mycobacterial Stress-Responsive Regulator HspR Is Mediated through Its Hydrophobic C-Terminal Tail. J. Bacteriol. 194, 4688−4697.
(80) Stewart, G. R., Wernisch, L., Stabler, R., Mangan, J. A., Hinds, J., Laing, K. G., Young, D. B., and Butcher, P. D. (2002) Dissection of the heat-shock response in Myobacterium tuberculosis using mutants and microarrays. Microbiology 148, 3129−3138.
(81) Grandvalet, C., de Crecy-Lagard, V., and Mazodier, P. (1999) The clpB ATPase of Streptomyces albus G belongs to the HspR heat shock regulon. Mol. Microbiol. 31, 521−532.
(82) Bucca, G., Ferina, G., Puglia, A. M., and Smith, C. P. (1995) The Dnak Operon of Streptomyces-Coelicolor Encodes a Novel Heat-Shock Protein Which Binds to the Promoter Region of the Operon. Mol. Microbiol. 17, 663−674.
(83) Gomes, S. A. O., Vieira, C. S., Almeida, D. B., Santos-Mallet, J. R., Menna-Barreto, R. F. S., Cesar, C. L., and Feder, D. (2011) CdTe and CdSe Quantum Dots Cytotoxicity: A Comparative Study on Microorganisms. Sensors 11, 11664−11678.
(84) Jones, C. F., and Grainger, D. W. (2009) In vitro assessments of nanomaterial toxicity. Adv. Drug Delivery Rev. 61, 438−456.
(85) Vanbogelen, R. A., Kelley, P. M., and Neidhardt, F. C. (1987) Differential Induction of Heat-Shock, Sos, and Oxidation Stress