A highly sensitive atomic force microscope for linear measurements of molecular
forces in liquids
Shivprasad Patil, George Matei, Hang Dong, Peter M. Hoffmann, Mustafa Karaköse, and Ahmet Oral
Citation: Review of Scientific Instruments 76, 103705 (2005); doi: 10.1063/1.2083147 View online: https://doi.org/10.1063/1.2083147
View Table of Contents: http://aip.scitation.org/toc/rsi/76/10
Published by the American Institute of Physics
Articles you may be interested in
Improved fiber-optic interferometer for atomic force microscopy
Applied Physics Letters 55, 2588 (1989); 10.1063/1.101987
Viscosity of a nanoconfined liquid during compression
Applied Physics Letters 104, 023110 (2014); 10.1063/1.4861856
A new tuning fork-based instrument for oscillatory shear rheology of nano-confined liquids
Review of Scientific Instruments 84, 025101 (2013); 10.1063/1.4789431
Simultaneous normal and shear measurements of nanoconfined liquids in a fiber-based atomic force microscope
Review of Scientific Instruments 79, 023706 (2008); 10.1063/1.2839913
High-sensitivity noncontact atomic force microscope/scanning tunneling microscope (nc AFM/STM) operating at subangstrom oscillation amplitudes for atomic resolution imaging and force spectroscopy
Review of Scientific Instruments 74, 3656 (2003); 10.1063/1.1593786
True atomic resolution in liquid by frequency-modulation atomic force microscopy
A highly sensitive atomic force microscope for linear measurements
of molecular forces in liquids
Shivprasad Patil, George Matei, Hang Dong, and Peter M. Hoffmanna兲 Department of Physics, Wayne State University, 666 West Hancock, Detroit, Michigan 48201 Mustafa Karaköse and Ahmet Oral
Department of Physics, Bilkent University, Ankara, Turkey
共Received 26 July 2005; accepted 29 August 2005; published online 24 October 2005兲
We describe a highly improved atomic force microscope for quantitative nanomechanical measurements in liquids. The main feature of this microscope is a modified fiber interferometer mounted on a five axis inertial slider which provides a deflection sensitivity that is significantly better than conventional laser deflection based systems. The measured low noise floor of 572.0 fm/
冑
Hz provides excellent cantilever amplitude resolution. This allows us to operate the instrument far below resonance at extremely small cantilever amplitudes of less than 1 Å. Thuslinear measurements of nanomechanical properties of liquid systems can be performed. In
particular, we present measurements of solvation forces in confined octamethylcyclotetrasiloxane and water with amplitudes smaller than the size of the respective molecules. In general, the development of the instrument is important in the context of quantitative nanomechanical measurements in liquid environments. © 2005 American Institute of Physics.
关DOI:10.1063/1.2083147兴
I. INTRODUCTION
Since the invention of scanning tunneling microscopy 共STM兲 and atomic force microscopy 共AFM兲, probe-based techniques have been able to address many long-standing issues in surface science, biology, tribology, semiconductor physics, magnetism, and nanoscience.1–6 In addition to im-aging, scanning probe techniques have the ability to measure various quantities as a function of tip-surface separation with unprecedented spatial resolution. AFM, in particular, has been used to measure forces between single molecules, bonding forces between atoms, adhesion, and friction at the nanoscale,7–12 as well as structural or hydration forces in liquids.13–17 O’Shea et al.13 used AFM for the first time to measure oscillatory solvation forces in a nonpolar liquid, oc-tamethylcyclotetrasiloxane共OMCTS兲, confined between two solid surfaces. These forces and the layering of the liquid at interfaces with molecular separation are important for tribology.18 Interfacial water confined between surfaces is also a topic of immense interest, especially in the context of cell biology, interactions between macromolecules or col-loids in water, and protein folding.19 There is clearly a need for instruments that can quantify the nanomechanical prop-erties of liquids. One of these instruments is the surface force apparatus共SFA兲. In SFA cylindrical rods wrapped with mica sheets are brought together in liquid.20One of the surfaces is held fixed and the other is mounted on a spring to measure the force between the surfaces. The separation between the surfaces is measured independently by interferometry. Oscil-latory forces due to solvation shells in confined water were first observed in 1983 by Israelachvili and Pashley using
SFA.21 Despite much work since there is still a lack of suf-ficient data to draw clear conclusions about the collective behavior of liquid molecules under confinement. The main drawbacks of SFA are lack of spatial resolution, the restric-tion to mica surfaces, and the jump-to-contact instability in the force measurement due to large interacting surface areas. These disadvantages have prompted researchers to measure forces in liquids using AFM. However, in AFM the signal strength is extremely small due to small contact areas. In addition, the tip-surface separation and tip geometry are typi-cally unknown. Thus the two techniques have strengths as well as disadvantages and can be seen as complementary techniques.
For better signal-to-noise ratio AFM is usually operated at the resonance frequency of the cantilever and changes in the amplitude or frequency are measured as the tip ap-proaches the surface.22,23 Typically amplitudes of the order of 1 – 10 nm are used for measurement of surface forces us-ing this dynamic technique. In the context of measurements of solvation forces, this presents two problems:共1兲 the pos-sibility of disrupting the molecular layers and共2兲 difficulties in relating the measured quantities to the stiffness and damp-ing of these layers in a straightforward manner. The former problem makes the measured damping and forces a function of very complicated processes associated with disturbing a large number of layers during the travel of the tip. The latter problem stems mainly from the fact that the force field is not linear over the cantilever oscillation amplitude. The ampli-tude should be at least smaller than the molecule size for linear measurement of the stiffness of layers in confined liq-uids. Thus there is a need to enhance the sensitivity of AFM techniques in order to avoid complicated ways of interpret-a兲Electronic mail: [email protected]
ing the data resulting from large amplitude measurement techniques. This can be achieved by using more sensitive deflection sensors, such as a fiber based interferometer.24A high-sensitivity deflection sensor allows the use of small-amplitude, off-resonance techniques which have been used in ultrahigh vacuum共UHV兲 to linearly measure the stiffness of atomic bonds.10,25,26 This method employs extremely small 共sub-兲angstrom amplitudes for force measurements.
In this article we describe the development of small-amplitude, off-resonance AFM using a fiber-based interfer-ometer for measuring forces in liquids. This instrument has been used for measurement of solvation forces in OMCTS and water confined between atomically flat surfaces and a silicon tip. We discuss the results obtained in terms of instru-ment performance.
II. INSTRUMENT DESIGN
To use the small-amplitude technique in liquid environ-ments with a fiber-based interferometer involves certain is-sues. Compared to UHV operation, the design for sliders and coarse approach mechanisms changes considerably owing to the fact that sample, tip, and fiber end have to be immersed in liquid while performing measurements. Second, the con-tribution of thermal noise differs significantly due to the change in quality factor and cantilever stiffness values used in liquids. The quality factor in liquid is of order 1 whereas in UHV it can well exceed 1000. Also the stiffness of the cantilever is typically 1 N / m and in UHV stiffnesses of about 100 N / m have to be used to avoid snap-to-contact. Third, the refractive index of the liquid environments has a significant impact on sensitivity for the fiber based interfer-ometer detection system. The most obvious difference be-tween a previous UHV-based fiber interferometric AFM26 and the present liquid-based AFM is the completely different geometry. While in UHV, the sample was vertical and coarse motions of both sample and fiber were primarily horizontal, in liquids the sample has to be horizontal and the coarse motions have to be 共at least partially兲 vertical. This poses significant challenges, since piezobased coarse positioners are difficult to design for operation against gravity.27–30
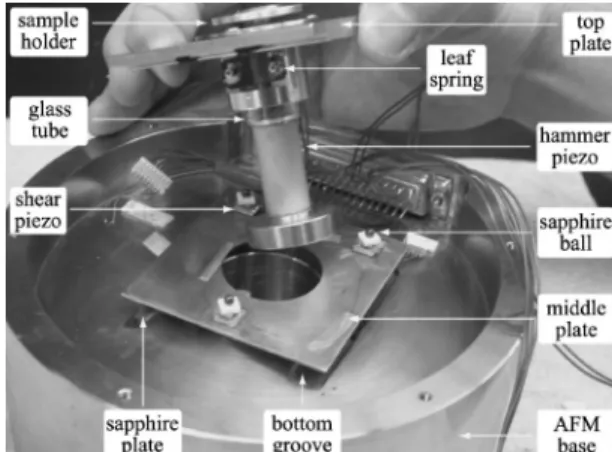
The liquid AFM is built on a heavy base with a diameter of 6 in. and a height of 3.5 in.. The central part of the block is hollowed out to accommodate the vertical sample coarse approach and the sample scanner. As shown in Fig. 1, the sample coarse approach relies on the inertial slider principle.27,30In particular, a heavy steel piece共“hammer”兲 is glued to the lower end of a tube piezo 共the “hammer piezo”兲.31
On the upper part of the tube piezo a quartz tube is attached, which fits into an opening of the XY positioner 共described in the following兲 and is held by a leaf spring. Inside the glass tube is the scan piezo tube32 with the outer electrode sectioned into quadrants to allow for x and y mo-tion. The sample holder is attached to the scan piezo. For coarse motion, pulses are given to the hammer piezo which have a “slow” rising edge and a fast drop off. During the slow, rising part of the pulse, the tube piezo contracts or expands, moving the hammer up共or down兲. The upper end
remains clamped. When the pulse suddenly switches off, the inertia of the hammer keeps it in place forcing the glass tube to slide past the leaf spring.
The XY 共horizontal兲 sample positioner also uses the in-ertial slider principle. In this case shear piezos are mounted to heavy steel plates. Overall, the XY sample positioner con-sists of grooves cut into the AFM base, a middle plate with a set of three shear piezos on each side and a top plate with grooves perpendicular to the grooves in the AFM base. On top of each shear piezo mounted on the middle plate is a macor piece, which serves as a seat for a 2 mm sapphire ball. The sapphire ball can slide on a sapphire plate that is glued inside one of the grooves. Since the grooves on the base and the top plate are perpendicular to each other共matching the shear direction of the respective shear piezos兲, X and Y mo-tion can be generated providing a total travel of 5 mm and a step size as small as 50 nm. In the middle of each plate is a hole to accommodate the z coarse approach assembly de-scribed previously, as well as the scan piezo and sample holder. The sample holder consists of an aluminum plate which has three magnets glued into recessed holes which serve as holders for the actual sample or liquid cell. The liquid cell consists of a Viton O-ring 共2 in. diameter and 0.063 in. thickness兲 compressed between two circular Kel-F sheets. A nickel plate is attached to the base of the cell in order to mount the cell to the three magnets on the sample holder providing a stiff contact between the scanner piezo and the liquid cell and at the same time allowing easy sample exchange. The top Kel-F sheet has a hole in the center for the cantilever and fiber to be brought close to the surface. The two Kel-F sheets and the nickel plate are held together with four screws. The substrate is held in position between the bottom Kel-F sheet and the pressed-down O-ring. A glass syringe with a fine needle is used to fill or remove liquid.
Once the coarse positioners are put into place, a cover plate is mounted on top of the AFM base, which has a hole for the sample holder and tapped screw holes for the canti-lever mount and the fiber coarse positioner. Once this plate is mounted, only the sample holder is visible. This can be seen in the schematic in Fig. 2 and the photograph of the as-sembled AFM in Fig. 3.
On top of the cover plate the cantilever mount is
FIG. 1. Photograph showing the AFM base with the sample coarse position-ing system.
mounted using three screws. A 12° angle is introduced at the free end of this mount where a dither piezo, a shear piezo, a macor spacer, and the actual cantilever holder are glued. The angle allows the tip to reach the surface first. The cantilever holder is made of steel and the cantilevers are held by a leaf spring made of copper-beryllium fastened by two screws. The cantilever holder is glued to the shear and dither piezos to allow for cantilever oscillations normal and lateral to the surface. The cantilever motion is detected using a fiber inter-ferometer 共see the following兲. A fiber slider is required for precisely positioning the fiber with respect to the cantilever and adjusting the angle between fiber and cantilever in order to achieve high sensitivity. The fiber slider is mounted to the cover plate so that the fiber is located right above the canti-lever as shown in Fig. 3.
The AFM is placed on a tabletop vibration isolation sys-tem with natural frequency below 2 Hz.33 The tip sample approach is monitored using a charge coupled device cam-era. The AFM is kept inside an aluminum acoustic shielding box which is lined with sound/temperature insulating mate-rial. The humidity is controlled by using suitable desiccants within the AFM enclosure.
III. FIBER SLIDER
For measurements at cantilever amplitudes down to less than 1 Å we need a deflection sensor with very high sensi-tivity. We are using a fiber-based interferometer. In order to
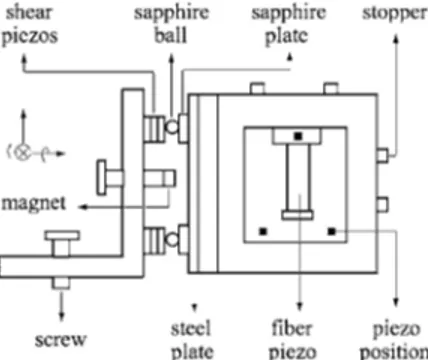
achieve maximum sensitivity the fiber needs to be aligned exactly perpendicularly and at a suitable distance with re-spect to the cantilever. This is achieved through a fiber posi-tioner or “slider”共Fig. 4兲 which can rotate in two directions,
andand move in x, y, and z directions. The fiber posi-tioner in our instrument works on the inertial principle simi-lar to the one described in Ref. 26 for UHV environments. However, as mentioned previously, the overall geometry of the fiber positioner is very different owing to the vertical axis of the liquid AFM as opposed to the horizontal orientation of the UHV-based AFM. Successful operation of any inertial slider in five directions depends on the friction between slid-ing parts. Compared to the UHV system, there are two main differences: One is the vertical orientation of the slider, the other is the presence of liquid layers on the sliding surfaces due to the operation in the ambient. The static friction has to be sufficient to overcome gravity, whereas the kinetic friction needs to be low enough to allow sliding. This requires opti-mal adjustment of the contact force between the sliding parts of the positioner. In our design we are able to adjust the contact force with the help of screw-mounted magnets.
The fiber slider consists of two parts: a yz and a xz slider, which are oriented perpendicularly to each other. Each slider has a set of three piezo stacks with each consisting of three shear piezos.34The stacks are arranged in the shape of a equilateral triangle. High voltage, slow-on, fast-off pulses 共200–300 V兲 are applied selectively to the stacks of piezos to initiate the inertial motion.27 The number of pulses, the pulse height and width can be adjusted in the driver software. The two shear piezos at the bottom of each stack have po-larization direction opposite to each other. The top piezo has its polarization direction orthogonal to the two bottom pi-ezos. For vertical motion pulses are given to the two bottom piezos, whereas for lateral motion the top piezo is used. For rotation pulses with opposite sign are applied to the top piezo on one stack with respect to the top piezos of the other two stacks.
1 mm sapphire balls are glued to the top of the piezo stacks. The xz slider has sapphire plates which can slide with respect to the sapphire balls glued to the piezo stacks on the yzslider. The xzslider in turn has piezo stacks which move a plate holding a fine approach fiber piezo and the fiber itself. The two sliders are held in place by magnets glued to flat ended screws as shown in Fig. 4. The magnets exerts an
FIG. 2. Cross-sectional schematic of liquid AFM.
FIG. 3. Photograph of completely assembled AFM system, showing canti-lever mount, fiber positioner, and liquid cell.
FIG. 4. Schematic view of fiber coarse positioner. The positioner consists of two perpendicularly mounted sliders: The yzslider on the left and the xz slider on the right. The fiber is mounted to the end of the fiber piezo.
attractive force on a magnetic steel plate attached to the back of the slider plate. The strength of the force can be judi-ciously chosen for the vertical sliding motion by adjusting the magnet-to-steel-plate separation with the screw, for rea-sons discussed previously. There are stoppers for both the sliders to limit the motion and prevent the sliders to slide off the sapphire plates.
The optical fiber itself is passed through a glass ferrule which is glued to the fine approach tube piezo 共“fiber piezo”兲.35The fiber piezo is glued to the plate that slides with respect to the xz slider, as shown in the Fig. 3. During alignment, the fiber piezo moves the fiber back and forth allowing us to find the quadrature point where the slope of the interference pattern is maximized. While collecting data, the fiber piezo is controlled via a feedback loop to keep the fiber position at the quadrature point at all times.
IV. FIBER INTERFEROMETER
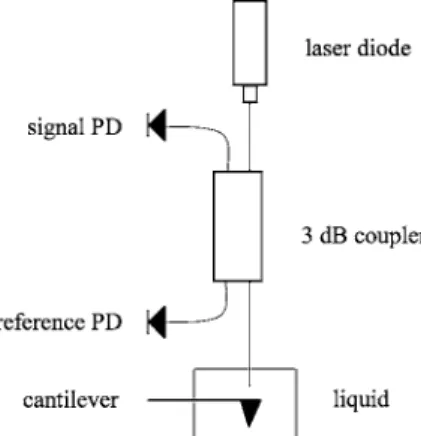
Our fiber interferometer is similar to the one reported earlier for the UHV system26 and is ultimately based on the design of Rugar et al.24If the fiber is held close and perpen-dicular to the cantilever, the multiple reflections of the light between the end of the fiber and the cantilever enhance the signal sensitivity considerably.26The five-axis fiber slider de-scribed previously is used to align the fiber with respect to the cantilever to achieve the required sensitivity. The general scheme of the interferometer is as follows. A laser diode with 2 – 3 mW power and 1310 nm wavelength is coupled into a 2⫻2, single mode, 50% fiber splitter. One of the outputs of the splitter is connected to the fiber positioned over the can-tilever. The other output is connected to the reference photo-diode. The reference photodiode signal measures the power of the laser and, multiplied by a suitable factor, is subtracted from the interference pattern recorded by the signal photodi-ode. This helps to subtract out any laser noise.
Of the light that exits the splitter toward the cantilever, a portion reflects back from the end of the fiber while the re-maining intensity exits to reach the cantilever, where it is reflected and can couple back into the fiber. Multiple reflec-tions can occur between the fiber end and the cantilever. The light that returns from the cantilever again passes through the 2⫻2 splitter and 50% of it is directed toward the signal photodiode, while the rest is lost. At the cantilever, the inter-ference of the primary with the multiply reflected beams gen-erates a current at the signal photodiode共Fig. 5兲, which is extremely sensitive with respect to fiber-cantilever distance. To improve sensitivity, the end of the fiber is cleaved with a precision fiber cleaver36to give 3%–4% reflectivity. It is then coated with Si and a protecting layer of gold to help prevent the oxidation of Si. Typically we obtain reflectivity of order of 25%–30% using a thermal evaporator.
V. AFM NOISE AND SENSITIVITY
The performance of an AFM is due to its ability to mea-sure small deflections or changes in amplitude above the noise floor of the instrument. Noise is mainly due to the thermal motion of the cantilever, vibrational, and acoustic noise from the environment, as well as electronic noise in the
amplifier circuits. Giessibl37 and Hembacher et al.38 have provided a method to measure the real sensitivity and the total integrated noise figure of AFM instruments. The noise figure ultimately determines the deflection resolution of the instrument.38
The AFM sensor sensitivity is defined by the voltage generated by a certain deflection above the noise floor of the instrument. This value can be determined from a spectral density graph of the thermally activated cantilever motion in the vicinity of the cantilever resonance. Figure 6 shows a typical power spectral density共V /
冑
Hz兲 of a cantilever with stiffness 1.67 N / m measured in air in our instrument. This spectrum is fitted to a simple harmonic oscillator model with white noise and 1 / f background:V共f兲 =
冑
C fp+ Unoise 2 + Vsensor 2冉
1 − f 2 f02冊
2 +冉
f Qf0冊
2. 共1兲Here C is a constant and p is a power close to 1共1.3 in our case兲 describing the “1/ f” noise. The fit yields values for the quality factor Q, resonance frequency f0, and white floor noise Unoise. In the data presented by Hembacher et al.38for
FIG. 5. Schematic view of fiber interferometer.
FIG. 6. Voltage noise density vs frequency in the vicinity of the resonance peak. Fitting this graph to a harmonic oscillator with noise floor, Unoise, a
sensitivity of 409.1V / pm and an integrated noise density of 572.0 fm/冑Hz was determined, which is highly improved over conventional laser deflection systems.
their qPlus sensor no 1 / f noise seemed to be present. In our case we had to add this term to reflect the observed slope of the noise background versus frequency.
The signal generated in terms of voltage due to thermal activation, Vthermal, is obtained by subtraction of the noise floor共1/ f and thermal noise Unoise兲 from the fitted curve and integration over the measured bandwidth. The thermal fluc-tuation of the cantilever deflection具zthermal典 is calculated by using the equipartition theorem which equates kBT / 2 to
ev-ery quadratic degree of freedom. Hence zthermal=
冑
kBT / kL,where kBis Boltzmann’s constant, T is temperature, and kLis
cantilever stiffness. The sensitivity then becomes
S = Vthermal
具zthermal典. 共2兲
For comparison of different force sensors the spectral amplitude noise density is calculated by dividing the noise floor by the sensitivity
z
˜ =Unoise+
冑
C/fp
S . 共3兲
This formula was modified from Ref. 38 to include the 1 / f noise. As quoted in Ref. 38 a conventional beam deflec-tion system provides a sensitivity, S, of the order of 1.6V / pm and a noise figure z˜ of 2400 fm/
冑
Hz. Our mea-surement yielded a sensitivity above the noise floor of 409.1V / pm, i.e., an improvement of 255⫻ and a noise figure of 572.0 fm/冑
Hz, i.e., more than 4⫻ lower compared to the quoted beam deflection system, even though a lever of comparable stiffness was used. Compared to the qPlus sensor of Hembacher et al.,38 which has much lower thermal noise due to the large cantilever stiffness of 1800 N / m, our system provided a 23-fold improvement of sensitivity. On the other hand, the noise in our system was higher by a factor of 3.6. However, considering that the thermal noise is proportional to the square root of the lever stiffness, we should have ex-pected an increase in the noise of the order of冑
1800/ 1.67 = 32.8. This shows that the noise floor of our instrument is very low and should allow for measurements of very small changes in amplitude. This is evident in the fact that we are able to directly measure density fluctuations in confined wa-ter layers共see the following兲 at angstrom level amplitudes.The theoretical limit of the drive amplitude of the ther-mal noise共as opposed to the actual, resonance enhanced am-plitude of the lever at resonance,具zthermal典兲 is given by37
Athermal=
冑
4KBTKLQ
. 共4兲
Using the parameter values obtained from our fit this gives 24.3 fm/
冑
Hz at the lever resonance. The measured value of the amplitude noise floor at resonance, z˜, contains all sourcesof noise in the system. Consequently it is higher than the theoretical thermal noise limit.
Our experiments are performed far below the resonance in order to simplify data interpretation and to keep ampli-tudes low共i.e. avoiding resonance enhancement of the am-plitude兲. This puts even more stringent requirements on the AFM than on-resonance measurement methods. This is
be-cause the thermal and 1 / f noise density will be higher at lower frequencies. Therefore, it is difficult for conventional AFM to measure at low frequencies. In our experiments 共de-scribed below兲, the amplitude noise density was measured to be 650 fm/
冑
Hz at 400 Hz far below the resonance of 59.6 kHz. This noise figure, although slightly higher than z˜,is still very low and allows measurements of molecular water layers.
VI. OPERATION OF THE AFM
The prime aim of developing this instrument was to make linear force measurement in liquids using off-resonance frequencies and small amplitudes. Sufficiently stiff levers are used to avoid mechanical instabilities. The cantilevers used in the experiments presented below had stiffness values of 0.65 N / m. Typically, cantilevers have a 50 Å thick aluminum or gold reflective coating when pur-chased from the manufacturer. We coat the backside of these levers with an additional 100 nm of gold to further improve reflectivity of the infrared light we use. After mounting the liquid cell on the scanner piezo, the cantilever is put in place and the five axis fiber slider is used to align the fiber on the cantilever. The fine positioning is done with help of a joy-stick. Once the alignment is completed, the fiber is locked to a position of highest sensitivity 共quadrature point兲 using a feedback loop. The cantilever is then oscillated at a few hun-dred Hz, which is well below the resonance frequency. Ini-tially the sample approach is done using hammer piezo coarse approach. The liquid to be investigated is filled in the liquid cell using a glass syringe.
Unlike in UHV or air environments with similar detec-tion mechanism, care has to be taken not to disturb the align-ment while filling the cell with liquid. We use both nonpolar organic as well as polar liquids like water. These liquids have very different refractive indices compared to air 共where alignment for optimum signal is done兲. This induces either reduction or enhancement in the signal after introducing the liquid in the gap between the cantilever and fiber end. We observed that for water the signal sensitivity typically in-creases by about 30%. On the other hand for organic liquid like OMCTS it decreases by about 25%. Sometimes the cap-illary forces disturb the alignment while filling the cell with liquid. The quadrature lock is kept on while filling in the liquid so that such drifts do not disturb the alignment too significantly causing the signal to be lost altogether. A minor alignment procedure is required afterwards to regain the same sensitivity.
When the cantilever is close to the surface the approach is done using computer-controlled auto approach. The auto approach works by sending a pulse to the hammer piezo and then performing a z scan with the scanner piezo. Once the tip is engaged with the surface the feedback is suspended and the software is used for obtaining force distance curves. The software and electronics for the operation were purchased from Nanomagnetics Instruments39 and have been described in Ref. 26. The amplitude and phase of the cantilever oscil-lations are measured with a lock-in amplifier. For repeating the measurements on the same liquid or starting a set of
experiments the fiber slider can be lifted and taken out. Then we remove the cantilever mount from the setup. Finally the liquid cell can be detached from the magnets holding it to the scanning piezo.
Owing to the small amplitudes and off-resonance opera-tion, our measurements are performed in the linear regime. Thus, the changes in amplitude and phase upon approach can be related to interaction stiffness and damping coefficient through these simple equations:40
k = kL
冉
A0 A cos− 1冊
共5兲 and ␥= −kLA0 A sin, 共6兲where k is interaction stiffness, kLis cantilever stiffness, A0 is free amplitude, A is the amplitude of the cantilever, is the phase difference between the cantilever end and the piezo actuator, and␥is the damping coefficient.
VII. EXPERIMENT
We have previously reported measurements of molecular ordering of water.17 These measurements were performed with a previous 共unpublished兲 version of a similar instru-ment, which was very cumbersome to use. The version re-ported on here is much easier to use and has yielded results of similar quality in much shorter time. With this and im-proved AFM, we carried out initial benchmark experiments to measure solvation forces in OMCTS and water. Future experiments with this instrument will explore the dynamic behavior of these layered liquid systems in more detail as was previously possible.
OMCTS is often chosen for liquid ordering experiments because of its globular shape with a mean diameter of about 9 Å and its nonpolar nature. There are many other reports in the literature on measurement of solvation forces in OMCTS confined between two surfaces using SFA and AFM.13,14,20,41 OMCTS was purchased from Sigma-Aldrich.42Before every experiment, we filtered the liquid to ensure that it is free from any contaminants. The filtration process involves put-ting molecular sieves in OMCTS overnight which absorb water from the OMCTS and then passing it through a syringe filter with 0.02m pore size. In the present experiment the measurements were performed with 0.65 N / m silicon canti-levers purchased from MicroMasch.43 We used a measure-ment frequency of 400 Hz which is well below the resonance frequency in the liquid of 10.3 kHz. The sample was silicon covered with a thin and smooth oxide layer prepared by the following treatment: A 1
⬙
⫻1⬙
piece of Si共100兲 wafer was put in a hydrogen peroxide and sulfuric acid bath共1:3 pro-portion兲 and heated to 100 °C for 20 min. The wafer was rinsed with deionized water and kept in an oven at 120 ° C overnight to remove any water remaining on the surface. For experiments in water we used mechanically cleaved, atomi-cally flat mica as substrate.VIII. RESULTS AND DISCUSSION
Figure 7 shows the stiffness as well as damping coeffi-cient versus separation data measured with a 4.4 Å free am-plitude which is smaller than the size of OMCTS molecules. The speed of approach-retract was 9 Å / s. As can be seen in Fig. 7, the average separation between peaks is 10.2 Å. An attractive background is seen in the stiffness curve. The damping coefficient and stiffness are out of phase in this experiment. The sample used is silicon oxide prepared by the method described in previous section.
In the field of confined liquids there is a general dis-agreement regarding the state of confined liquid 共solid, liq-uid, or viscoelastic兲44,45
and its mechanical properties. Using this instrument we can make continuous, simultaneous, and direct measurement of damping coefficient and stiffness which, through a suitable model, will lead to useful informa-tion about the dynamics of the confined liquids.
The other liquid under investigation was water. As shown in Fig. 8 we observed four peaks in the stiffness-separation curve measured on a confined water film. The
FIG. 7. Junction stiffness and damping coefficient vs separation for a silicon oxide substrate immersed in OMCTS. The free amplitude of the cantilever was 4.4 Å. The stiffness was calculated from Eq.共5兲 and the damping from equation共6兲. Clear stiffness and damping coefficient oscillations can be seen with an average separation of 10.2 Å, consistent with the size of the OM-CTS molecule. The stiffness and damping coefficient are out of phase.
FIG. 8. Junction stiffness versus separation graph for a mica substrate im-mersed in de-ionized water. The free amplitude of the cantilever was 0.92 Å. Clear stiffness oscillations due to solvation forces can be seen with an av-erage separation of 2.9 Å, consistent with the hydrogen bonding length of water.
amplitude used for these measurements was 0.92 Å. A strong hydrophilic repulsive background was observed due to the mica surface. The average separation between peaks was observed to be 2.9 Å, which is consistent with earlier reports.15,17,21The successful operation in water is promising for further understanding of short range hydrophobic and hydrophilic interactions. A quantitative force measurement of stiffness of water confined within biological membranes such as lipid bilayers is another area where this instrument can make meaningful contributions.
The smallest measurable stiffness, ␦k, in these
experi-ments was found to be about 0.05 N / m using a 0.65 N / m cantilever at 0.92 Å amplitude and 400 Hz oscillation ampli-tude. The lock-in time constant was set to 100 ms. Longer time constants could not be used because of thermal drift in the system. In the presence of water the Q of the lever will be reduced significantly. If we assume a reduction of Q by a factor of about 20共Ref. 46兲 we find a thermal noise density of 2000 fm/
冑
Hz at 400 Hz关Eq. 共4兲 and Ref. 40兴. Thus, un-der these conditions thermal lever noise will overwhelm all other noise sources in our instrument. At a measurement bandwidth of 10 Hz共100 ms time constant on lock-in兲 this causes a 0.067 Å noise in the amplitude signal, which corre-sponds to a smallest measurable stiffness of 0.05 N / m under these conditions—agreeing with the experimentally observed value. Thus we seem to be limited only by thermal noise in our liquid measurements.In conclusion, an atomic force microscope with high sensitivity was developed that allows the use of ultrasmall amplitudes of the order of angstroms in liquid environments. The instrument has been employed to measure oscillatory solvation forces in confined liquids such as OMCTS and water. Extremely small amplitudes and off-resonance opera-tion are key features of this instrument which allows us to perform linear measurements, eliminate potential problems associated with disrupting the liquid layers during measure-ment and avoids extensive de-convolution processes, which would otherwise be necessary to interpret the measured data. The development of this instrument promises to have signifi-cant importance for quantitative measurement of interaction between biological macromolecules and for probing hydro-phobic, hydrophilic interactions in water. The study of con-fined liquids and the interaction between confining surfaces is also important in the field of tribology.
ACKNOWLEDGEMENTS
One of the authors共P.M.H.兲 would like to acknowledge funding by NSF 共MRI Grant No. DBI-0321011, ANESA Grant No. INT-0217789, and CAREER Grant No. DMR-0238943兲. A.O. and P.M.H. would like to acknowledge sup-port through the Turkish Government关TUBITAK Grant No. TBAG-U/50共102T117兲兴 and the National Science Founda-tion for internaFounda-tional collaborative research.
1E. Meyer, Prog. Surf. Sci. 41, 3共1992兲.
2U. Hartmann, Annu. Rev. Mater. Sci. 29, 53共1999兲. 3R. Garcia and R. Perez, Surf. Sci. Rep. 47, 197共2002兲.
4J. L. Alonso and W. H. Goldmann, Life Sci. 72, 2553共2003兲. 5F. J. Giessibl, Rev. Mod. Phys. 75, 949共2003兲.
6N. C. Sanotos and M. A. R. B. Castanho, Biophys. Chem. 107, 133
共2004兲.
7B. Cappella and G. Dietler, Surf. Sci. Rep. 34, 1共1999兲.
8R. W. Carpick and M. Salmeron, Chem. Rev. 共Washington, D.C.兲 97,
1163共1997兲.
9M. Guggisberg, M. Bammerlin, C. Loppacher, O. Pfeiffer, A. Abdurixit,
V. Barvich, R. Bennewitz, A. Baratoff, E. Meyer, and H. J. Güntherodt, Phys. Rev. B 61, 11151共2000兲.
10Peter M. Hoffmann, Steve Jeffery, John Pethica, H. Ö. Özer, and A. Oral,
Phys. Rev. Lett. 87, 265502共2001兲.
11N. A. Burnham and R. J. Colton, J. Vac. Sci. Technol. A 7, 2904共1989兲. 12C. M. Mate, G. M. Macclelland, R. Erlandsson, and S. Chaing, Phys. Rev.
Lett. 59, 1942共1987兲.
13S. J. O’Shea, M. E. Welland, and T. Rayment, Appl. Phys. Lett. 60, 2356
共1992兲.
14S. J. O’Shea and M. E. Welland, Langmuir 14, 4186共1998兲.
15S. P. Jarvis, T. Uchihashi, T. Ishida, H. Tokumoto, and Y. Nakayamam, J.
Phys. Chem. B 104, 6091共2000兲.
16Wenhai Han and S. M. Lindsay, Appl. Phys. Lett. 72, 1656共1998兲. 17S. Jeffery, P. M. Hoffmann, J. B. Pethica, C. Ramanujan, H. Ö. Özer, and
A. Oral, Phys. Rev. B 70, 054114共2004兲.
18J. Van Alsten and S. Granick, STLE Tribol. Trans. 33, 456共1990兲. 19J. L. Finney, Faraday Discuss. 103, 1共1996兲.
20J. N. Israelachvili, Intermolecular and Surface Forces共Academic,
Lon-don, 1992兲.
21J. N. Israelachivili and R. M. Pashley, Nature共London兲 306, 249 共1983兲. 22Y. Martin, C. C. Williams, and H. K. Wickramasinghe, J. Appl. Phys. 61,
4723共1987兲.
23T. R. Albrecht, P. Grütter, D. Horne, and D. Rugar, J. Appl. Phys. 69, 668
共1991兲.
24D. Rugar, H. J. Mamin, and P. Guethner, Appl. Phys. Lett. 55, 2588
共1989兲.
25P. M. Hoffmann, A. Oral, R. A. Grimble, H. Ö. Özer, S. Jeffery, and J. B.
Pethica, Proc. R. Soc. London 457, 1161共2001兲.
26A. Oral, R. A. Grimble, H. Ö. Ozer, and J. B. Pethica, Rev. Sci. Instrum. 74, 8, 3656共2003兲.
27D. W. Pohl, Rev. Sci. Instrum. 58, 54共1987兲.
28Ch. Renner, Ph. Niedermann, A. D. Kent, and Ø. Fisher, Rev. Sci.
Instrum. 61, 965共1990兲.
29C. N. Woodburn, A. W. McKinnon, D. A. Roberts, M. E. Taylor, and M.
E. Welland, Meas. Sci. Technol. 4, 535共1993兲.
30B. L. Blackford and M. H. Jericho, Rev. Sci. Instrum. 68, 133共1997兲. 31EBL No 2 piezotube, 12.7 mm o.d.⫻1 mm wall thickness 25.4 mm long
Staveley Sensors Inc., 91 Prestige Circle, East Harford, CT.
32EBL No. 2 piezotube, 6.3 mm o.d.⫻1 mm wall thickness, 25.4 mm long
Staveley Sensors Inc., 91 Prestige Circle, East Harford, CT.
33Vibration Isolation from minus-K Technologies, 420 S Hindry Ave., Unit
E Englewood, CA 90301.
34EBL no 2 shear plates, Staveley Sensors Inc., 91 Prestige Circle, East
Hartford, CT.
35EBL No.1 piezotube 3.18 mm o.d.⫻0.38 mm wall thickness, 12.7 mm
long, Staveley Sensors, Inc., 91 Prestige Circle, East Hartford, CT.
36Metrotek, 6880, 46th Ave. North Suite 100, St, Petesburg, FL. 37F. J. Giessibl, thesis, University of Augsburg, Germany共2000兲. 38S. Hembacher, F. J. Giesibl, and J. Mannhart, Appl. Surf. Sci. 188, 445
共2002兲.
39Nanomagnetics Instruments Ltd., 17 Croft Road, Oxford OX3 0JZ, UK,
http://www.nanomagnetics-inst.com.
40P. M. Hoffmann, Small-Amplitude Atomic Force Microscopy in Dekker
Encyclopedia of Nanotechnology共Dekker, New York, 2004兲, p. 3641.
41S. J. O’Shea, M. E. Welland, and J. B. Pethica, Chem. Phys. Lett. 223,
336共1994兲.
42Sigma-Aldrich Corp. St. Louis, MO.
43Cantilevers from µmasch, 7086 SW Beveland Road, Portland, OR. 44J. Klein and E. Kumacheva, J. Chem. Phys. 108, 6996共1998兲. 45A. L. Demirel and S. Granick, J. Chem. Phys. 115, 1498共2001兲. 46D. A. Walters, J. P. Cleveland, N. H. Thompson, P. K. Hansma, M. A.