Population-based assessment of gastrointestinal symptoms
and diseases: Cappadocia Cohort, Turkey
Orhan Sezgin1 , Hale Akpınar2 , Birol Özer3 , Murat Törüner4 , Kadir Bal5 , Serhat Bor6 1Department of Gastroenterology, Mersin University School of Medicine, Mersin, Turkey
2Department of Gastroenterology, Dokuz Eylül University School of Medicine, İzmir, Turkey 3Department of Gastroenterology, Başkent University School of Medicine, Ankara, Turkey 4Department of Gastroenterology, Ankara University School of Medicine, Ankara, Turkey
5Department of Gastroenterology, İstanbul Üniversitesi-Cerrahpaşa, Cerrahpaşa School of Medicine, İstanbul, Turkey 6Department of Gastroenterology, Ege University School of Medicine, İzmir, Turkey
ABSTRACT
Background/Aims: The aim of this study was to determine the prevalence of symptoms and diseases of the lower and upper gastroin-testinal system (GIS) in a population-based sample.
Materials and Methods: The cross-sectional cohort study was conducted in Cappadocia cohort comprising the Gülşehir and Avanos districts. The “Gastrointestinal Symptom Questionnaire” was applied to persons over the age of 18 years.
Results: The GI Symptom Questionnaire was applied to 3369 subjects, and height and body weight were measured in 2797 consenting subjects. Of the participants, 61% were female and the mean patient age was 50±15 years. At least one GI symptom was present in 70.6% of the cohort. The most common upper GI symptoms were gastric bloating (31.0%) and heartburn (29.1%). The most common lower GI symptom was abnormal defecation (33.5). The prevalence of upper GIS and lower GIS diseases was 32.7% and 12.9%, respec-tively, and the prevalence of togetherness of upper and lower GIS diseases was 9.9%. Prevalence of GIS disease was approximately 3 times higher in females (p<0.001). All of the upper and lower GI symptoms and the prevalence of upper GIS disease increased in line with Body mass index (BMI).
Conclusion: This first population-based, cross-sectional cohort study revealed that the prevalence of GIS diseases is critically high for optimal public health. Special attention must be paid to these diseases while planning health policies and reimbursements.
Keywords: Epidemiology, gastrointestinal diseases, gastrointestinal symptoms, disease burden, Turkey
INTRODUCTION
We observe that gastrointestinal system (GIS) diseases are a significant public health problem in Turkey. Unfor-tunately, large-scale population-based studies are lack-ing in this regard, except for some small-scale studies as-sessing the prevalence of digestive system diseases and symptoms (1-5). However, most of these studies focused on a single disease.
Knowing the prevalence of gastrointestinal diseases in the population is very important to determine the targets that healthcare professionals need to focus on, to use the sources accurately and to guide health policy makers. To-day, the data that we use to guide us are limited to the hospital-based records of documented diseases or small-scale screening and assessment studies. These data are in-adequate to draw conclusions for an entire population, but
they are enough to provide a rough estimate. In fact, stud-ies from Western Europe and USA that were performed in general populations revealed that 25%-40% of those populations experience dyspeptic symptoms at least once a year (6). This is also a frequent cause of consultations in general practice and is assumed to account for 1%-4% of overall consultations and 6% of polyclinic visits. Similarly, screening for gastroesophageal reflux in Turkey revealed a prevalence rate of 23% (3). The prevalence of irritable bowel syndrome shows variations worldwide (1.1% to 45.0%) and the meta-analysis of 80 different study pop-ulations composed of 260.960 subjects reported a pooled prevalence of 11.2% (7). Although the prevalence rate for each disease is known partially, a population-based study evaluating the diseases together is lacking. In addition, given that conducting a study with a sample from whole country is difficult, the cross-sectional choice of a region Cite this article as: Sezgin O, Akpınar H, Özer B, Törüner M, Bal K, Bor S. Population-based assessment of gastrointestinal symptoms and diseases: Cappadocia Cohort, Turkey. Turk J Gastroenterol 2019; 30(12): 1009-20.
Corresponding Author: Orhan Sezgin; [email protected]
Received: October 26, 2019 Accepted: November 10, 2019 Available online date: December 03, 2019 © Copyright 2019 by The Turkish Society of Gastroenterology • Available online at www.turkjgastroenterol.org DOI: 10.5152/tjg.2019.19882
as representative of the whole country is a method that may lead to generalization of the results.
This study was designed in a population-based sample size representing the whole country to determine the prevalence of the most frequent upper and lower gastro-intestinal (GI) symptoms and potential GIS diseases. MATERIALS AND METHODS
The study is a prospective, cross-sectional cohort study and was conducted in “Cappadocia Cohort” comprising the Avanos and Gülşehir cities of the Nevşehir prov-ince, that has been proven to represent Turkey exactly in terms of distribution of population. These cities have been previously chosen by the Turkish Association of In-ternal Medicine because of their low immigration rate and geographical closeness to Ankara, the capital of Turkey (8). Another factor that plays a role in choosing these two cities was that they do not show major economic or so-cial dependency in spite of their closeness to Ankara. The economy of Gülşehir is based on agriculture, whereas the economy of Avanos is primarily based on tourism. Writ-ten approval was obtained from the Dokuz Eylül Univer-sity Ethics Committee for Non-Interventional Research-es (No: 363, Date: April 12, 2018) and from the Nevşehir Provincial Directorate of Health to perform this study. Adult volunteers at and over the age of 18 years, who were living in Avanos or in Gülşehir, were enrolled in the study between October 2017 and July 2018. The study was announced in the cities by informing the district health directorate, district governorship, and municipality and primary care clinics in each city. Within this scope, information and invitation leaflets and posters were pre-pared and delivered and announced at the central points of these cities. The people who agreed to participate in the study after the announcement were invited to the study offices to complete the questionnaires and to have their anthropometric measurements (height and weight) recorded. Measurements were performed at the study office of the Turkish Association of Internal Medicine in Gülşehir and at the Avanos District Integrated Hospital. The “Gastrointestinal Symptom Questionnaire” (9) (see Appendix) composed of 16 questions for upper GIS and 18 questions for lower GIS was applied to the volunteers via telephone interview by the employees of the con-tracted research company (Omega CRO, Ankara, Turkey). The questionnaire was applied by the interviewers via face-to-face interview to the volunteers who visited the study office.
Using this questionnaire, the demographic characteris-tics (age, gender, place of birth), lifestyle characterischaracteris-tics [smoking status (cigarette or cigar smokers regardless of the amount), alcohol consumption (females ≥14 units/ week, males ≥21 units/week), excessive coffee consump-tion (≥6 units/day)], and medicaconsump-tions [aspirin, non-steroid anti-inflammatory drug (NSAID), proton pump inhibitor (PPI), and histamine 2 receptor antagonist (H2RA)] were recorded.
Both upper GI symptoms (epigastric pain, heartburn, re-gurgitation, gastric bloating, sensation of hunger, nausea, vomiting, early satiety, post-prandial fullness, belching, dysphagia, and halitosis) and lower GI symptoms (abdom-inal rumbling, abdom(abdom-inal pain, abdom(abdom-inal bloating, and abnormal defecation) were inquired into. The volunteers were asked to report the symptoms they experienced in the last 1 month. They were asked to rate the severi-ty of their symptoms as per the following scale: 0=none; 1=almost none; 2=slight; 3=mild; 4=moderate; 5=severe; 6=very severe. If the symptom severity was ≥2 on 6-item scale, it was considered as the presence of a symptom, and if there were at least 3 symptoms, it was considered as the presence of disease.
Body mass index (BMI) was evaluated in three groups as <25 kg/m2 (lean+normal), 25-29.9 kg/m2 (overweight),
and ≥30 kg/m2 (obese).
Statistical analysis
PASW Statistical Package for Social Sciences Version 18.0 program (SPSS Inc.; Chicago, IL, USA) for Windows was used for the statistical analyses. Descriptive statistics were presented as number and percentage for the cate-gorical variables and as mean±standard deviation, median, and percentile 25-75 (Q1-Q3) for the numerical variables. Whether the variables are suitable for normal distribu-tion was investigated by visual (histogram and probabili-ty graphs) and analytic methods (Kolmogrov-Simirnov/ Shapiro-Wilk tests). The Chi-squared test was used for paired and multiple comparisons between the categorical variables of upper and lower GI symptoms, whereas the Fisher’s exact test was used where the Chi-squared test was not applicable. Paired group comparisons of numerical variables were done by the Student’s t-Test and multiple group comparisons were done by the ANOVA test in case of normally distributed data. For non-normal data distribu-tion, the Mann-Whitney U test was used for paired group comparisons and Kruskal-Wallis test was used for multiple group comparisons. Logistic regression analysis was per-formed using a model created with gender, age, BMI, and
NSAID or aspirin usage parameters to determine the risk factors for upper GIS, lower GIS, and upper or lower GIS diseases. Situations with a type-1 error smaller than 5% were considered statistically significant.
RESULTS
The total population of Avanos and Gülşehir cities in 2018 was 25502; we contacted a total of 5042 subjects among the Cappadocia cohort of 10980 subjects and applied the GI Symptom Questionnaire to a total of 3369 among the 4605 subjects who met the study inclusion criteria. The remaining 1236 refused to participate in the study. Of the subjects to whom the questionnaire was applied, 2797 visited the study offices for physical measurements (height and weight) (Figure1).
Of the 3369 study participants, 2056 (61%) were fe-male and the mean patient age was 50±15 years. The characteristics of the participants according to the cit-ies are demonstrated in Table 1. Around 24% of the par-ticipants (n=807) were current smokers, 10.9% (n=367) were ex-smokers, and 65.1% (n=2190) were nonsmok-ers. Only 5.2% (n=176) of the participants were alcohol consumers. Excessive coffee consumption was deter-mined in 193 (5.7%) participants. With respect to the medications, 486 (14.4%) participants had been re-ceiving aspirin, 1283 (38.2%) had been rere-ceiving NSAID, 856 (25.5%) had been receiving PPI, and 206 (6.2%) had been receiving H2RA. The mean BMI of the study cohort was 29.7±5.6 kg/m2 with BMI being <25 kg/m2 in 19.6%,
25-29,9 kg/m2 in 35.2%, and ≥30 kg/m2 in 45.2%
(Ta-ble 1) of the participants. There was significant
relation-ship between BMI and age groups (p<0.001). Regarding the distribution of BMI among age groups, the percent-age of those with BMI <25 kg/m2 was higher in the 30
to 39-year-old age group, whereas the percentage of those with BMI= 25-29.9 kg/m2 and those with BMI ≥30
kg/m2 was higher (26.1% and 35.5%, respectively) in the
50 to 59-year-old age group.
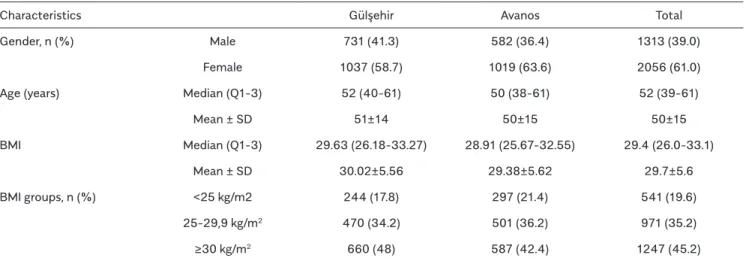
Table 1. Descriptive characteristics of study population.
Characteristics Gülşehir Avanos Total
Gender, n (%) Male 731 (41.3) 582 (36.4) 1313 (39.0) Female 1037 (58.7) 1019 (63.6) 2056 (61.0) Age (years) Median (Q1-3) 52 (40-61) 50 (38-61) 52 (39-61)
Mean ± SD 51±14 50±15 50±15 BMI Median (Q1-3) 29.63 (26.18-33.27) 28.91 (25.67-32.55) 29.4 (26.0-33.1) Mean ± SD 30.02±5.56 29.38±5.62 29.7±5.6 BMI groups, n (%) <25 kg/m2 244 (17.8) 297 (21.4) 541 (19.6) 25-29,9 kg/m2 470 (34.2) 501 (36.2) 971 (35.2) ≥30 kg/m2 660 (48) 587 (42.4) 1247 (45.2)
BMI: Body mass index; Q1-Q3: percentile 25-75; SD: standard deviation.
Figure 1. Establishing the study cohort.
Cappadocia Cohort (Gulsehir + Avanos) n=10980 Contacted Subjects n=5042 Eligible Subjects n=4605 Refused to participate n=1236 GI Symptom Questionnaire n=3369 Physical Measurements n=2797
Prevalence of GIS symptoms
Presence of at least one symptom was determined in a to-tal of 2378 (70.6%) participants, of whom 827 were male (63% of overall males) and 1551 were female (75.4% of overall females). There were 991 (29.4%) participants with no symptom, of whom 486 were male and 505 were female. The most common upper GIS symptom was gastric bloating (31.0%) followed by heartburn (29.1%), belch-ing (23.8%), gastric pain (21.4%), and halitosis (19.7%) (Table 2). All the GIS symptoms were significantly more prevalent in females (p<0.001 for each).
The most common lower GIS symptoms in the order of frequency were: abnormal defecation (33.5%), ab-dominal rumbling (24.2%), abab-dominal bloating (22.2%), and abdominal pain (16.2%) (Table 2). All the lower GIS symptoms were significantly higher in females (p<0.001 for each). Incidence of mucous stools, diarrhea, hard or
loose stools, constipation, painful defecation, strong urgency, incomplete discharge, and fatty stools were also higher in females than in males (p=0.022, p<0.001, p=0.021, p<0.001, p<0.001, p<0.001, p<0.001, p<0.001, and p=0.015, respectively). Regarding the distribution of only the parameters of abnormal defecation among gen-ders, 2.6% of the males experienced bloody stool with no significant difference as compared to females (2.7%) (p=0.876).
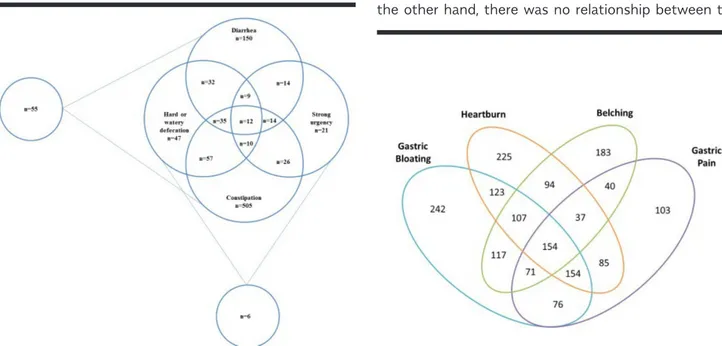
Overlapping symptoms
With regard to the togetherness of upper and lower GI symptoms, it was determined that abnormal defeca-tion and rumbling were most commonly seen together, independent from the type of upper GIS symptom. Ab-normal defecation parameters and their intersections are demonstrated in Figure 2. Constipation was most frequently seen in the abnormal defecation group, but different forms of defecation were often seen together. Table 2. Prevalence of upper and lower gastrointestinal symptoms.
Symptoms Total n (%) Male n (%) Female n (%) p*
Upper Gastrointestinal Symptoms
Gastric bloating 1044 (31) 288 (21.9) 756 (36.8) <0.001 Heartburn 979 (29.1) 327 (25.0) 652 (31.7) <0.001 Belching 803 (23.8) 257 (19.6) 546 (26.6) <0.001 Gastric pain 720 (21.4) 172 (13.1) 548 (26.7) <0.001 Halitosis 663 (19.7) 219 (16.7) 444 (21.6) <0.001 Sensation of hunger 591 (17.6) 169 (12.9) 422 (20.6) <0.001 Post-prandial fullness 481 (14.3) 139 (10.6) 342 (16.7) <0.001 Nausea 453 (13.5) 71 (5.4) 382 (18.6) <0.001 Regurgitation 422 (12.7) 120 (9.2) 302 (14.9) <0.001 Early satiety 308 (9.2) 83 (6.3) 225 (11.0) <0.001 Dysphagia 247 (7.3) 64 (4.9) 183 (8.9) <0.001 Vomiting 159 (4.7) 24 (1.8) 135 (6.6) <0.001
Lower Gastrointestinal Symptoms
Abnormal defecation 1125 (33.5) 347 (26.5) 778 (37.9) <0.001 Abdominal rumbling 816 (24.2) 268 (20.4) 548 (26.7) <0.001 Abdominal bloating 746 (22.2) 226 (17.2) 520 (25.4) <0.001 Abdominal pain 544 (16.2) 131 (10) 413 (20.2) <0.001
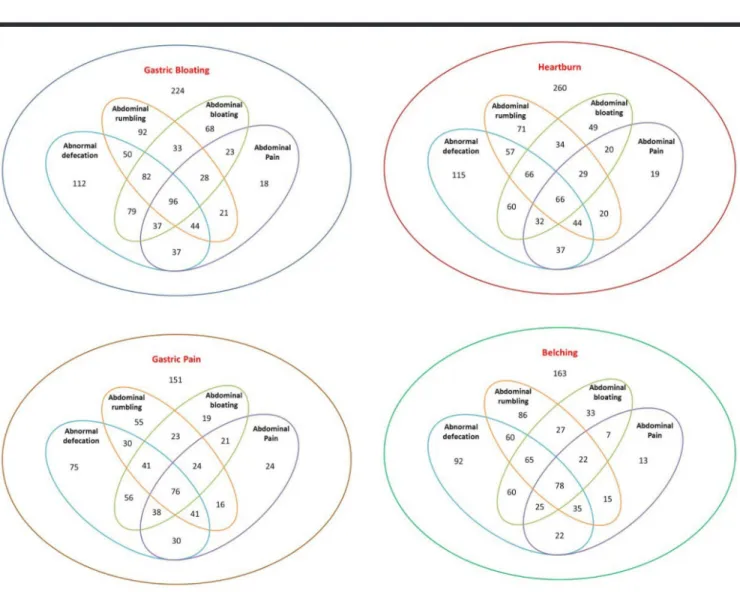
Similarly, upper and lower GIS symptoms could be seen together (Figure 3, 4).
Prevalence of GIS diseases
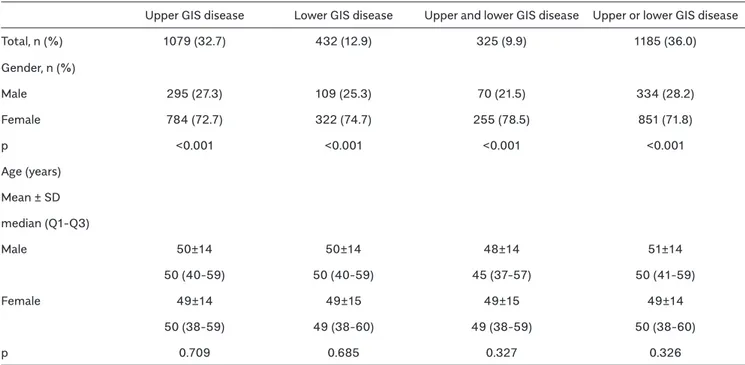
Evaluating the diseases individually, the prevalence of upper GIS diseases was found to be 32.7% while that of lower GIS diseases was found to be 12.9%. The frequency of occurrence of upper and lower GIS diseases togeth-er was 9.9%, and 36% of the participants had at least one upper or lower GIS disease (Table 3). Considering the genders, the prevalence of upper GIS disease, lower GIS disease, their togetherness, or presence of any one of them was nearly 3 times higher in females, which was significantly higher than that of males (p<0.001 for each) (Table 3). The prevalence of both the upper (22.4% and 41.8%, respectively) and lower (9.5% and 16.0%, respec-tively) GIS diseases was higher in Gülşehir as compared to Avanos (p<0.001 for both).
Relation of the prevalence of symptoms and diseases with age
Evaluating all of the symptoms together, it was found that the prevalence of upper GIS diseases decreased with age (p=0.008). An individual evaluation of the symptoms re-vealed that, in terms of upper GIS symptoms, heartburn (p=0.028), sensation of hunger (p=0.005), early satiety (p=0.005), post-prandial fullness (p<0.001), and halitosis (p=0.001) decreased with age. As for lower GI symptoms, belching (p<0.001) and gastric bloating (p<0.001) increased
with age. Lower GIS symptoms did not change with age (p=0.242). However, individual evaluation of the symptoms revealed that abdominal bloating (p=0.004) and abdominal pain (p=0.028) (lower GIS symptoms) decreased with age. Relation of the prevalence of symptoms and diseases with BMI
The prevalence of upper GIS diseases was significantly high-er in those with BMI of 25-29.9 kg/m2 and with BMI ≥30
kg/m2 (p<0.001), whereas no significant relationship was
found between the prevalence of lower GIS diseases and BMI (p=0.136) (Figure 5). Overall, the upper and lower GIS symptoms increased with BMI and the increment was high-er particularly in those with BMI ≥30 kg/m2 (Table 3). Among
the upper GIS symptoms, gastric bloating, heartburn, belch-ing, nausea, and regurgitation increased remarkably with increase in BMI (both in overweight and obese subjects) (p<0.001 for each). Sensation of hunger and post-prandial fullness were significantly more prevalent in obese subjects (p=0.005 and p=0.042, respectively). Regarding abnormal defecation parameters, constipation was significantly more common in those with BMI ≥ 30 kg/m2 (p=0.017).
Relation of symptoms and diseases with smoking Among the upper GIS symptoms, only post-prandial full-ness was higher in smokers vs. nonsmokers (p=0.018). There was no other difference between the smokers and nonsmokers, except in terms of this symptom. Lower GIS symptoms showed no relationship with smoking. On the other hand, there was no relationship between the
prevalence of upper and lower GIS disease and smoking (p=0.722 and p=0.593, respectively).
Aspirin, NSAID, PPI, and H2RA usage in those with GIS disease
The prevalence of upper GIS disease was 15.3% in aspi-rin users, 45.2% in NSAID users, 45.3% in PPI users, and 12.2% in H2RA users, whereas the prevalence of lower GIS disease was 15.3%, 18.4%, 47.3%, and 12.0%, re-spectively. The relationship between the prevalence of upper and lower GIS diseases and drug usage is demon-strated in Table 4. In the study cohort, 35.9% of the as-pirin users, and 37.8% of the NSAID users were receiving PPI. While aspirin usage was more common in males vs. females (17.5% vs. 12.5%;p<0.001), NSAID (43.1% vs. 30.4%, p<0.001), PPI (29.9% vs. 18.6%, p<0.001), and H2RA (6.9% vs. 5.0%, p=0.024) usage was significant-ly higher in females as compared to males (49.5% and 41.8%, p<0.001).
Figure 4. Intersection of four most common upper gastrointestinal system symptoms with lower gastrointestinal system symptoms.
Figure 5. Relationship between gastrointestinal system diseases and body mass index.
Risk factors
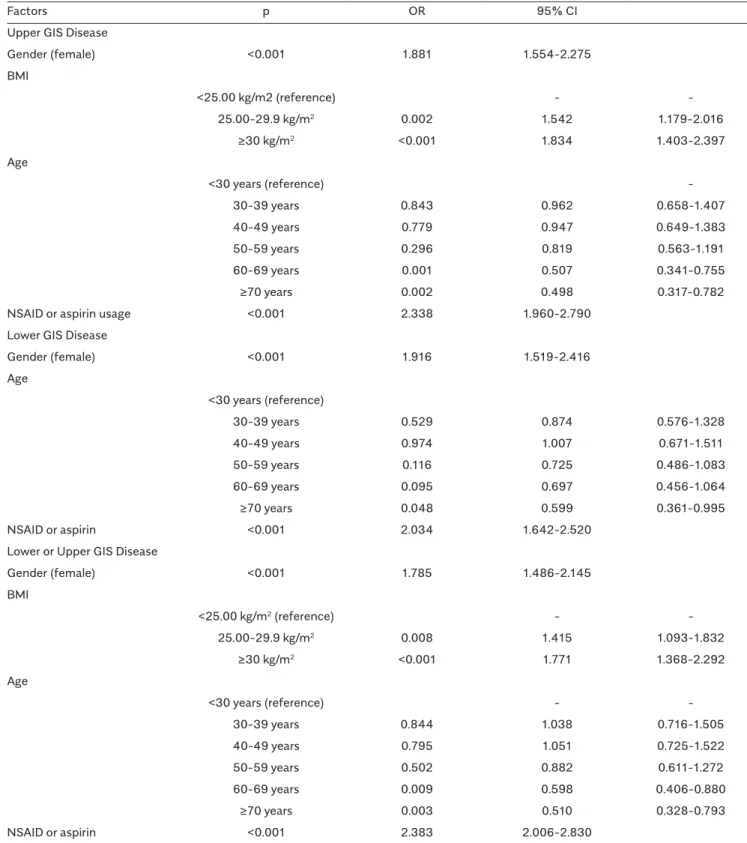
Logistic regression analysis performed by creating a mod-el with the parameters of gender, age, BMI, and NSAID or aspirin usage to determine the risk factors for upper and lower GI symptoms and upper or lower GIS diseases re-vealed that the female gender (p<0.001for all) and NSAID or aspirin usage (p<0.001 for all) were positive risk factors for the occurrence of disease. The age group of 60-69 years was another significant risk factor for both upper GIS diseases and upper or lower GIS disease, whereas an age of ≥70 years was found to be a negative risk factor (p=0.002, p=0.048, p=0.003, respectively). A BMI of 25-29.9 kg/m2 and BMI ≥30 kg/m2 were significant risk
fac-tors for both upper GIS diseases and upper or lower GIS disease. The results of the logistic regression analysis are presented in Table 5.
Discussion
This large population-based study revealed that GI symp-toms are very common, as they were present in nearly 70% of the participants. Symptoms were higher in fe-males than in fe-males. Regarding GIS diseases associated with symptom burden, nearly 1/3rd of the participants had
a burden of upper GIS disease and 1/10th of the
partici-pants had a burden of lower GIS disease. The prevalence of GIS diseases was significantly higher in females.
Table 4. Relationship between the prevalence of upper and lower gastrointestinal system diseases and medications. Drugs
Aspirin NSAID PPI H2RA
Upper GIS Disease 165 (15.3) 573 (45.2) 488 (45.3) 131 (12.2) Lower GIS Disease 66 (15.3) 235 (18.4) 204 (47.3) 51 (12.0) Upper and Lower GIS Disease 52 (16.0) 185 (14.7) 168 (51.7) 45 (14.0) Upper or Lower GIS Disease 179 (15.1) 623 (49.2) 524 (44.3) 137 (11.7)
GIS: Gastrointestinal system; NSAID: Non-steroidal anti-inflammatory drug; PPI: Proton pump inhibitor; H2RA: Histamine 2 receptor antagonist.
Table 3. Relation of the prevalence of upper and lower gastrointestinal system diseases with gender and age.
Upper GIS disease Lower GIS disease Upper and lower GIS disease Upper or lower GIS disease Total, n (%) 1079 (32.7) 432 (12.9) 325 (9.9) 1185 (36.0) Gender, n (%) Male 295 (27.3) 109 (25.3) 70 (21.5) 334 (28.2) Female 784 (72.7) 322 (74.7) 255 (78.5) 851 (71.8) p <0.001 <0.001 <0.001 <0.001 Age (years) Mean ± SD median (Q1-Q3) Male 50±14 50±14 48±14 51±14 50 (40-59) 50 (40-59) 45 (37-57) 50 (41-59) Female 49±14 49±15 49±15 49±14 50 (38-59) 49 (38-60) 49 (38-59) 50 (38-60) p 0.709 0.685 0.327 0.326
Table 5. Risk factors for upper, lower, and upper or lower gastrointestinal system diseases.
Factors p OR 95% CI
Upper GIS Disease
Gender (female) <0.001 1.881 1.554-2.275 BMI <25.00 kg/m2 (reference) - -25.00-29.9 kg/m2 0.002 1.542 1.179-2.016 ≥30 kg/m2 <0.001 1.834 1.403-2.397 Age <30 years (reference) -30-39 years 0.843 0.962 0.658-1.407 40-49 years 0.779 0.947 0.649-1.383 50-59 years 0.296 0.819 0.563-1.191 60-69 years 0.001 0.507 0.341-0.755 ≥70 years 0.002 0.498 0.317-0.782
NSAID or aspirin usage <0.001 2.338 1.960-2.790 Lower GIS Disease
Gender (female) <0.001 1.916 1.519-2.416 Age <30 years (reference) 30-39 years 0.529 0.874 0.576-1.328 40-49 years 0.974 1.007 0.671-1.511 50-59 years 0.116 0.725 0.486-1.083 60-69 years 0.095 0.697 0.456-1.064 ≥70 years 0.048 0.599 0.361-0.995 NSAID or aspirin <0.001 2.034 1.642-2.520 Lower or Upper GIS Disease
Gender (female) <0.001 1.785 1.486-2.145 BMI <25.00 kg/m2 (reference) - -25.00-29.9 kg/m2 0.008 1.415 1.093-1.832 ≥30 kg/m2 <0.001 1.771 1.368-2.292 Age <30 years (reference) - -30-39 years 0.844 1.038 0.716-1.505 40-49 years 0.795 1.051 0.725-1.522 50-59 years 0.502 0.882 0.611-1.272 60-69 years 0.009 0.598 0.406-0.880 ≥70 years 0.003 0.510 0.328-0.793 NSAID or aspirin <0.001 2.383 2.006-2.830
On the other hand, it is known that GI symptoms are frequently difficult localize and that upper and lower GI symptoms are usually found together (10). In the Cappa-docia cohort, the overlaps between both upper and lower GIS symptoms were quite high, and upper GI symptoms were often observed together with abnormal defeca-tion and rumbling, which are lower GI symptoms. Like-wise, overlapping GI symptoms are also prevalent in the US population (11). Nearly 60% of symptomatic subjects experience 2 or more concomitant symptoms (12). Both heartburn/reflux and abdominal pain were seen together with gastric bloating/flatulence, constipation, and diar-rhea in the general population. The results of this study are consistent with the other studies focusing on overlap-ping functional GIS disorders (13,14). For example, Talley et al. (15) investigated an urban Australian population and demonstrated that 57% and 40% of the subjects with irritable bowel syndrome had concomitant dyspepsia and heartburn, respectively.
Although the prevalence rates of the diseases and symptoms show variations among different countries, GI symptoms are very common in the general population and are a frequent cause of consulting a healthcare professional (16). Nearly 40% of the British population reported dyspeptic symptoms (17, 18). In 1992, similar results were obtained in Minnesota. In addition, the prevalence of lower GI symptoms, such as constipation and diarrhea, was 10%-25% (19). Similarly, in the Cappadocia cohort, constipation and diarrhea were the most common lower GIS-associated symptoms. The most common upper GI symptoms were gastric bloating, heart-burn, belching, and gastric pain. In general, abdominal pain is frequently seen despite the differences between the coun-tries (20). Similarly, in the Kalixanda trial from North Sweden, the prevalence of reflux was nearly 40% over a 3-month period (21). A household survey from the US conducted in 1993 by Drossman et al. (13) demonstrated that 69% of the 5430 subjects reported at least one functional GI symptom in the last 3 months. In an upper GI study conducted in USA in 1999, Camilleri et al. (22) evaluated 17484 participants and determined that 45% of the subjects experienced at least one upper GI symptom. Moreover, this study also re-vealed that 82% of the Americans had experienced an upper GI symptom at some point in the same period. Sandler et al. (23) conducted a nation-wide survey in 1997 focusing on the prevalence of abdominal pain, bloating, and/or diarrhea in 2510 participants, of whom 41% reported at least one symptom in the last month.
The results of the Cappadocia Cohort revealed a high burden of GI symptoms in Turkish people, a result that is
similar to that of other studies. The burden of GIS disease was also quite high. Nearly 1/3rd of the Cappadocia cohort
had upper GIS disease, 1/10th had lower GIS disease, and
36% had lower or upper GIS disease. It is of vital impor-tance for health care providers to screen GI symptoms proactively, as these symptoms are very common and may cause significant physical, mental, and social dis-tress (24). Encouraging such subjects to get involved in the health care system and developing strategies to treat them are extremely important, as many of these subjects might have treatable diseases.
The tools most widely used to monitor GI symptoms are questionnaires. Various questionnaires have been devel-oped to assess the frequency and severity of GI symp-toms. They are frequently used in a wide range of fields for survey studies (25-32). The GI Symptom Question-naire used in the present study is apprehensible and has good repeatability in measuring GI symptoms (9).
One of the strongest aspects of this study is that it fo-cused on the prevalence of GI symptoms in the general Turkish population instead of patients seeking a health care service. Prior to this study, there has been no study from Turkey focusing on the prevalence of GI symptoms and the burden of GIS diseases in a population that rep-resents the whole country.
The prescription of PPIs has substantially increased worldwide (33). In addition, the use of gastro-toxic drugs such as NSAIDs has also increased, resulting in increased drug-related gastrointestinal symptoms. In the present cohort, NSAIDs and aspirin usage was quite common and was accompanied by upper GI symptoms and disease burden. PPI usage was also quite high, but H2RA usage was less frequent. Similarly, PPI usage was higher in those with upper GI symptoms and disease burden. It is quite likely that most of the participants had been receiving PPI for upper GI symptoms. Besides, these drugs have most probably also been used to treat lower GIS-related dis-eases and pain. Moreover, as the frequency of aspirin and NSAID usage is very high, gastroprotective drugs might have been started against these drugs and may still be in used (10,34-36).
The prevalence of overweight and obese patients was higher in the Cappadocia cohort. BMI and previous life style habits were found to be associated with the de-velopment of both upper and lower gastrointestinal symptoms such as regurgitation, gastroesophageal re-flux, and altered intestinal movements (37). Studies
evaluating obesity in Turkey reveal that overweight and obesity are common with increasing prevalence in time. The prevalence of obesity was found to be 29.5% in the “Turkey Obesity Profile” trial, which was conducted be-tween 2000 and 2005 by the Association for the Study of Obesity in 13878 subjects over the age of 20 years from 6 provinces (İstanbul, Konya, Denizli, Gaziantep, Kastamonu, and Kırklareli) (38). Again, in 2005, Yumuk et al. (39) determined that the prevalence of obesity in Turkey increased by 17% between 1990 and 2000. In 2009, Işeri et al. (40) found that 42% of the population in the Central Anatolia Region was overweight and 17% was obese. In 2018, we found the prevalence of obesity to be 45% in our study population, which was 3 times higher than the vealue reported by Işeri et al. (40). In the Cappadocia cohort, prevalence of heartburn, regurgita-tion, gastric bloating, nausea, and belching, which are among the upper GI symptoms, significantly increased in line with the BMI. Again, overall lower GI symptoms increased in line with the BMI and were higher in obese subjects. Upper GIS diseases also increased in line with BMI. There was no relationship between the prevalence of lower GIS diseases and BMI. While obesity itself leads to serious health problems, it also causes an increase in the prevalence of upper and lower GI symptoms and up-per GIS diseases.
Tobacco use is quite common in Turkey. A more recent study conducted in 2006 by the General Directorate of the Organizations for Family Researches together with the Turkish Statistical Institute revealed that 33.4% of adults (≥18 years of age) are daily smokers with the ratio being significantly higher in males (50.6%) than females (16.6%) (41). The prevalence of tobacco usage in the Cappadocia cohort was 24%. There was insignificant dif-ference between the smokers and nonsmokers in terms of symptoms, whereas no difference was determined in terms of diseases.
In the present study, it is seen that the symptoms de-creased with age regardless of the gender. Almario et al (11). found similar results in their study, i.e., the prevalence of GI symptoms was lower by 16% and 37% in the 45-64-year and ≥65-year age groups, respectively, as com-pared to the younger subjects. This is consistent with the results of the studies conducted by Drossman and Chang (13,42). They determined that most of the functional GI symptoms decreased with age, with the major exception being fecal incontinence. Sandler The present study has some limitations. The Cappadocia cohort for the burden of GI symptoms and GIS diseases was a cross-sectional
study; i.e., we did not follow the participants for a while to assess the continuity of the symptoms. Another limita-tion is that the findings are associated with generalizabili-ty because the questionnaire was applied mostly via tele-phone call. Nonetheless, in addition to the demographic characteristics that might interfere with the presence of symptoms and diseases, data on BMI, tobacco and alco-hol usage, and medications were also collected. Resolving the impact of these medications on the prevalence of GI symptoms may be difficult (for example, PPI may reduce heartburn/ reflux and abdominal pain but may increase the likelihood of bloating and diarrhea), however, it is an important factor to be taken into account. In addition, the results of the present study are largely consistent with the other population-based studies that have been conducted internationally, which supports the validity of our results (13,22,23,44-53).
In conclusion, in the Cappadocia cohort representing Tur-key in general, we determined that nearly 70% of the pop-ulation had a burden of GI symptoms and that 36% had a burden of GIS disease. Moreover, females and overweight people were more symptomatic and more likely to fall ill. Ethics Committee Approval: Ethics committee approval for this
study was received from the Dokuz Eylül University Ethics Commit-tee for Non-Interventional Researches (Decision No: 363, Decision Date: April 12, 2018) and from the Nevşehir Provincial Directorate of Health.
Informed Consent: Written informed consent was obtained from all
patients who participated in this study.
Peer-review: Externally peer-reviewed.
Author Contributions: Concept - O.S., S.B., H.A., B.Ö.; Design - O.S.,
S.B., H.A.; Supervision - O.S., H.A., B.Ö., S.B.; Resources - S.B., B.Ö.; Materials - O.S., H.A., S.B., B.Ö.; Data Collection and/or Processing - O.S., H.A., B.Ö.; Analysis and/or Interpretation - O.S., S.B.; Literature Search - O.S., S.B., H.A.; Writing Manuscript - O.S.; Critical Review - O.S., S.B., B.Ö., H.A., M.T., K.B.
Acknowledgments: The authors thank to the Turkish Society of
In-ternal Medicine for their valuable contribution.
Conflict of Interest: The authors have no conflict of interest to
de-clare.
Financial Disclosure: The authors declared that this study has
re-ceived no financial support.
REFERENCES
1. Tezel A, Dökmeci G, Eskiocak M, Umit H, Soylu AR. Epidemiological features of ulcerative colitis in Trakya, Turkey. J Int Med Res 2003; 31: 141-8. [CrossRef]
2. Ozin Y, Kilic MZ, Nadir I, Cakal B, Disibeyaz S, Arhan M, Dagli U, Tunc B, Ulker A, Sahin B. Clinical features of ulcerative colitis and Crohn’s disease in Turkey. J Gastrointestin Liver Dis 2009; 18: 157-62.
3. Bor S, Sarıtaş Yüksel E. How is the gastroesophageal reflux dis-ease prevalence, incidence, and frequency of complications (stric-ture/esophagitis/Barrett’s esophagus/carcinoma) in Turkey com-pared to other geographical regions globally? Turk J Gastroenterol 2017; 28(Suppl 1): S4-S9. [CrossRef]
4. Bor S, Kitapcioglu G, Kasap E. Prevalence of gastroesophageal reflux disease in a country with a high occurrence of Helicobacter pylori. World J Gastroenterol 2017; 23: 525-32. [CrossRef]
5. Orhan Sezgin, Bünyamın Sarıtaş, İsmaıl Aydın, Tayyar Şaşmaz, Ebru Serınsöz Linke. Celıac Dısease Prevalence In Turkey: A Popu-latıon Based Cross-Sectıonal Study. Acta Medica Mediterranea 2016; 32: 463.
6. Knill-Jones RP: Geographical differences in the prevalence of dyspepsia. Scand J Gastroenterol 1991; 26(Suppl 182): 17-24. [CrossRef]
7. Lovell RM, Ford AC. Global prevalence of and risk factors for irri-table bowel syndrome: a meta-analysis. Clin Gastroenterol Hepatol 2012; 10: 712-721. [CrossRef]
8. Ünal S, Aşcıoğlu S, Demirkazık A, et al. Baseline data of a prospec-tive cohort study. Cappadocia cohort study, Turkey. Turk J Public Health 2018; 16.
9. Bovenschen HJ, Janssen MJR, van Oijen MGH, et al. Evaluation of a Gastrointestinal Symptoms Questionnaire. Dig Dis Sci 2006; 51: 1509-15. [CrossRef]
10. Locke GR, Zinsmeister AR, Fett SL, Melton LJ, Talley NJ. Overlap of gastrointestinal symptom complexes in a US community. Neurogas-troenterol Motil 2005; 17: 29-34. [CrossRef]
11. Almario CV, Ballal ML, Chey WD, et al. Burden of Gastrointestinal Symptoms in the united States: results of a nationally representa-tive Survey of over 71,000 Americans. Am J Gastroenterol 2018; 113: 1701-10. [CrossRef]
12. Kitapçioğlu G, Mandiracioğlu A, Caymaz Bor C, Bor S. Overlap of symptoms of dyspepsia and gastroesophageal reflux in the commu-nity. Turk J Gastroenterol 2007; 18: 14-9.
13. Drossman DA, Li Z, Andruzzi E, Temple RD, Talley NJ, Thompson WG, et al. U.S. householder survey of functional gastrointestinal dis-eases. Prevalence, sociodemography, and health impact. Dig Dis Sci 1993; 38: 1569-80. [CrossRef]
14. Agreus L, Svardsudd K, Nyren O, Tibblin G. Irritable bowel syn-drome and dyspepsia in the general population: overlap and lack of stability over time. Gastroenterology 1995; 109: 671-80. [CrossRef] 15. Talley NJ, Boyce P, Jones M. Identification of distinct upper and lower gastrointestinal symptom groupings in an urban population. Gut 1998; 42: 690-5. [CrossRef]
16. Maconi G, Tosetti C, Stanghellini V, Bianchi PG, Corinaldesi R. Dys-peptic symptoms in primary care. An observational study in general practice. Eur J Gastroenterol Hepatol 2002; 14: 985-90. [CrossRef] 17. Jones R, Lydeard S. Prevalence of symptoms of dyspepsia in the community. BMJ 1989; 298: 30-2. [CrossRef]
18. Jones RH, Lydeard SE, Hobbs FD, et al. Dyspepsia in England and Scotland. Gut 1990; 31: 401-5. [CrossRef]
19. Talley NJ, O’Keefe EA, Zinsmeister AR, Melton LJ. Prevalence of gastrointestinal symptoms in the elderly: a population-based study. Gastroenterology 1992; 102: 895-901. [CrossRef]
20. Quigley EM, Locke GR, Mueller-Lissner S, et al. Prevalence and management of abdominal cramping and pain: a multinational sur-vey. Aliment Pharmacol Ther 2006; 24: 411-9. [CrossRef]
21. Ronkainen J, Aro P, Storskrubb T, et al. High prevalence of gastro-esophageal reflux symptoms and esophagitis with or without symp-toms in the general adult Swedish population: a Kalixanda study report. Scand J Gastroenterol 2005; 40: 275-85. [CrossRef]
22. Camilleri M, Dubois D, Coulie B, et al. Prevalence and socio-economic impact of upper gastrointestinal diseases in the United States: results of the US Upper Gastrointestinal Study. Clin Gastro-enterol Hepatol 2005; 3: 543-52. [CrossRef]
23. Sandler RS, Stewart WF, Liberman JN, Ricci JA, Zorich NL. Ab-dominal pain, bloating, and diarrhea in the United States: prevalence and impact. Dig Dis Sci 2000; 45: 1166-71. [CrossRef]
24. Spiegel BM, Khanna D, Bolus R, Agarwal N, Khanna P, Chang L. Understanding gastrointestinal distress: a framework for clinical practice. Am J Gastroenterol 2011; 106: 380-5. [CrossRef]
25. Ofman JJ, Shaw M, Sadik K, et al. Identifying patients with gas-troesophageal reflux disease: validation of a practical screening tool. Dig Dis Sci 2002; 47: 1863-9. [CrossRef]
26. Bardhan KD, Stanghellini V, Armstrong D, Bergh¨ofer P, Gatz G, M¨onnikes H. International validation of ReQuestTM in patients with endoscopy-negative gastro- oesophageal reflux disease. Aliment Pharmacol Ther 2004; 20: 891-8. [CrossRef]
27. Bardhan KD, Stanghellini V, Armstrong D, Bergh¨ofer P, Gatz G, M¨onnikes H. Evaluation of GERD symptoms during therapy. Part I. Development of the new GERD questionnaire ReQuestTM. Digestion 2004; 69: 229-37. [CrossRef]
28. Kuykendall DH, Rabeneck L, Campbell JM, Wray NP: Dyspep-sia: how should we measure it? J Clin Epidemiol 1998; 51: 99-106. [CrossRef]
29. Kennedy T, Jones R. Development of a postal health status ques-tionnaire to identify people with dyspepsia in the general population. Scand J Prim Health Care 1995; 13: 243-9. [CrossRef]
30. Agr’eus L, Sv¨ardsudd K, Nyr’en O, Tibblin G. Reproducibility and validity of a postal questionnaire. The abdominal symptom study. Scand J Prim Health Care 1993; 11: 252-62. [CrossRef]
31. Osterberg A, Graf W, Karlbom U, Pahlman L. Evaluation of a ques-tionnaire in the assessment of patients with faecal incontinence and constipation. Scand J Gastroenterol 1996; 31: 575-580. [CrossRef] 32. Talley NJ, Phillips SF, Melton L3rd, Wiltgen C, Zinsmeister AR. A patient questionnaire to identify bowel disease. Ann Intern Med 1989; 111: 671-4. [CrossRef]
33. van Kerkhoven LAS, Eikendal T, Laheij RJF, van Oijen MGH, Jansen JBM. Gastrointestinal symptoms are still common in a general Western population. The Netherlands Journal of Medicine 2008; 66: 18-22. 34. American Gastroenterological Association medical position statement: evaluation of dyspepsia. Gastroenterology 1998; 114: 579-81. [CrossRef]
35. Van Soest EM, Siersema PD, Dieleman JP, Sturkenboom MC, Kuipers EJ. Persistence and adherence to proton pump inhibitors in daily clinical practice. Aliment Pharmacol Ther 2006; 24: 377-85. [CrossRef]
36. Martin RM, Dunn NR, Freemantle S, Shakir S. The rates of com-mon adverse events reported during treatment with proton pump inhibitors used in general practice in England: cohort studies. Br J Clin Pharmacol 2000; 50: 366-72. [CrossRef]
37. Van Oijen MG, Josemanders DF, Laheij RJ, van Rossum LG, Tan AC, Jansen JB. Gastrointestinal diseases and symptoms: does body mass index matter? Neth J Med 2006; 64: 45-9.
38. Bagriacik N, Onat H , Ilhan B, et al. Obesity Profile in Turkey. Int J Diabetes Metabolism 2009; 17: 5-8.
39. Yumuk VD. Prevalence of obesity in Turkey. Obesity reviews 2005; 6: 9-10. [CrossRef]
40. İşeri A, Arslan N. Obesity in adults in Turkey: age and regional effects. Eur J Public Health 2009; 19: 91-94. [CrossRef]
41. T.C. Başbakanlık Aile ve Sosyal Araştırmalar Genel Müdürlüğü ve T.C. TÜİK. Aile Yapısı Araştırması 2006. Ankara, 2006.
42. Chang L, Toner BB, Fukudo S, et al. Gender, age, society, culture, and the patient’s perspective in the functional gastrointestinal dis-eases. Gastroenterology 2006; 130: 1435-46. [CrossRef]
43. O’Mahony D, O’Leary P, Quigley EM. Aging and intestinal motility: a review of factors that affect intestinal motility in the aged. Drugs Aging 2002; 19: 515-27. [CrossRef]
44. El-Serag HB, Sweet S, Winchester CC, Dent J. Update on the ep-idemiology of gastro- oesophageal reflux disease: a ystematic re-view. Gut 2014; 63: 871-80. [CrossRef]
45. Frank L, Kleinman L, Ganoczy D, al. Upper gastrointestinal symptoms in North America: prevalence and relationship to healthcare utilization and quality of life. Dig Dis Sci 2000; 45: 809-18. [CrossRef]
46. Higgins PD, Johanson JF. Epidemiology of constipation in North America: a systematic review. Am J Gastroenterol 2004; 99: 750-9. [CrossRef]
47. Locke GR 3rd, Talley NJ, Fett SL, Zinsmeister AR, Melton LJ 3rd. Prevalence and clinical spectrum of gastroesophageal reflux: a
pop-ulation-based study in Olmsted County, Minnesota. Gastroenterolo-gy 1997; 112: 1448-56. [CrossRef]
48. Sandler RS, Everhart JE, Donowitz M, Adams E, Cronin K, Good-man C, et al. The burden of selected digestive diseases in the United States. Gastroenterology. 2002; 122: 1500-11. [CrossRef]
49. Shaheen NJ, Hansen RA, Morgan DR, Gangarosa LM, Ringel Y, Thiny MT, et al. The burden of gastrointestinal and liver diseases, 2006. Am J Gastroenterol 2006; 101: 2128-38. [CrossRef]
50. Everhart JE, Ruhl CE. Burden of digestive diseases in the United States part I: overall and upper gastrointestinal diseases. Gastroen-terology 2009; 136: 376-86. [CrossRef]
51. Peery AF, Crockett SD, Barritt AS, et al. Burden of gastrointesti-nal, liver, and pancreatic diseases in the United States. Gastroenter-ology 2015; 149: 1731-41.e3. [CrossRef]
52. Everhart JE, Ruhl CE. Burden of digestive diseases in the Unit-ed States. Part II: lower gastrointestinal diseases. Gastroenterology 2009; 136: 741-54. [CrossRef]
53. Peery AF, Dellon ES, Lund J, et al. Burden of gastrointestinal dis-ease in the United States: 2012 update. Gastroenterology 2012; 143: 1179.e3-87.e3. [CrossRef]
Appendix: Upper gastrointestinal symptom questionnaire
SYMPTOM SEVERITY
SYMPTOM 0 None 1 Almost none 2 Slight 3 Mild 4 Moderate 5 Severe 6 Very severe Epigastric pain General Daytime Nighttime/ at sleep Heartburn Regurgitation Gastric bloating Sensation of hunger Nausea Vomiting Early satiety Postprandial fullness Belching Hematemesis Dysphagia Fluid Solid Halitosis
Lower gastrointestinal symptom questionnaire
SYMPTOM SEVERITY
SYMPTOM 0 None 1 Almost none 2 Slight 3 Mild 4 Moderate 5 Severe 6 Very severe Rumbling
Abdominal pain General Postprandial Fasting
Does not alleviate after defecation Bloating Abnormal defecation Melena Bloody Mucous Often hard Diarrhea
Variable, hard, or loose Constipation
Often painful Strong urgency Incomplete discharge Steatosis