AN ALTERNATIVE LOOK AT BALANCE-OF-PAYMENTS PUZZLE: STRUCTURAL DECOMPOSITION OF ACCOUNTS OF 16 EMERGING
MARKETS A Master’s Thesis by USSAL ŞAHBAZ Department of Economics ... Bilkent University Ankara January 2006
AN ALTERNATIVE LOOK AT BALANCE-OF-PAYMENTS PUZZLE: STRUCTURAL DECOMPOSITION OF ACCOUNTS OF 16 EMERGING
MARKETS
The Institute of Economics and Social Sciences of
Bilkent University
by
AHMET USSAL ŞAHBAZ
In Partial Fulfilment of the Requirements for the Degree of MASTER OF ARTS
in
THE DEPARTMENT OF ECONOMICS BİLKENT UNIVERSITY
ANKARA January 2006
and in quality, as a thesis for the degree of Master of Arts in Economics.
--- Prof. Erinç Yeldan
Supervisor
I certify that I have read this thesis and have found that it is fully adequate, in scope and in quality, as a thesis for the degree of Master of Arts in Economics.
--- Asst. Prof. Selin Sayek Böke Examining Committee Member
I certify that I have read this thesis and have found that it is fully adequate, in scope and in quality, as a thesis for the degree of Master of Arts in Economics.
--- Assoc. Prof. Cem Somel
Examining Committee Member
Approval of the Institute of Economics and Social Sciences
--- Prof. Erdal Erel
iii
ABSTRACT
AN ALTERNATIVE LOOK AT BALANCE-OF-PAYMENTS PUZZLE: STRUCTURAL DECOMPOSITION OF ACCOUNTS OF 16 EMERGING
MARKETS Şahbaz, Ahmet Ussal Master of Economics Supervisor: Prof. Erinç Yeldan
January 2006
The empricial evidence on pro-growth effect of capital account liberalization is inconclusive. I argue that, after liberalization, the link between structural finance needs of developing countries and debt flows lost its importance. Instead, the flight of resident capital and unproductive reserve accumulation have created new financing needs, limiting the augmentation of saving pools of developing countries and hence growth. I build four new components from balance-of-payments account that make it possible to track the new financing patterns. I investigate relationship between these components for 15 emerging market countries. I also make a case study for Turkey using vector autoregression technique to establish a causality link between dynamics of the new structural aggregates.
iv
ÖZET
ÖDEMELER DENGESİ BİLMECESİNE YENİ BİR BAKIŞ: 16 YÜKSELEN PİYASA EKONOMİSİ HESAPLARININ YAPISAL
AYRIŞTIRILMASI Şahbaz, Ahmet Ussal Yüksek Lisans, İktisat Bölümü Tez Yöneticisi: Prof. Dr. Erinç Yeldan
Ocak 2006
Sermaye hesabının serbestleştirilmesinin büyüme üzerindeki etkisine ilişkin ampirik çalışmalar sağlam bir bulgu ortaya koyamamaktadır. Bu çalışmada,
serbestleştirmeden sonra gelişmekte olan ülkelerin yapısal finansman ihtiyacıyla bu ülkelere olan sermaye akımları arasındaki ilişkinin önemini yitirdiği öne
sürülmektedir. Bu ilişkinin yerine, yerleşik sermayenin kaçışı ve rezerv birikimi sonucu ortaya çıkan yeni finansman biçimi gelişmekte olan ülkelerin tasarruf havuzlarının büyümesini ve dolayısıyla büyüme oranlarında artışı önlemiştir. Bu yeni finansman biçimini gözlemlemek için ödemeler dengesi dört yeni bileşene ayrılmakta ve bu bileşenlerin ilişkileri 15 yükselen piyasa özelinde incelenmektedir. Ayrıca, Türkiye’ya dair bir vaka analizi yapılmakta ve vektör otoregresyon tekniği kullanılarak bu bileşenler arasındaki nedensellik ilişkisi de araştırılmaktadır.
v
ACKNOWLEDGEMENTS
I thank Dr. Erinç Yeldan for his guidance through the development of this thesis. His encouragement brought me to Bilkent for graduate study and his supervision made the accomplishment of this thesis possible.
I am grateful to my examining committee members, Dr. Selin Sayek Böke and Dr. Cem Somel. Their valuable suggestions have resulted in a great improvement in my thesis.
I am indebted to many people who provided support in course of this study. Among them, Dr. Korkut Boratav provided insight about the balance-of-payments system, Fikret Karabudak and Hakan Toprak helped on data issues and Onur Mumcu reviewed the last draft and corrected editorial mistakes. I am also grateful to Dr. Kivilcim Metin-Ozcan, Dr. Umit Ozlale, Dr. Hasan Ersel, Dr. Bilin Neyaptı and participants of Ecomod 2005 conference for their comments and suggestions. I also thank Burcu Afyonoğlu, Barış Esmerok, Sırma Kollu, Bahar Tözün, Ozan Acar and Tural Hüseyin of Bilkent Economics graduate class of 2005 for their friendship and support during various stages of my graduate study.
Lastly, I thank my parents, Ferhunde Us and Abdurrahim Şahbaz, for encouraging me to involve in academic studies and their support during all stages of my
TABLE OF CONTENTS
ABSTRACT...III ÖZET ...IV ACKNOWLEDGEMENTS ...V TABLE OF CONTENTS...VI LIST OF TABLES ...IX LIST OF FIGURES ...XI
1. INTRODUCTION... 1
2. MOTIVATION ... 4
2.1. RECENT TRENDS IN CAPITAL FLOWS AND LIBERALIZATION... 4
2.2. EFFECTS OF CAPITAL ACCOUNT LIBERALIZATION ON GROWTH... 14
2.2.1. The case for liberalization... 14
2.2.2. Review of empirical evidence... 17
2.2.3. The reasons of the failure of the case for liberalization... 21
2.3. THE FLIP-SIDE OF BALANCE OF PAYMENTS... 25
2.3.1. Capital Outflows ... 25
2.3.2. Reserve accumulation ... 28
3. METHODOLOGY... 32
3.1.BALANCE OF PAYMENTS ACCOUNTS AND THE TRADITIONAL REPRESENTATION... 32
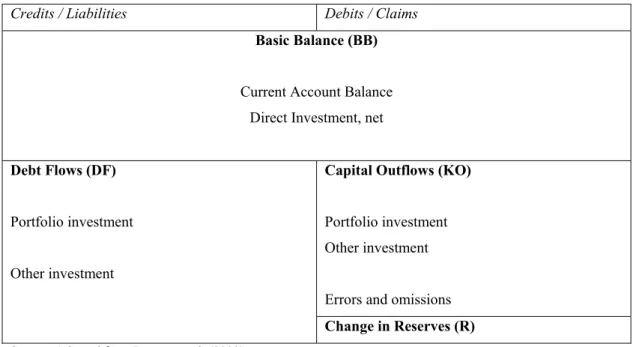
3.2.A NEW STRUCTURAL DECOMPOSITION... 39
3.3. DATA AND SAMPLE SELECTION... 46
4. LIBERALIZATION EXPERIENCES... 51
4.1.SOME STYLIZED FACTS... 51
4.2.COUNTRY ANALYSIS... 58 4.2.1. Argentina... 59 4.2.2. Mexico ... 62 4.2.3. Chile ... 65 4.2.4. Brazil... 68 4.2.5. Peru ... 72 4.2.6. Columbia... 74 4.2.7. Venezuela... 75 4.2.8. Korea... 77 4.2.9. Malaysia ... 80 4.2.10. Thailand ... 82 4.2.11. Indonesia ... 85 4.2.12. Philippines... 87 4.2.13. Hungary... 89 4.2.14. Czech Republic ... 91 vii
4.2.15. Poland... 92
4.3. CONCLUDING REMARKS... 94
5. A CASE STUDY: TURKEY... 97
5.1.ASTRUCTURAL ANALYSIS OF TURKISH BALANCE OF PAYMENTS ACCOUNTS... 97
5.2.TURKEY'S EXPERIENCE WITH AN OPEN CAPITAL ACCOUNT... 101
5.3.CONCLUDING REMARKS... 109
6. CONCLUSION... 111
SELECTBIBLIOGRAPHY ... 113
APPENDIX. CHRONOLOGY OF LIBERALIZATION EXPERIENCES ... 119
LIST OF TABLES
Table 1. List of Sample Countries... 48
Table 2. External Debt Stock / GDP ratios ... 55
Table 3. Usage of Debt Flows in Sample Countries (1990 – 1996) ... 57
Table 4. Correlation of DF with other components in Argentina ... 62
Table 5. Usage of Debt Flows in Argentina (1990 – 1998)... 62
Table 6. Correlation of DF with other components in Mexico... 64
Table 7. Usage of Debt Flows in Mexico (1990 – 1994)... 65
Table 8. Correlation of DF with other components in Chile... 68
Table 9. Usage of Debt Flows in Chile (1991 – 1997) ... 68
Table 10. Usage of Debt Flows in Brazil (1992 - 1998)... 71
Table 11. Correlation of DF with other components in Brazil ... 71
Table 12. Usage of Debt Flows in Columbia (1993 - 1999)... 75
Table 13. Correlation of DF with other components in Korea ... 80
Table 14. Usage of Debt Flows in Korea (1990 – 1996) ... 80
Table 15. Usage of Debt Flows in Thailand (1987 – 1996)... 85
Table 16. Usage of Debt Flows in Indonesia (1990 – 1996) ... 85
Table 17. Correlation of DF with other components in Philippines ... 88
Table 18. Usage of Debt Flows in Philippines (1989 – 1996)... 88
Table 19. Usage of Debt Flows in Hungary (1992 - 1998)... 90 Table 20. Usage of Debt Flows in Poland (1997 – 2003)... 94 Table 21. Usage of debt flows in Turkey (1981 – 2000) ... 98
LIST OF FIGURES
Figure 1. Capital flows to high-income OECD and emerging market countries ... 5
Figure 2. Domestic and international financial liberalization... 10
Figure 3. Traditional Representation of Balance of Payments ... 34
Figure 4. The structural components of the Balance of Payments... 40
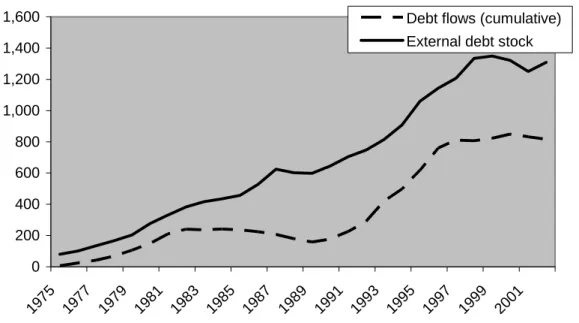
Figure 5. Debt flows and external debt stock for the sample countries ... 47
Figure 6. Ratio of BOP components to external debt stock: All countries... 52
Figure 7. Debt flows to Asia, Latin America and East Europe (bil. $)... 54
Figure 8. Ratio of BOP components to external debt stock: Latin America... 56
Figure 9. Ratio of BOP components to external debt stock: Asia ... 56
Figure 10. Ratio of BOP components to external debt stock: East Europe ... 58
Figure 11. Ratio of BOP components to external debt stock: Argentina... 60
Figure 12. Ratio of BOP components to external debt stock: Mexico ... 63
Figure 13. Ratio of BOP components to external debt stock: Chile ... 66
Figure 14. Ratio of BOP components to external debt stock: Brazil... 71
Figure 15. Ratio of BOP components to external debt stock: Peru ... 73
Figure 16. Ratio of BOP components to external debt stock: Columbia ... 75
Figure 17. Ratio of BOP components to external debt stock: Venezuella... 77
Figure 18. Ratio of BOP components to external debt stock: Korea... 79
Figure 19. Ratio of BOP components to external debt stock: Malaysia ... 81
Figure 20. Ratio of BOP components to external debt stock: Thailand ... 83
Figure 21. Ratio of BOP components to external debt stock: Indonesia ... 85
Figure 22. Ratio of BOP components to external debt stock: Phillipines... 87
Figure 23. Ratio of BOP components to external debt stock: Hungary... 90
Figure 24. Ratio of BOP components to external debt stock: Czech Republic ... 91
Figure 25. Ratio of BOP components to external debt stock: Poland... 93
Figure 26. Ratio of BOP components to external debt stock: Turkey ... 98
Figure 27. Acc. impulse response functions (DF and KO, short lag length) ... 103
Figure 28. Acc. impulse response functions (DF and KO, long lag length) ... 105
Figure 29. Acc. impulse response functions (DF and BB) ... 106
Figure 30. Rate of financial arbitrage in Turkey (%)... 108
CHAPTER I
INTRODUCTION
The surge in capital flows to the so-called “emerging market” countries1 has been impressive in 1990s. A basic triggering element for this surge has been capital account liberalization in those countries. It has been the argued that liberalization would be beneficial for growth by attracting the idle savings in the industrialized countries to the developing countries and thus narrowing the investment – saving gap in these countries at a low cost of capital.
However, that has not been the case. Instead, capital account liberalization brought volatility to growth and frequent crisis to emerging markets. Reviewing the extensive cross-country literature on the issue, Prasad at al. (2003) stated that "there is no strong,
1 The countries which liberalized their capital accounts and attracted much capital inflows are called
emerging markets. Although there does not exist a clear definition of an “emerging market” some reference lists may be informative: The Economist lists the following countries as “emerging markets”: China, Hong Kong, India, Indonesia, Malaysia, Philippines, Singapore, South Korea, Taiwan, Thailand, Argentina, Brazil, Chile, Colombia, Mexico, Peru, Venezuella, Egypt, South Africa, Israel, Czech Republic, Hungary, Poland, Russia and Turkey. Meanwhile, JP Morgan lists Brazil, Mexico, Russia, Turkey, Philippines, Venezuella, Colombia, Argentina, Peru, South Africa, Ecuador, Panama, Poland, Ukraine, Bulgaria, Nigeria, Egypt and Morocco in its “Emerging Market Bonds Plus – EMBI+ Index.” Morgan Stanley Capital International has a larger list: Argentina, Brazil, Chile, Chin, Colombia, Czech Rep., Egypt, Hungary, India, Indonesia, Israel, Jordan, Korea, Malaysia, Mexico, Morocco, Pakistan, Peru, Philippines, Poland, Russia, South Africa, Taiwan, Thailand, Turkey, Venezuela.
robust and uniform support for the theoretical argument that financial globalization per
se delivers a high rate of economic growth."
Attempts to identify the factors that link capital account liberalization to growth have created a vast literature. This literature generally focuses on information asymmetries and their negative results regarding attraction of more capital to emerging markets. Nevertheless, flight of resident capital from emerging markets after liberalization, and role of unproductive usage of capital flows as reserves in order to sustain capital flows did not attract much attention. Liberalizing under macroeconomic imbalances,
inappropriate macroeconomic policies or poor management of capital account may result in these unfavorable circumstances that may limit the pro-growth effects of capital account liberalization even if the emerging market attracts much capital.
The structural financing needs of developing countries can be defined as current account deficits plus net foreign direct investments. Before capital account liberalization, capital inflows have traditionally been used to finance this structural need. I argue that after capital account liberalization this relationship lost its importance. Instead, the flight of resident capital and unproductive use of capital flows as reserves have created new financing needs. Consequently, the role of capital account liberalization in narrowing investment - saving gaps in emerging market countries have been limited.2
2 I elaborate other factors in limiting the positive effect of capital account liberalization on growth in
Section 2.2.3.
The thesis is structured as follows: In the second chapter I describe the surge in capital flows to emerging market countries in 1990s and its causes. I explain the case for capital account liberalization. Then I review the empirical effects regarding the growth effects of liberalization and I pinpoint some of the explanations for the failure of growth premise. I also explain the role of capital flight and productive reserve accumulation in this regard. In the third chapter, I describe my methodology. I give details about the traditional presentation of balance of payments and the new components that will be used in my analysis. The fourth chapter is the core of the thesis where I support my argument by investigating the balance of payments dynamics of fifteen emerging market countries. Lastly, in the fifth chapter, I provide a case study of Turkish financial
liberalization, using the same methodology in a historical framework of Turkish
economy in 1990s. I also provide vector autoregression results that establish a causality relationship between capital inflows and outflows in this chapter. I conclude in the sixth chapter.
CHAPTER II
MOTIVATION
This chapter provides a literature review and framework for the following analysis. In the first section I overview the trends in capital flows in 1990s. In the second section, I first outline the case for capital account liberalization. Then I review empirical evidence regarding growth effects of it and lastly I outline some
explanations on the non-existence of a robust relationship between capital account liberalization and growth. In the third section I turn the flip side of balance of payments and suggest that capital outflows and reserve accumulation may also have played a role in limiting the pro-growth effects of capital account liberalization.
2.1. Recent trends in capital flows and liberalization
The surge in capital flows to developing countries in early 1990s is a well-known fact. The size of the surge is impressive. According to Eichengreen and Mussa (1998) “net flows to developing countries have tripled from roughly $50 billion a
year in 1987 – 89 to more than $150 billion in each of the three most recent calendar years.”
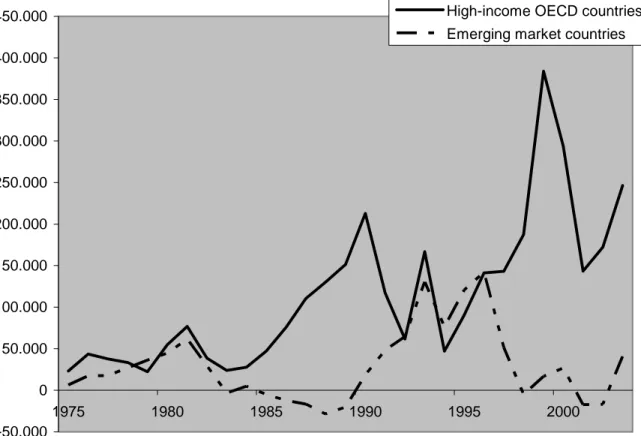
Figure 1. Capital flows to high-income OECD and emerging market countries
-50.000 0 50.000 100.000 150.000 200.000 250.000 300.000 350.000 400.000 450.000 1975 1980 1985 1990 1995 2000
High-income OECD countries Emerging market countries
Source: IFS
High-income OECD countries: United Kingdom, United States, France, Ireland, Iceland,
Netherlands, Japan, Norway, Switzerland, Sweden, New Zealand, Italy, Greece, Finland, Denmark, Germany, Canada, Belgium, Austria, Australia; Emerging market countries: China, Hong Kong, India, Indonesia, Malaysia, Philippines, Singapore, South Korea, Taiwan, Thailand, Argentina, Brazil, Chile, Colombia, Mexico, Peru, Venezuella, Egypt, South Africa, Israel, Czech Republic, Hungary, Poland, Russia and Turkey.
The figures are in million US dollars. Capital flows exclude foreign direct investment. Figure 1 illustrates this magnitude of capital flows to developing countries in comparison to high-income countries. Apparently, capital flows to high-income
countries also increased in 1990s, but this increase is surpassed by the surge in capital flows to developing countries. For the countries represented in Figure 1, capital inflows attracted by developing countries has increased 3.2 times from 1975 – 89 period to 1990 – 97 period, whereas capital inflows to high-income countries was 10% higher in 1990 – 97 period compared to 1975 - 89.
The surge in capital flows today, albeit great, is not unprecedented in history. Global capital markets witnessed another integration process approximately in the 40-year period before 1914. The surge in the “first globalization wave” was larger than today when the capital flows are scaled by GDP. However, there are some major
differences in composition of capital flows: The pre-1914 wave was dominated by claims on governments, infrastructure and mining companies of developing countries and those claims were mostly comprised of bonds. Conversely, today a larger set of financial instruments are traded and claims on developing countries involve equities as well as bonds (Bordo et al., 1998).
A similar comparison can also be undertaken with the expansion in capital flows in 1970s, largely thanks to the abandonment of Bretton Woods system. The 1970s rise in capital flows was smaller compared to the recent surge, but it is worth reviewing it to identify similarities and contrasts. The system through which capital flows was directed at developing countries was operated in the following way: The trade surpluses generated in oil-exporter countries were accumulated in banks of industrial countries. This accumulation led to an expansion in private credit in the form of
syndicated bank loans to developing countries. Official development assistance, which largely stemmed from cold-war politics, constituted the other way of capital flows to developing countries in 1970s. Nevertheless, the debt crisis of early 1980s in developing countries marked an end to this cycle. Commercial credit to
developing countries collapsed. Together with the effect of the fall in revenues of oil-exporting countries in 1980s, this decade was characterized by a low level of capital flows to developing countries (UNCTAD, 1999).
The surge in 1990s is not only larger than the size of flows in 1970s, but in many aspects, it is structurally different. Firstly, private capital flows dominate official flows. 80% of capital flows to developing countries are private in 1990s compared to 50% in the first half of 1970s. Secondly, within private inflows portfolio inflows gained importance compared to the dominance of syndicated bank lending in 1970s. As of 1997, the portfolio flows constituted more than a third of total flows to
developed countries whereas bank lending make up less than a third. In mid-1970s, nearly three quarters of capital flows to developing countries were bank loans, the remaining part being FDI. Thirdly, together with the switch to private flows from official flows, the distribution of flows within developing countries becomes uneven. Capital flows were concentrated towards some 20 countries, the so-called emerging
markets. The twenty countries3 which attracted 50% of capital flows in 1970 – 90 period have been the target of 90% of capital flows to developing countries in 1990s.
There are various factors that have contributed to this surge in capital flows in 1990s. Firstly, the change in demographic structure in industrial countries has created a large savings pool to be directed at emerging markets. The accumulated savings of baby-boomers has been a driving force of the surge in capital flows to developing countries. Secondly, the development of institutional investors in industrialized countries has provided a source for capital flows. Pension funds, which accumulated the savings of baby-boomers, have invested to emerging markets where return was high. Thirdly, financial liberalization in developed countries in 1980s made possible for these institutional investors to diversify their portfolio to developing countries. With liberalization, the flexibility of banking system in investment and credit creation increased, leading to financial innovation and encouraging “securitization” – capital flows in the form of bonds and stocks. Competition in financial services brought by liberalization also provided an incentive to look for higher returns in probably more risky emerging markets.
Fourthly, technological innovation has facilitated this process. Advances in
information technology not only made it possible to access information on various types of assets in minimum time, but also paved the way for creation of a broad set of new financial assets such as options, futures, and swaps. Progress in information
3 Argentina, Brazil, Chile, China, Columbia, Ecuador, Egypt, India, Indonesia, Malaysia, Mexico,
Morrocco, Peru, Philippines, South Korea, Thailand, Tunisia, Turkey, Uruguay, Venezuella.
technologies made it possible to trade assets all over the world simultaneously and reduced information asymmetries to some extent by reducing the cost of getting knowledge about far-distant countries. Lastly, and probably most importantly, capital account liberalization in emerging markets has made possible for various types of flows to get into these countries (UNCTAD, 1999; Eichengreen and Mussa, 1998)
Capital account liberalization has been an obvious trend in emerging market countries since late 1980s. Capital account liberalization or international financial liberalization4 has generally been part of a policy-package, which also includes domestic financial liberalization and has been implemented after or together with current account (or trade) liberalization. This policy package has sometimes included other measures for domestic economic liberalization such as privatization and deregulation.
In the literature analyzing financial liberalization, international financial
liberalization has only been one dimension, the others being other reform packages targeted at domestic financial sector. Williamson and Mahar (1998) list elements of financial liberalization as follows: (1) elimination of credit controls, (2) deregulation of interest rates, (3) free entry into banking sector, or more generally, the financial services industry, (4) bank autonomy and (5) private ownership of banks, and lastly (6) international financial liberalization.
4 I use the terms “capital account liberalization” and “international financial liberalization”
interchangeably throughout the thesis.
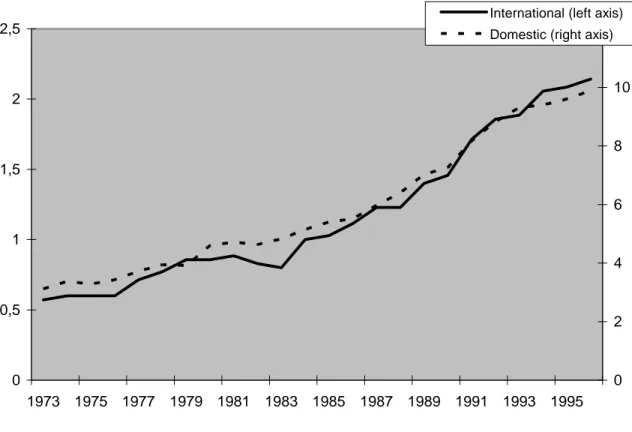
Figure 2. Domestic and international financial liberalization 0 0,5 1 1,5 2 2,5 1973 1975 1977 1979 1981 1983 1985 1987 1989 1991 1993 1995 0 2 4 6 8 10 12 International (left axis) Domestic (right axis)
Source: Mody and Abiad (2005)
The figure illustrates the Average values for Mody / Abiad indexes for domestic and international reform categories. Mody and Abiad (2005) measures six dimensions of financial liberalization: (1) elimination of credit controls, (2) deregulation of interest rates, (3) free entry into banking sector, or more generally, the financial services industry, (4) bank autonomy and (5) private ownership of banks, and lastly (6) international financial liberalization. In their index 3 represents full liberalization and 0 represents full repression.. Domestic financial liberalization index is the total of the first 5 components, hence ranges from 0 to 15. International financial liberalization the sixth component and ranges from 0 to 3.
In many instances, reform in these six dimensions have been implemented together or with short intervals. Mody and Abiad (2005) provide indexes for these
liberalization dimensions for 35 industrial and developing countries for the period of 1975 – 1996; where, in each dimension of reform “0” represents full repression and “3” represents full liberalization (henceforth Mody / Abiad index). A graphical illustration of averages of Mody / Abiad indexes of domestic and international
financial liberalizations in Figure 2 suggest that in general international and
domestic financial liberalization go hand-in-hand5. Kaminsky and Schmukler (2002) also conform to this view.
In order to make the analysis clear, throughout the thesis, I differentiate international financial liberalization from domestic financial liberalization and I use capital account liberalization (or international financial liberalization / integration) as a set of policies which include6: (1) measures that allow foreign residents to hold
domestic financial assets, either in the form of debt equity, (2) measures that allow domestic residents to hold foreign financial assets, (3) measures that allow foreign assets to be freely held and traded within domestic economy. It should be noted that these classification measures, from (1) to (3), represent an increasing degree of international financial liberalization; and there exist many countries which engaged in capital account liberalization but has not implemented some measures within these categories, especially in category 3.
It is hard to quantify international financial liberalization. Nevertheless, attempts to this end in the literature show a general liberalization trend in emerging market countries. In the most recent attempt, the average for Mody / Abiad index
5 Mody and Abiad support the view that domestic / international financial sector liberalization is
stimulated by liberalization in other economic dimensions. They also point out the importance of regional diffusion, shocks related to new governments, shocks that emanate from balance of payments crisis are other factors that increase likelihood of financial liberalization. They also argue that trade openness is a structural factor associated with more financial liberalization.
6 This classification of reforms are due to Ghosh (2005).
(mentioned in the preceding paragraph) for the emerging market countries it covers rises from 0.62 from 1980 to 0.96 in 1990 and 1.85 in 1996.
Williamson and Mahar (1998) make an extensive review of liberalization episodes in various countries. They classify capital account regimes into four categories; namely repressed, partially repressed, liberal and largely liberal. According to their classification, of the 25 developing countries in their sample, from 1973 to 1996, 13 have stepped two or more steps up in liberalization, 5 stepped one step up in
liberalization and 7 already had liberal capital account regimes in 1973.
Quinn and Inclan (1997) build an index from legal restrictions presented in IMF Annual Report on Exchange Arrangements and Exchange Restrictions covering restrictions on capital account, export proceeds and multiple exchange rates, in which “0” represents a closed economy while “12” represents an open economy. Their index, as cited in Eichengreen and Mussa (1998), averages constantly around 2.5 for emerging markets between 1960 – 80, then average rises to 3 around 1985 and over 3.5 in 1990s.
Kaminsky and Schmukler (2002) construct another index by reviewing liberalization chronology in 28 countries; and the average capital account liberalization index for the 14 emerging markets in their sample falls to 1.5 at the end of 1990s from a plateau over 2.5 in 1980s, where “3” represents full repression and “0” represents full liberalization.
It should be noted that in these quantifications of capital account liberalization, transition countries from communist regimes are omitted because no data is available for these countries when their capital accounts were repressed. When liberalization in transition countries is also taken into account, the quantitative liberalization trends will be strengthened.
Meanwhile, controls on capital flows have also been a hot issue in the literature. Some countries preferred implementing measures of control instead of full liberalization. The most important example is the unremunerated reserve
requirements or encaje in Spanish, applied in Chile from 1991 to 1998. Encaje was basically a control mechanism on inflows. As it necessitated a certain portion of inflows to be deposited in non-interest bearing accounts at the Bank of Chile, it played the role of an implicit tax on inflows. A similar control was also applied in Columbia between 1993 – 97. Another sort of capital controls were implemented in Malaysia and Thailand in 1997 after Asian crisis. This time, the controls were directed on outflows of capital rather than inflows, and required portfolio outflows to be held at non-interest bearing accounts for a certain period. Nevertheless, these controls were measures against crisis and reversed in a period of one year. Literature on capital controls suggest that, they have limited effect in constraining size of the capital flows and gaining monetary policy independence to the countries where controls are applied. They have been effective, however, in lengthening the maturity of capital flows (Edwards, 1999 and de Gregorio, 2000).
The above review shows that capital account liberalization in developing countries has been a trend since late 1980s, and has been one of the stimulating factors for the other trend of the same era, the expansion of capital flows directed at emerging markets.
2.2. Effects of capital account liberalization on growth
As it was one of the major driving forces behind the surge in capital flows to developing countries, it is worth examining the motivation of those countries for international financial liberalization. In this section, I first outline the case for liberalization. Then, I review the empirical studies that investigate the effect of capital account liberalization on growth and conclude that there exists no ample evidence of a positive effect for emerging market countries. Lastly, I review some of the reasons offered in the literature for the lack of such a positive relationship.
2.2.1. The case for liberalization
The basic argument of the theoretical case for capital account liberalization is the augmentation of national savings via a more efficient allocation of world savings. The argument goes as follows: The developing countries are capital-scarce; hence they offer higher returns to savings. In the meantime, the rich countries are
abundant; therefore they have lower returns on capital. With capital account
liberalization, the savings of rich countries will flow to developing countries where they find high returns, and help them closing the investment – saving gaps (Laurent et al., 2002). This process enables investors to achieve higher risk-adjusted returns and income levels in recipient countries rise as a result of capital inflows. As Eichengreen and Mussa (1998) state, “higher rates of return can encourage saving and investment that deliver faster rates of economic growth.”7
Another argument supporting liberalization is the risk-sharing premise, which basically states that capital account liberalization enables domestic agents in
developing countries to diversify their risks and hence reduce unfavorable domestic cyclical effects. This better allocation of risk is expected to spur domestic
investment and lead to high growth rates. Domestic agents can also borrow from abroad when incomes are low and lend when incomes are high and smooth their consumption.
7 They draw on from Goldsmith (1969), McKinnon (1973) and Shaw (1973) when putting forward
this argument. See also Lucas (1990) on the reasons deterring flow of capital from rich to poor countries. He suggests that the differences in returns to capital between rich and poor countries may disappear once the differences in human capital, external benefits of human capital, monopoly power on capital flows to certain jurisdictions and political risk associated to countries are taken into account.
It is also expected that with capital account liberalization, domestic financial sector will develop in emerging market countries. A deeper the financial sector will be another channel for international financial liberalization to enhance growth8.
Lastly, more prudent domestic macroeconomic policies are expected to be
implemented after capital account liberalization in order to sustain capital inflows. This policy discipline effect is also predicted to increase domestic investment and productivity, paving the way for higher growth rates (Eichengreen and Mussa, 1998).
Apparently, the case for capital account liberalization is very similar to the case for current account liberalization. Free movement of capital is efficiency-enhancing like free movement of goods, and hence promotes growth9. Although capital account followed current account liberalization in many countries, or happened hand-in-hand in some instances, the empirical results regarding the effect of the former on growth is different from the latter. Most studies report a positive and robust relationship between current account liberalization and growth, whereas the relationship of capital account liberalization with growth is at least mixed. I review this literature in the next section.
8 See King and Levine (1993) for the positive relationship between financial development and
economic growth.
9 See Rodrik and Rodríguez (2001) for a skeptic view on association of growth and trade
liberalization.
2.2.2. Review of empirical evidence10
In general, the significance of the effect of liberalization on growth is tested by adding liberalization as an independent variable to an equation where growth is the dependent variable and the other independent variables are standard variables in growth literature, such as initial per capita income to measure convergence, investment, population, secondary school enrollment rates and regional dummies.
Rodrik (1998) and Quinn (1997) are two pioneers of this literature who come up with differing results concerning the effect of international financial liberalization on growth. Rodrik uses a sample of one hundred industrial and developing countries for the period of 1975 – 89, he finds no explanative power of capital account
liberalization on growth. Quinn, conversely, suggests that capital account
liberalization is positively associated with growth in the period of 1960 – 89 in the 64 developed / developing countries in his sample.
There are various differences between methodologies of Rodrik and Quinn which also persist in the literature after them. Rodrik uses a de jure measure of
liberalization compiled from IMF Annual Report on Exchange Arrangements and Exchange Restrictions. His measure of liberalization is binary, 0 meaning closed and 1 meaning open. On the other hand, Quinn builds a measure based on anecdotal evidence provided in IMF Annual Report on Exchange Arrangements which ranges
10 I follow Eichengreen (2003) which makes an extensive review of cross-country studies
investigating effects of capital account liberalization on growth.
from 0 – 4 with increments of 0.5. Many authors refer to Quinn’s measure as “more informative.” Nevertheless, the difference in methodology is not limited to
liberalization measures. Quinn’s sample is more favorable to provide positive evidence because it contains more industrial countries than Rodrik’s sample; and it has a larger time span, lowering the weight of 1980s which developing countries struggled with crisis and low growth. Lastly, Rodrik uses levels of capital account liberalization, whereas Quinn uses changes in capital account liberalization. The extensive literature after Rodrik and Quinn, which has been reviewed by Edison et al. (2004), provide differing results concerning the effect of liberalization on growth. The differences in outcomes are due to varieties in the sampling of countries, time periods and forms of capital flows (FDI / portfolio / debt; public / private, etc.), and use of levels of differences when considering capital account liberalization, and other explanatory variables in the regression11, 12.
The idea that capital account liberalization may be conducive to growth in some countries (developed ones) and not in the other countries (developing ones) has created another segment of literature pioneered by Edwards (2001). Edwards uses Quinn’s measure of liberalization (his results are also robust when Rodrik’s measure
11 Bekaert et al. (2001) focuses on growth effects of equity market liberalizations and report a robust
positive relationship between growth and liberalization. It should be noted that this study does not cover liberalization in the portfolio investments on bonds and other investment aspects of capital account.
12 A non-econometric study by Gourinchas and Jeanne (2004), using a neoclassical growth model,
predicts that switching from financial autarky to international integration is roughly equivalent to a one percent permanent increase in consumption, which is negligable compared to productivity gains that will stem from improving internal allocative efficiency.
is used) and reports that while capital account liberalization is positively associated with growth in high-income OECD countries, the relationship vanishes when a sample composed of emerging market countries is used. Edwards suggests that the non-linearity may be a result of financial development in developed countries. Yet, Arteta et al. (2001) criticize Edwards (2001) on methodological grounds; and instead of a threshold of financial development, they find out that the positive effect of liberalization may be associated with other measures of openness. Consequently, they argue that sequencing is important to reap positive effects of liberalization and current account liberalization should be accomplished before capital account liberalization. Meanwhile, Prasad et al. (2003) also report some evidence of a “threshold” effect, implying that the absorptive capacity of markets may have a role in reaping benefits of international financial integration.
More recently, institutional quality has also been investigated as the cause of non-linearity in the effect of capital account liberalization on growth13. Edison et al. (2004) extend the view of Rodrik (1998) that capital account liberalization may proxy for government reputation in a growth regression if the latter does not appear as an explanatory variable. Using both Rodrik’s and Quinn’s measures (and some other measures) they find that the positive relationship between capital account liberalization and growth vanishes when government reputation is added as a control variable.
13 Hall and Jones (1999) and Acemoglu et al. (2001) are pioneers in the literature that relates growth
to institutions.
Lastly, another paper by Quinn et al. (2001) investigates effects of three variables that may result in non-linearity: (1) economic states before liberalization in line with Edwards (2001) and Arteta et al. (2001); (2) political and legal states before
liberalization with the suspicion that democratic regimes may have high
compensation costs for the losers from liberalization that may overweigh positive effects; and (3) level of social development before liberalization. They find evidence that liberalization is positively associated with growth but not for emerging market countries with democratic regimes14,15 .
To sum up, cross-country literature reviewed here provides no ample evidence of significant positive effect of capital account liberalization on growth. It is suggested that the positive effect, if any, is limited to developed countries rather than
developing countries. Yet, the attempts to identify the causes of the threshold effect have failed to provide decisive answers up to now. In the next section, I review some of the reasons that are proposed to explain the absence of the link between capital account liberalization and growth in emerging markets.
14 A recent paper by Alfaro et al. (2005) relates capital flows to the classical variables / instruments in
institutions literature. They find capital flows are positively associated with institutional quality. Historical determinants of current legal institutions have a direct effect on capital flows. They also suggest that there is room for the role of policy in determining the level and volatility of capital flows.
15 Meanwhile, Edison et al. (2002) relate various measures of international financial integration to
growth. These measures include Rodrik and Quinn’s de jure capital account liberalization measures and measures of capital inflows and inflows / outflows as a proxy for actual integration. They are unable to provide a robust link between growth and international financial integration even when they control financial, institutional and policy characteristics.
2.2.3. The reasons of the failure of the case for liberalization
The literature suggests various reasons why capital account liberalization did not deliver its premise of growth. The major explanation lies in the difference between the mechanisms through which capital markets and goods markets work. Unlike the markets for goods, financial markets are typically characterized by “information asymmetries.”16 The first outcome of this characteristic is the “adverse selection” problem which occurs when lenders have incomplete knowledge of borrower quality. Under adverse selection paradigm, lenders will lend at higher rates than the rates deserved by “good” borrowers, thus good borrowers will have an incentive not to seek loans, leaving the lenders with “bad” borrowers. The allocation of capital in this framework, obviously, will not be efficient.
The second outcome of information asymmetries is known as “moral hazard”: The borrowers have a chance to alter their behavior after they borrow. If the project goes well, then the borrower will reap the benefits; but if the project goes bankrupt the lender will bear the costs. As a result, the borrower will engage in excessively risky behavior. This will cause the lenders to seek guarantees for their loans, and in many instances the outcome will be explicit or implicit government guarantees on private debt of emerging market countries. Consequently, with insurance on debt, the outcome will be excessive lending for risky projects. It is worth noting that, many emerging market financial systems are characterized by a mismatch between
16 The further explanations of information asymmetries draw on from Eichengreen and Mussa (1998)
and Rodrik (1998).
term liabilities and long-term assets as a reflection of intrinsic information asymmetries.
Lastly, information asymmetries may lead to “herding” behavior, where agents follow the lead of those whom they believe to be better informed. As international fund managers place too little weight to their private information, the likelihood of herd behavior increases. The mismatches that stem from moral hazard increase vulnerability of the system to runs17, rendering herding behavior of international investors “rational.” Herding amplifies the effects of both favorable and unfavorable shocks. The result of the former is excessive lending, whereas the result of the latter may be a crisis. Moreover, as many international fund managers treat emerging markets as a basket, rather than giving an individual treatment to each market, herding behavior raises contagion effect of a crisis in one market to another. Short-term nature of borrowing in emerging markets combined with herding behavior may trigger “sudden stops” of capital inflows despite good macroeconomic
fundamentals18.
It is also worth noting that the information asymmetries that are endemic to financial markets are amplified when financial transactions take place in international domain. Obvious reason for this phenomenon is the increasing cost of gathering and
evaluating information with increasing geographic distance and cross-cultural
17 Rodrik and Velasco (1999) show that distorted incentives typically cause excessive short-term
foreign borrowing, which causes runs at the end. The larger the short-term borrowing, the larger its real consequences regarding reduced output and consumption.
18 See Calvo (1998) for a detailed investigation of sudden stops.
differences. Moreover, enforcement of contracts is substantially harder when the lender and borrower are in different jurisdictions compared to financial transactions that take place in the same country.
The information asymmetries may hinder the pro-growth effect of capital account liberalization through several channels. Firstly, information asymmetries result in an inefficient allocation of capital. Consequently, market mechanism fails to provide an efficient allocation of capital to the developing countries.
Secondly, as a result of information asymmetries the capital flows become
pro-cyclical, i.e., the funds are not available when there are weaknesses / there are more funds than you wish to borrow when economy is going well. The pro-cyclical nature of capital flows makes the risk-sharing and consumption smoothing channels
ineffective. Indeed, this channel works in the opposite way than expected.
Thirdly, the positive effect of financial deepening channel on growth becomes
flawed given volatile characteristics of capital flows. Financial deepening does not
per se imply efficient allocation of resources and growth. Instead, given the
information asymmetries elaborated above, financial deepening may result in inefficiencies. Typically, domestic investors will not finance long-term investments with the short-term borrowings available from international markets. As a result, the financial expansion is more likely to finance government deficits or consumption booms. In addition, typically most financial crises are preceded by a phase of financial deepening.
In a similar way, the effects of capital account liberalization may be limited or even welfare reducing in the presence of domestic distortions. A classical illustrative case is capital account liberalization before current account liberalization: If a labor-abundant country protects its capital-intensive industries, after international financial liberalization, the funds will flow to this protected sector, in which the country has no comparative advantage. Consequently, the misallocation of resources will be intensified after liberalization. This allocative efficiency effect is not limited to trade barriers but also will be present when there are other distortions such as
macroeconomic imbalances.
Lastly, policy discipline may not be imported with capital accounts liberalization.
With a typical surge in capital inflows after liberalization due to higher returns of the emerging market country, the governments are more likely to engage in
irresponsible behavior, such as running larger fiscal deficits. The experience shows that no one cares about imbalances as long as they can be sustained through capital inflows, and this gives government to exacerbate imbalance. When a sudden stop of inflows occurs, the imbalances result in a crisis.
Moreover, in most countries that liberalize capital accounts, as a consequence of a surge in capital inflows, real exchange rate appreciates seriously, causing an
incentive to invest in non-tradables, and discouraging investments in tradables. It is hard to manage the real appreciation effect and distortions caused by real
appreciations can lead to deindustrialization in developing countries (Ghosh, 2005).
The reasons that we examined in this section, which also have been the major themes of the literature that explains the lack of association between capital account liberalization and growth, miss an important point: To what extent capital imported after liberalization has been offset by capital exported; and to which extent did the intrinsic risks of liberalization pave the way for unproductive use of capital
imported. In the next section, I turn the flip side of the balance of payments accounts to shed light on some possible dynamics that further breaks the link between
liberalization and growth.
2.3. The flip-side of balance of payments
In this section I will explain the outflows of resident capital and reserve
accumulation in developing countries after they liberalized their capital accounts. I will outline the reasons, dimensions and costs of these two phenomena for emerging economies. This section provides a brief explanation for the reasons that capital outflows and reserve accumulation limited the growth promoting role of
international financial liberalization.
2.3.1. Capital Outflows
Most studies reviewed in Section 2.2 concentrate on capital inflows. Failure to obtain any significant relationship between net capital inflows and growth in
country regressions demonstrates the extent to which the financial market
imperfections played a role in limiting the channels put forward by case for capital account liberalization. Nevertheless, when assessing the effect of capital account liberalization to close the investment – saving gap in a developing country, one should also consider outflow of resident capital. Put it in another way, a country that attracts inflows of non-resident capital as much as it encourages outflows of resident capital after the capital account has been liberalized will fail to augment its saving pool. One can argue, by focusing on capital inflows, that this country has not attracted capital after liberalization. However, in fact, the country has attracted non-resident capital, meanwhile it has also lost its non-resident capital and the balance gives zero. The policy implications for the two analyses are quite different: Focusing on inflows, one can give advice to implement policies to attract more capital inflows (perhaps by raising the interest rates). If one considers the inflows / outflow
perspective, the advice will be taking measures to decrease outflows in order to reap benefits of inflows in closing investment – saving gap.
In an emerging economy, the risks faced by resident and non-resident investors are typically different. Resident investors face inflation and exchange rate risks; whereas the major risk that non-resident investors confront is the default risk. Both investors face taxes, which include not only explicit taxes on capital, but also include inflation (for residents) and default (for non-residents) taxes. For a government of a
developing country with a fiscal deficit, an easy revenue generation source can be an unexpected increase in inflation. In this way, resident investors are taxed. If
currency-denominated assets are not available domestically, given chaotic monetary history in many emerging markets, it is very likely for residents to acquire claims on non-residents (Dooley, 1988). Moreover, lack of confidence in the enforcement of the residents’ property rights may encourage them to diversify their portfolio to foreign assets.
Once the restrictions on outflows are eased, given today’s high level of information technologies and financial sophistication, it has been easy for emerging country residents to diversify their portfolios to include foreign assets. According to Cornford and Brandon (1999), “around 300 banking entities from 10 leading developing countries were operating in OECD countries in 199619.
Arguably, capital outflows are beneficial for the home country, since the gross national product (GNP) is maximized as a result of portfolio diversification
wherever the profits are earned. However, as Stiglitz (2000) argues, when there are positive externalities from domestic investments, such as taxes on capital (which are hard to apply to investments abroad), returns to scale or other spillovers, the utility of domestic investments is higher than investments abroad. In this case, the objective may be maximizing gross domestic product (GDP), not GNP. This case is especially applicable in early stages of development.
19 cited in UNCTAD (1999: 107). The ideas on capital outflows are gathered from UNCTAD (1999)
and Laurent et al. (2002).
2.3.2. Reserve accumulation
Investigations of net inflows or gross inflows have also limited power in
demonstrating the effect of international financial integration balancing investment – saving deficit, when the end use of inflows is disregarded. As capital flows are characterized by sudden stops and reversals, emerging markets need to establish credibility to sustain them. The most important way to enhance credibility is to accumulate reserves. Official reserves are seen as insurance to pay the short-term debt of the country in case of a reversal in capital inflows; and ratio of reserves to foreign currency denominated short-term debt has been established as firm
indicators of crisis in the literature (Rodrik and Velasco, 1999). When this ratio falls below one for an emerging market country, it is likely that the worried international lenders will exhibit a herding behavior in exiting from the country, culminating in a crisis. Therefore, emerging market countries has to use a significant amount of capital inflows to accumulate reserves.
This reserve accumulation motive to defend exchange rate and establish credibility is unique to the period after financial liberalization. In a closed capital account regime, as the capital flows are related to imports and current account financing, the need to maintain reserves only arises from the time lags between payments of imports and receipts of exports. According to UNCTAD (1999: 23), “traditionally, reserves covering on average three or four months’ imports are considered as
adequate for such purposes, and even smaller reserves would be needed to the extent
that governments are more willing to respond to current account disturbances by exchange rate adjustments.” As a result of international financial liberalization, the number n in the statement “reserves cover n months of imports” has increased from 3.5 in 1980 to 5.5 in 1997 for developing countries.
The new standard of reserve level suggested by Alan Greenspan20 is accordingly much higher than to cover several months of imports. As cited in UNCTAD (1999: 111), he tells “countries could be expected to hold sufficient liquid reserves to ensure that they could avoid new borrowing for one year with a certain ex ante probability, such as 95% of the time.” Feldstein (1999) also conforms with this view. He put forward that “the most direct way for a country to achieve liquidity is to accumulate substantial amounts of liquid foreign reserves.” He also adds “China’s $140 billion in reserves sends a strong signal to investors”21.
However, reserve accumulation has opportunity costs for the emerging market country. Reserves tie up purchasing power that could be used to import goods needed for investment and increase output. Therefore, reserve accumulation has a substantial effect in limiting the capital account liberalization’s effect on closing
20 Chairman of Federal Reserve Board. The citation is from his speech at World Bank conference on
Recent Trends in Reserves Management, Washington, DC. 29 April 1999.
21 A function of reserve accumulation different from the precautionary motive against financial crisis
is to prevent appreciation of local currencies and thus promote export competitiveness. China’s reserve accumulation, for example, is mainly explained by this motive. Nevertheless, when the general application in emerging economies is considered, the motive of accumulating reserves has generally been precautionary and maintaining competitiveness motive has not been important. See Aizenman and Woo (2005) for more detail.
investment – saving gap. Stiglitz (2000: 1081) explains the cost of holding reserves in a simple manner:
...consider a poor developing country. A company within the country borrows, say, $100 million from a US bank that charges him 20%. If the country has been maintaining what it views as minimum prudential reserves then it will have to add $100 million to reserves. For simplicity, assume it holds those reserves in US T-bills. Consider the implications from the perspective of the country’s balance sheet and income flows: It has lent the United States $100 million and borrowed from the United States the same amount – it has no new capital. But it pays to the United States every year the $20 million in interest, while it receives from the US $5 million, the interest on the T-bill. Clearly, this is a good deal for the United States but it is hardly the basis for more rapid growth by the poor developing country.
Rodrik (2005) calculates the social cost of holding reserves for developing economies. Even when excluding the part of reserve accumulation due to the
traditional current account management purpose, his estimate of annual cost holding reserves is around 1% of those countries’ GDPs. In Rodrik’s (2005: 9) words, “this is a large number by any standard. It is a multiple of the budgetary cost of even the most aggressive anti-poverty programs implemented in developing countries. Mexico’s Progresa program, for example, cost around 0.2% of GDP.22”
22 Rodrik (2005) moreover argues that the excessive reserve accumulation in 1990s has not been
rational. The emerging economies increased their short-term liabilities together with reserves. According to Rodrik, an optimal policy should have been reducing short-term liabilities while increasing reserves.
In the remainder of the thesis, I will show the effects outflows of resident capital and reserve accumulation in emerging markets after liberalization. I will put forward that with the emergence of a new financing pattern after liberalization, capital outflows and reserve accumulation created new financing requirements for these countries apart from their structural financing needs.
CHAPTER III
METHODOLOGY
In this chapter, I will present the methodology that will be applied in the following chapters. The first section explains the balance of payments system and its
traditional representation. I decompose balance of payments and build new
components, which are explained in the second section. The third section is on data and sample selection issues.
3.1. Balance of payments accounts and the traditional representation As defined in IMF (1996:1) balance of payments is “a statistical statement that systematically summarizes, for a specific time period, the economic transactions of an economy with the rest of the world.” The balance of payments is concerned with transactions and accordingly it deals with flows rather than stocks. These include transactions in goods, services and income; transfers such as worker’s remittances, and transactions related to acquisition or disposal of external financial assets.
The balance of payments statistics are collected by Central Banks in each country. The national statistics are gathered by the IMF and published in its Balance of Payments statistics and International Financial Statistics.
As balance of payments accounts reflect the economic transactions of an economy with the rest of the world, transactions between residents of a country and non-residents are tracked in these accounts23.
The double-entry bookkeeping system is employed in the balance of payment accounts. In double-entry bookkeeping system, every transaction results in two entries – one for the giving side, one for the receiving side. Credit items reflect payments to residents by non-residents (inward the country) and debit items reflecting payments from residents to non-residents (outward the country).
Examples of activities that give rise payments inward the country are exports, debt issuance and inward foreign direct investment; while examples of activities that give rise to payments outward are imports, investments by residents abroad and divestments by non-residents by selling shares or closing down facilities. Traditionally, credits are recorded with plus signs and debits are recorded with minus signs. Hence, the total balance of payments account is zero.
23 Resident of a country must have a center of interest in that country. IMF (1995:13) states a unit
has center of economic interest in a country “when there exists some location (dwelling, place of production, or other premises within the economic territory of the country) on, in, or from which the unit engages and intends to continue engaging (either indefinitely or over a finite but lengthy period of time) in economic activities and transactions on a significant scale.”
34 The standard components of balance of payments are current account and capital and financial account. The transactions in goods, services, income and current transfers are grouped under current account. The capital transfers and transactions in
country’s external financial assets and liabilities are collected under capital account. The traditional representation is illustrated in Figure 3.
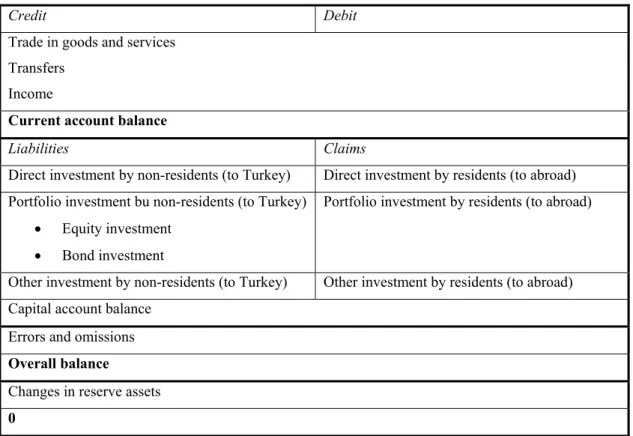
Figure 3. Traditional Representation of Balance of Payments
Credit Debit
Trade in goods and services Transfers
Income
Current account balance
Liabilities Claims
Direct investment by non-residents (to Turkey) Direct investment by residents (to abroad) Portfolio investment bu non-residents (to Turkey)
• Equity investment • Bond investment
Portfolio investment by residents (to abroad)
Other investment by non-residents (to Turkey) Other investment by residents (to abroad) Capital account balance
Errors and omissions
Overall balance
Changes in reserve assets
0
It is worth presenting the recording mechanism of the balance of payments accounts with an example. Consider a Turkish firm importing goods from the United
Kingdom for $10 million. The transaction is recorded as a debit item ($10M) in the current account. There has to be balancing entry: If Turkish firm pays with a check
drawn on a Turkish bank, the corresponding transaction in the financial account is recorded as an increase in Turkish liabilities to non-residents (a credit of $10M). If the payment is drawn against an account the Turkish firm has in a British bank, the corresponding transaction in the financial account is recorded as a reduction in Turkish assets (a credit of $10M).
Normally, the total of current and capital and financial account balances should sum up to zero. “In practice, however, when all actual entries are totaled, the resulting balance will almost inevitably show a net credit or a net debit. That balance is the result of errors and omissions in the compilation of statements.” (IMF, 1995: 38) The difference between zero and sum of current and capital and financial accounts forms the net errors and omissions item in the balance of payments24. With net errors and omissions included, by construction, the three aggregates in balance of
payments sum up to zero.
The current account comprises of four basic items: trade in goods, trade in services, income account and current transfers. The content of items in trade in goods and services are obvious and necessitates no further explanation. The transactions recorded in transfers are transactions “whenever an economy does not receive or supply recompense—in the form of real resources or financial items—for goods, services, income, or financial items supplied to or received from another economy.”
24 I will discuss to what extent the net errors and omissions are due to statistical approximations in the
next section.
(IMF, 1996: 88) The current transfers include government grants and worker’s remittances.
Items in income account, meanwhile, are earnings arising from the provision of the factors of production. As land is associated with residence, the factors of production whose earnings are recorded in balance of payments are labor and capital. Earning on labor are compensations for employees. The income of capital can be divided into two major groups: (1) the income from direct investment are the dividends that investor earns from its direct investments and (2) the income from portfolio and other investments, which includes dividend income earned from equities and interest income from bond investments and trade and other credits.
The capital and financial account has two major sub-accounts, capital account and financial account. Capital account includes capital transfers, i.e., transfer of
ownership of a fixed asset or the forgiveness, by mutual agreement between creditor and debtor, of the debtor’s financial liability when no counterpart is received in return by the creditor. Moreover, the country’s transactions with non-residents in non-produced and nonfinancial assets (such as patents, copyrights, and licenses) are also included in capital account.
The financial account, broadly speaking, keeps track of transactions of financial assets. The credit items represent financial transactions that cause capital inflows to the country; whereas the debit items represent financial transactions that cause capital outflows. Functional classification of the items in financial account results
in four groups: direct investment, portfolio investment, other investment, and reserve
assets. The credit and debit items in the direct investment category represent
direction of investment: credit items are direct investments into the country by non-residents; and debit items are direct investments by residents abroad. In the portfolio and other investment categories the credit items are the transactions related to the liabilities of residents to non-residents; and debit items are transactions related to the assets of non-residents in the home country.
The direct investment category records transactions of investments “in which a resident entity in one economy acquires a lasting interest in an enterprise resident in another economy”, as defined by IMF (1995: 86). This long-lasting interest is conventionally defined as a ten percent share or voting power. It should be noted that not only equity capital and reinvested earnings are recorded in direct investment account, but also the credits by the investor to the invested enterprise are recorded in this category.
The portfolio investment category keeps record of transactions in equities (not recorded under direct investment), other securities (debt instruments, i.e., bills, bonds and notes) and financial derivatives. “The essential characteristic of
instruments classified as portfolio investment is that such instruments are traded or tradable. That is, the instruments offer investors the flexibility to shift, regardless of the underlying maturity of the instrument, invested capital from one instrument to another. Portfolio investors are more concerned than direct investors about rates of
return that are independent of any influence investors may have and about being able to move funds quickly if circumstances so dictate.” (IMF, 1996: 124).
Other investment is a residual category that includes all financial transactions not considered direct investment, portfolio investment, or reserve assets. Other investment category can be divided into four sub-categories: (1) trade credits, (2) other loans, (3) currency and deposits, (4) use of at IMF credits and loans, and (5) other assets and liabilities. Trade credits are to assets and liabilities that arise from the direct extension, during the normal course of trading, of credit from a supplier to a buyer. Loans are financial assets that are created through the lending of funds by a creditor (lender) directly to a debtor (borrower); the lender receives no security evidencing the transaction or receives a nonnegotiable document or instrument. The currency and deposits include the currency issued by foreign governments and held by residents represent claims that holders have on issuing governments and notes and coins that are issued by the economy’s government and held by nonresidents which represent an economy’s external liabilities. The use of IMF credits and loans item is obvious and requires no further explanation.
The last functional category in the financial account is the reserve assets. They consist of financial instruments available to the central authorities for financing or absorbing an imbalance of payments or for regulating the size of such imbalances. As debit items relate to assets held by residents, a debit item (a negative entry) in