OMEGA Int. J. of Mgmt Sci., Vol. 20, No. 4, pp. 523-527, 1992 0305-0483/92 $5.00 + 0.00 Printed in Great Britain. All rights reserved Copyright © 1992 Pergamon Press Ltd
The Effect of Continuous Price Change
in the EOQ
E EREL
Bilkent University, Ankara, Turkey
(Received November 1990; in revised form November 1991)
The sensitivity of the basic economic order quantity (EOQ) model to continuous purchase price changes is explored. The phenomenon of continuous price changes exists in several eonntries and it is not likely to improve. The paper shows that using the ¢onventionui EOQ can be quite cosily and far from optimal, if the holding cost rate is determined erroneously by ignoring the price change.
Key words--inventory, economic order quantity, sensitivity analysis
I. INTRODUCTION order strategy and EOQ strategy for any time horizon of interest have also been developed [14]. THE ECONOMIC order quantity (EOQ) model Some researchers suggest that the EOQ could be has been around for about 75 years. The wide quite sensitive to demand forecast errors when popularity of the model is due to several factors, the lead time is nonzero [10]. The effects of including the ease of teaching, manipulation, advertising, price elasticity and economies of and calculation. In addition, the model is highly scale, and the possibility of some ordered defec- robust to errors in the specification of the cost tive items on the EOQ have been investigated parameters and the demand rate, if the holding [7], as well as the effect of changing the setup rate is relatively low. Although the basic model cost in a dynamic lot size model [17]. Woolsey has several quite restrictive assumptions, these [16] claims that the EOQ model has no sense assumptions have long been relaxed by new of reality due to the considerable uncertainty versions that better represent the real world [13]. present in the values of the parameters. His The objective of this paper is to demonstrate the closing statement is as follows: " I f you continue basic model's sensitivity to continuous purchase to love and use the EOQ without knowing what price changes, a common situation in high- it is costing you, I can only suggest that you inflation countries (such as Turkey, which had deserve each other." In response, Weiss [15] an official average annual inflation rate of 44.3% states that the real problem with the basic EOQ during 1982-1989 [l]). model is that it should attempt to manage and The sensitivity of the model has been examined change the system rather than optimize the with respect to changes in the demand rate, system.
setup cost, holding cost [2], and known future In the studies mentioned above, the planning price changes [11]. Various extensions of the horizon is usually partitioned into two disjoint model were published for situations where the time intervals in which a single or some of the price increase does not coincide with the end cost factors are allowed to differ. This approach of an EOQ cycle [14], and for an optimal policy is suitable when the inflation rate is stable at for the finite and the infinite-horizon problem in low rates or when the cost changes occur which a single change in any or all of the cost infrequently. Models incorporating inflation factors is allowed [8]. Cost expressions of special have been developed [5, 13]; these studies have
524 Erel--The Effect of Continuous Price Change in the EOQ
assumed that the inflation rate is constant and where p is the deviation rate from Q*, then used the present value analysis. The objective o f the percentage cost penalty for not using Q* this paper is to examine the effect o f continuous is
50[p2/(1 +
p)] [13]. Thus, in most cases in- purchase price changes on the total cost o f the expensive and crude estimates of the parameters basic EOQ model in a typical year. would suffice and certain order quantities may In the following section, the basic E O Q m o d e l have additional appeal over Q* due to the is outlined. In the third section, the effects o f factors and constraints which are not included purchase price changes on the basic EOQ model in the model [13].are analyzed, and an approximate analytical expression for the optimal order quantity is
3. EFFECT OF PURCHASE PRICE CHANGE developed. Finally, in the last section, some ON THE BASIC EOQ MODEL concluding remarks on this study are given.
Suppose the purchase price o f the item 2. BASIC EOQ MODEL changes continuously at an annual rate of p. In other words, the purchase price of the item The basic EOQ model attempts to identify C increases to (1
+p)C
in one year. A nonzero the order size Q that will minimize the sum p value implies an increase in TC; the annual o f the annual costs o f holding and ordering holding and purchasing costs would be larger the inventory and the cost o f purchasing the than the ones in the TC expression of the inventory. The total annual cost associated with basic model. Note that the annual ordering cost holding, ordering and purchasing the inventory is unaffected. The revised total annual cost can be expressed as follows: expression, TCp, can be written as follows:TC = DS/Q + QIC/2 + DC TCp = DS/Q 4- QC[I 4- (QI/2D)] [p/{(1 + p)qm _ I}].
where D is the annual demand rate, S is the The derivation of the above expression is shown setup (ordering) cost, Q is the order quantity, in Appendix A. The graph of TCp as Q increases I is the holding cost rate, and C is the unit from zero to 2D is depicted in Fig. 1 for different purchase cost. Note that the last term in the p values. The other parameters in the figure are expression can be neglected since it is a con- as follows: D = 1000, C = 1, S = 100, I = 0.5. stant; it is included to express the exact value If an upper bound is imposed on the order o f TC and the effect o f a change in C will be quantity, then as depicted in Fig. 1, for p examined in the following sections, larger than a critical value, Pc, the upper bound Inventory holding cost is the relatively becomes the optimal order quantity. F o r p < Pc, ambiguous cost factor in the model. It includes both the optimal order quantity, Q * , and the the opportunity cost of the money invested associated optimal total cost, TCp(Q*), increase and the expenses to hold the item in stock and as p increases. The constraint of imposing an is estimated by management accountants. It is upper bound on the order quantity is a fie- lower bounded by the cost of money to the firm quently encountered situation in real life; for and upper bounded by the best rate o f return example, one of the several nonbinding con- o f the most desired product in an expanding straints, such as warehouse, finance, etc., turns market. The value o f I is suggested to be typically
in the range 0.15-0.35 [6, 12]. 3o0o -
The optimum value of Q, Q*, is usually
referred to as Wilson's economic lot size and 2s0o i ~ pP =0.4 = 0.0
may be expressed as follows: ~ ~ - - - p = 1.o
Q , = (2DS/IC)t/2. ~ 2000
The TC curve is quite flat in the area o f Q* ~- 150o
especially if I is relatively small, and this has k _ . . .
been recognised quite a while ago [3, 4]. This 10o0 I I I . . . -t implies that reasonably sized deviations from o soo looo l soo aooo Q* have little impact on TC; for example, if a Order quantity
Omega, Vol. 20, No. 4 525 into a binding one as Q increases. The analysis identical to the ones in Fig. 1. The ratio values conducted on the value of Pc by solving prob- are close to unity for small p; especially for lems with parameters of extreme values suggests large/, they are close to unity for significantly that p, is smaller than I. large p. On the other hand, the ratio values are The optimal order quantity, Q*, associated significantly smaller than unity for p larger than with p could be obtained by setting dTCp/dQ I. I is expected to be at least equal to or larger equal to zero and solving for Q. Unfortunately, than the purchase price change rates, since I the roots of the resulting expression cannot be includes the opportunity cost which is related to determined directly. However, an approximate the price changes and the expenses of holding analytical expression for the roots can be the item in stock. In other words, the portion derived using the Taylor series expansion of of the graph in which the ratio values are close
dTCp/dQ
at Q = D. ThedTCp/dQ
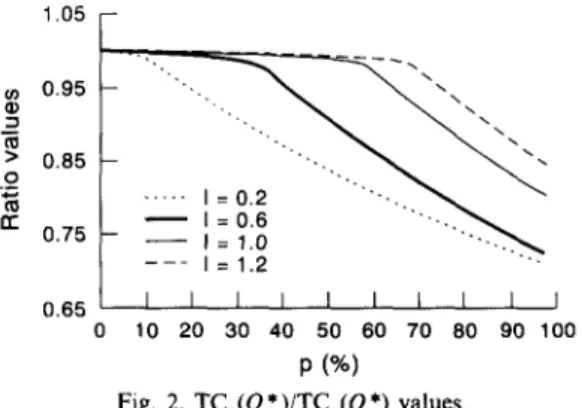
expression to unity is relevant. Thus, determining the value and the approximate analytical expression of of I with the purchase price change being taken Q* are given in Appendix B. into account diminishes the detrimental effects The effect of using Q* which ignores the of a nonzero p on the basic model. On the other purchase price change can be determined as hand, an erroneously determined I can result follows: Let TCp(Q*) denote the cost associated in significantly low ratio values. The ratio with the optimal order quantity calculated by values decrease down to 0.71, 0.72, 0.80, 0.84 for considering the price change and let TCp(Q*) I values of 0.2, 0.6, 1.0, 1.2, respectively, for denote the cost associated with Q* calculated p values up to 1. This suggests that the model by ignoring the price change. Note that the with continuous price change is highly sensitive calculation of TCp(Q*) involves the price to the errors in the value of I.change. The ratio,
TCp(Q*)/TCp(Q*)measures
The model is quite robust to changes in D the sensitivity of the basic model to purchase and S. A ceteris paribus analysis conducted price changes. TCp(Q*) can be found either by to examine the effect of varying D and S on utilizing the approximate analytical expressionTCp(Q*)/TCp(Q*)
reveals that the effects are of Q* given in Appendix B or by evaluating the relatively minor.TCp expression for the possible order quantities.
Since the analytical expression of Q* is an 4. CONCLUDING REMARKS approximate one, order quantities from zero
to 2D are considered with increments of 0.02D In this article, it is shown that utilizing the
in the analysis below, basic EOQ model in an environment with
As p increases, the aforementioned ratio value continuous purchase price changes can result is expected to decrease, since an increasing p in significant losses, especially if the important implies increasing annual holding and purchase relationship between p and I cannot be estab- costs and the increases in these cost terms would lished due to erratic price changes. The amount cause Q* to deviate from the optimal value, of loss is highly sensitive to p and L for p values Figure 2 depicts the ratio of TCp(Q*) and larger than I, the amount of loss can be of TCp(Q*) for p values from zero to 1 and I values significant size. Fortunately, such cases are quite from 0.2 to 1.2. The other parameters are unrealistic, since the computation o f / i n c l u d e s the opportunity cost and the various expenses
1.05 - to hold the item in stock. It is also noted that
other parameter values have little effect on the ®
~59.0
'",.,..,---'=~
~ , optimal total cost value.= It can be argued that a new EOQ could be
0.85 calculated at the beginning of each replenish-
o ment cycle; thereby, the purchase price change
I= 0.6 ... ~ is taken into account. On the other hand, the w 0.7s - ___-- I=l=l.al.0 .... ~ EOQ is often used as an approximate model 0.8~ I I I L t t I for a majority of items (especially B and C
0 10 20 30 40 50 60 70 80 90 100 items which are of medium or low importance)
p (%) whose policies one does not want to update
526 Erel--The Effect of Continuous Price Change in the EOQ
An approximate analytical expression for the 25oo - - - Roots of polynomial optimal order quantity for an annual change ~ Exact opt. quantity rate o f p is also developed by Taylor series ~ 2000
expansion. Comparison o f the approximate and "~ ~ exact values shows that the difference between o 1500 - the value o f one o f the roots and the exact ~ value is negligibly small. On the other hand, the ,.- 1000 - other root yields results significantly far from ~
the exact value. 500 ---q I I I I I
0.05 0.10 0.15 0.20 0.25 0.30 p
A P P E N D I X A Fig. 3. Exact and approximate values of Q*.
The purchase price increases to
C(1 +p)t/-~)(Q/o) at the beginning of the j t h The roots of the polynomial formed by the first cycle, since the length o f a cycle is Q / D . The three terms o f the Taylor series can be found as annual purchase price and the annual holding follows:
cost o f the item are
Q* = [Df"(D) - f ' ( D ) O/Q + { [ f ,(D)12 _ 2f,,(O)f(D)}t/2]/f,,(D) QC ~. (I + p)ti-I~Q:o) J= ' where a n d O/Q f ( D ) = --S/D + C[1 + 1] -- Cp,[1 +//21 [QIC/2] [Q/D] ~_, (I +p)t~-l)(O/o) j=l f ' ( O ) = 2S/D 2 + CI/O -- [2Cp,/D] [1 + I]
respectively, since there are D / Q cycles in a year.
+ [Cp2/D ] [1 + 1/2]
Thus, the revised total cost expression, TCp, can
be written as follows: f " ( D ) = - 6 S / D 3 + [3Cp2/D 2] [1 + I] O/Q -- [3Clpl/D 2] - [Cp3/D
2]
[1 + 1/2] TCp = DS/Q + [Q21C/2D] ~ (1 + p)CJ-O~Q/D) j= ~ and D/Q + QC ~ (1 +p)U-I~0/o) p~ = [(1 + p ) I n (1 +p)]/p j = l The summation p2 = lP~ (2 + p ) In (1 +p)l/p o/0 P3 = [PJ (p2 + 6p + 6) In 2 (1 +p)]/p2 (I +p)tJ-l)(ew):=' Figure 3 depicts the two roots o f the poly-
can be written as [p/{(1 + p ) Q / n _ 1}], since nomial for the problem depicted in Fig. 1.
N Figure 3 also depicts the exact Q* values for the
x" = (1 - x N÷ ~)/(1 - x) same problem. The exact values o f Q* are found
.=o by considering order quantities from zero to 2D
for x ( x # 0 or x # 1). Thus, TCp expression can with increments of 0.02D. Note that Pc is 0.29. be simplified to the following:
R E F E R E N C E S
TCp = DS/Q + QC[1 + (QI/2D)] [p/{(1 + p)Q/O _ I}].
1. The Central Bank of the Republic of Turkey (1990)
Q. Bull. I, 155.
A P P E N D I X B 2. Dobson G (1988) Sensitivity of the EOQ model to parameter estimates. Opns Res. 36(4), 570-574.
TCp = DS/Q + QC[1 + (QI/2D)] [p/{(1 + p)O/D _ 1 }] 3. Eilon S (1960) A note on the optimal range. Mgmt Sci.
7(1), 56-61.
Differentiating TCp with respect to Q results in 4. Eilon S (1963) Elements of Production Planning and
the following expression: Control. Macmillan, New York.
5. G u r n a n i C (1983) Economic analysis of inventory
dTCp/dQ = - D S / Q 2 + C[1 + QI/D] systems. Int. J. Prodn Res. 21(2), 261-277.
x [p/{(1 +p)Qm _ 1}] -- QC[1 + QI/2D] 6. Johnson LA and Montgomery DC (1974) Operations Research in Production Planning, Scheduling, and
Omega, I"ol. 20, No. 4 527 7. Lee HL and Rosenblatt MJ (1986) The effects of vary- for Inventory Management and Production Planning,
ing marketing policies and conditions on the economic 2nd edn. Wiley, New York.
order quantity. Int. J. Prodn Res. 24(3), 593-598. 14. Taylor SG and Bradley CE (1985) Optimal ordering 8. Lev B and Weiss HJ (1990) Inventory models with cost strategies for announced price increases. Opns Res.
changes. Opns Res. 38(1), 53-63. 33(2), 312-325.
9. Markowski EO (1990) Criteria for evaluating purchase 15. Weiss EN (1990) Lot sizing is dead: Long live lot sizing. quantity decisions in response to future price increases. Prodn Inv. Mgmt J. (lst Quarter), 76-78.
Eur J. Opns Res. 47(3), 364-370. 16. Woolsey G (1988) A requiem for the EOQ: An editorial. 10. Mykytka EF and Ramberg JS (1984) On the sensitivity Prodn Inv. Mgmt J. (3rd Quarter), 68-72.
of the EOQ to errors in the forecast of demand, l i e 17. Zangwill Wl (1987) From EOQ towards ZI. Mgmt Sci.
Trans. 16(2), 144-151. 33(10), 1209-1223.
I 1. Naddor E (1966) Inventory Systems. Wiley, New York.
12. Schonberger RJ (1985) Operations Management, ADDRESS VOR CORI~ESeONDENCE: Erdal Erel, Bilkent
2nd edn. Business Publications, Texas. University, Department of Management, 06533 Bilkent,