Adsorption of Cationic Dye from Aqueous Solution by Clay as an Adsorbent:
Thermodynamic and Kinetic Studies
1BAYBARS ALI FİL* AND 2CENGIZ OZMETİN**
1Ataturk University, Faculty of Engineering, Department of Environmental Engineering, 25240, Erzurum, Turkey.
2Balikesir University, Faculty of Engineering - Architecture, Department of Environmental Engineering, 10145, Balikesir, Turkey.
[email protected]*, [email protected]** (Received on 4th January 2012, accepted in revised form 7th January 2012)
Summary: In the study, montmorillonite was used as an adsorbent for the removal of methylene blue (MB) from aqueous solutions. Batch studies were performed to address various experimental parameters like contact time, pH, temperature, stirring speed, ionic strength, adsorbent dosage and initial concentration for the removal of this dye. Adsorption rate increased with the increase in initial dye concentration, ionic strength, stirring speed, pH and temperature. Kinetic study showed that the adsorption of dye on montmorillonite was a gradual process. Quasi-equilibrium reached in 3 h. Pseudo-first-order, pseudo-second-order, Elovich, Bangham, mass transfer and intra-particle particle diffusion models were used to fit the experimental data. Pseudo-second-order rate equation was able to provide realistic description of adsorption kinetics. Intra-particle diffusion process was identified as the main mechanism controlling the rate of the dye sorption. The diffusion coefficient, D, was found to increase when the stirring speed, ionic strength and temperature were raised. Thermodynamic activation parameters such as ∆G*, ∆S* and ∆H* were also calculated.
Keywords: Montmorillonite; Dyes; Adsorption; Adsorption kinetics; Activation parameters; Thermodynamics.
Introduction
Dyes are synthetic organic compounds that are increasingly being produced and used as colorants in many industries worldwide, including textile, plastic, paper, etc. [1, 2]. Most of the dyes are toxic and carcinogenic compounds; they are also recalcitrant and thus stable in the receiving environment, posing a serious threat to human and environmental health. Accordingly, to protect humans and the receiving ecosystem from contamination, the dyes must be eliminated from the dye-contained wastewaters before being released into the environment. Because dye molecules are resistant to biodegradation [3], biological processes are not useful or efficient methods for the removal of dyes from effluent.
Dyes are usually stable to photo-degradation, bio-degradation and oxidizing agents [4], which led to intensive investigations on physical or chemical methods to remove color from textile effluent. These studies include the use of coagulants [5], ultra-filtration [6] and electro-chemical [7, 8]. The advantages and disadvantages of each technique have been extensively reviewed [9].
One of the conventional methods for removal of dyes from wastewater is adsorption [10-13]. The adsorption process provides an attractive alternative treatment, especially if the adsorbent is inexpensive and readily available. Activated carbon is popular and an effective dye sorbent, but its
relatively high price, high operating costs and problems with regeneration hamper its large-scale application. Therefore, there is a growing need in finding low cost, renewable, locally available materials as sorbent for the removal of dye colors [14-16].
A large variety of non-conventional adsor-bent materials have been also proposed and studied for their ability to remove dyes [1]. Therefore, in recent years, many investigators have studied the feasibility of using low cost substances, such as: plum kernels [17], chitin [18] ,chitosan [19], perlite [20], natural clay [21, 22], bagasse pith [23], fly ash [24, 25], wood [26, 27], rice husk [28] and peat [29, 30].
The aim of this study is to further explore the application of montmorillonite for dye adsorption and to investigate the kinetics and mechanism involved in dye adsorption on montmorillonite. Therefore, the dynamical behaviors of adsorption were measured on the effect of contact time, agitation speed, ionic strength, adsorbent dosage, pH and temperature. The adsorption rates were determined quantitatively and simulated by the Elovich, the pseudo-first-order and second-order models, and then adsorption mechanism was analyzed using mass transfer coefficient. Bangham’s equation and intra-particle diffusion, Furthermore, thermodynamic activation parameters were also determined.
Results and Discussion Adsorption Rate
Adsorption rate was investigated using the values of dye adsorbed at different initial dye concentrations, stirring speeds, adsorbent dosages, ionic strengths, temperatures and pHs as a function of reaction time.
Effect of Initial pH Solution
The surface adsorption rate of methylene blue on montmorillonite was investigated in pH range of 5 – 11 at 303 K, 0.3 g L-1 adsorbent dosage and
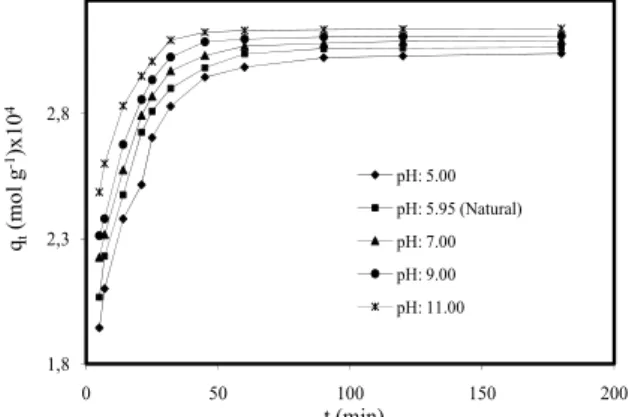
200 rpm stirring speed. The studies were carried out for 3 h. Initial dye concentration was 1.0x10⁻⁴ mol L -1. Fig. 1 showed the effect of pH on the removal rate
of MB on montmorillonite. The adsorption of MB by montmorillonite was increased with increase in pH. This can be explained by considering the pHiep of montmorillonite. As pH of the system decreased below the pHiep of the adsorbent, the number of negatively charged adsorbent sites decreased and the positively charged surface sites increased, which did not favor the adsorption of cationic dyes due to electrostatic repulsion. At higher pH, negatively charged adsorbent sites increased, which enhances the adsorption of positively charged dye cations through electrostatic forces of attraction [31].
1,8 2,3 2,8 0 50 100 150 200 qt (mol g -1)x10 4 t (min) pH: 5.00 pH: 5.95 (Natural) pH: 7.00 pH: 9.00 pH: 11.00
Fig. 1: Effect of solution pH on dye adsorption on montmorillonite (Conditions: initial MB 1.0×10⁻⁴ mol L-1. adsorbent dosage 0.3 g L -1, temperature 303 K, stirring speed 200
rpm, ionic strength 0 mol L-1 NaCl). Effect of Ionic Strength
The presence of co-ions in solution can affect the sorption of MB. The effect of salt concentration (ionic strength) on the amount of dye
sorbed by the clay was analyzed over the NaCl concentration ranging from 0 to 0.1x10⁻¹ mol L−1 and
the results were shown in Fig. 2. As seen in Fig. 2, the presences of NaCl significantly affected the absorption rate of dye. The presence of NaCl in the solution may have two opposite effects. On the one hand, since the salt screens the electrostatic interaction of opposite changed of the oxide surface and the dye molecules, the adsorbed amount should decreased with increasing of NaCl concentration. On the other hand, the salt causes an increase in the degree of dissociation of the dye molecules by facilitating the protonation [12, 29, 32].
2,0 2,3 2,5 2,8 3,0 0 50 100 150 200 qt (m ol g -1)x10 4 t (min) 0 mol/L NaCl 0.001 mol/L Na Cl 0.010 mol/L NaCl 0.100 mol/L NaCl
Fig. 2: Effect of ionic strength on dye adsorption on montmorillonite (Conditions: initial MB 1.0×10⁻⁴ mol L1, adsorbent dosage 0.3 g L-1,
temperature 303 K, stirring speed 200 rpm, solution pH 5.95 (Natural)).
Effect of Stirring Speed
The variation of adsorption of methylene blue dyes by montmorillonite stirring speed range (100 – 400 rpm) at an initial dye concentration of 1.0x10⁻⁴ mol L-1, a temperature of 303 K and natural
pH was shown in Fig. 3. In the batch adsorption systems, agitation speed plays a significant role in affecting the external boundary film and the distribution of the solute in the bulk solution [33]. The results showed that the adsorption rate of MB almost remained unchanged as agitation speed was increased. A similar trend was observed for varying agitation speeds at different times. These observations can be explained by the fact that the boundary layer resistance was very small and the mobility of the system was high under the experimental conditions. In other words, the diffusion of the MB ion from the solution to the surface of the montmorillonite and into the pores occurred quickly and easily. Since the uptake of MB was not significantly influenced by the degree of agitation. Therefore an agitation speed of 200 rpm was used for all further experiments.
1,8 2,2 2,6 3,0 0 50 100 150 200 qt (mo lg -1)x 10 4 t (min) 100 rpm 200 rpm 300 rpm 400 rpm
Fig. 3: Effect of stirring speed on dye adsorption on montmorillonite (Conditions: initial MB 1.0×10⁻⁴ mol L-1, adsorbent dosage 0.3 g L -1, temperature 303 K, ionic strength: 0 mol
L-1 NaCl, solution pH 5.95 (Natural)) Effect of Initial Dye Concentration
The influence of initial dye concentration on the MB adsorption kinetic was studied with a series of experiments at different MB concentrations (1.0×10⁻⁴ – 3.0×10⁻⁴ mol L-1). The results showed
that the amount of MB adsorbed increased as the dye concentration increased (Fig. 4). Results showed that increased initial MB concentration led to increased MB adsorption. Apparently, the initial MB concentration plays an important role in affecting the capacity of MB to absorb onto montmorillonite. The higher the MB concentration is, the stronger the driving forces of the concentration gradient, and therefore the higher the adsorption capacity [34].
2 3 4 5 6 0 50 100 150 200 qt (mo l g -1)x 10 4 t(min) 0.00010 mol/L 0.00015 mol/L 0.00020 mol/L 0.00025 mol/L 0.00030 mol/L
Fig. 4: Effect of initial dye concentration on dye adsorption on montmorillonite (Conditions: stirring speed 200 rpm, adsorbent dosage 0.3 g L-1, temperature 303 K, ionic strength 0
mol L-1 NaCl, solution pH 5.95 (Natural)) Effect of Adsorbent Dosage
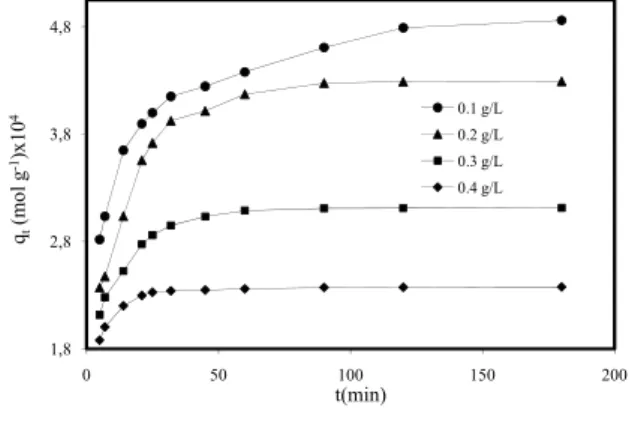
The sorbent mass was varied from 0.1 to 0.4 g L-1 keeping the MB concentration constant (1.0x10 -4 mol L-1) and the results were shown in Fig. 5. The
percentage of MB sorption increased with the increase of sorbent amount from 0.1 to 0.4 g L-1 but
the uptake capacity of the adsorbent decreased from.
This may be attributed to the availability of more sorption sites due to higher amount of the sorbent. At higher montmorillonite to solute ratios, there is a very fast sorption onto the sorbent surface that produces a lower solute concentration in the solution compared to the sorbent to solute concentration ratio is lower [35]. 1,8 2,8 3,8 4,8 0 50 100 150 200 qt (mo l g -1)x10 4 t(min) 0.1 g/L 0.2 g/L 0.3 g/L 0.4 g/L
Fig. 5: Effect of adsorbent dosage on dye adsorption on montmorillonite (Conditions: initial MB 1.0×10⁻⁴ mol L-1, stirring speed
200 rpm, temperature 303 K, ionic strength 0 mol L-1 NaCl, solution pH 5.95 (Natural)) Effect of Temperature
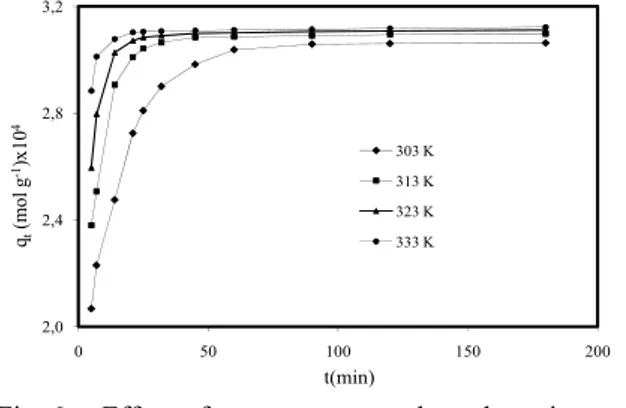
It has been believed that the temperature generally has two major effects on the adsorption process. Increasing the temperature will increase the rate of diffusion of the adsorbate molecules across the external boundary layer and in the internal pores of the adsorbent particle, owing to the decrease in the viscosity of the solution. In addition, changing the temperature will change the equilibrium capacity of the adsorbent for a particular adsorbate [36]. Fig. 6 showed the effect of temperature on dynamic adsorption of MB on montmorillonite. It was seen that higher temperature will result in an increase in dye adsorption on montmorillonite, suggesting that the dye adsorption is an endothermic process. The temperature seems to have a significant effect on MB adsorption.
Adsorption Kinetics
The kinetics of adsorption data was processed to understand the dynamics of adsorption process in terms of the order of rate constant. Three kinetic models were applied to the adsorption kinetic data in order to investigate the behavior of adsorption process of methylene blue onto montmorillonite. These models are the Elovich, the pseudo-first-order and pseudo-second order models.
2,0 2,4 2,8 3,2 0 50 100 150 200 qt (mo l g -1)x 10 4 t(min) 303 K 313 K 323 K 333 K
Fig. 6: Effect of temperature on dye adsorption on montmorillonite (Conditions: initial MB 1.0×10⁻⁴ mol L-1, stirring speed 200 rpm,
ionic strength 0 mol L-1 NaCl, solution pH
5.95 (Natural)).
The Elovich Equation
The Elovich model equation is generally expressed as
(
)
e x p t t d q q d t =α −β (2)To simplify the Elovich, [37] αβ>t and by applying the boundary conditions qt=0 at t=0 and
qt=qt at t=t, Eq(2) becomes
(
)
1 ln 1 ln t q α β t β β = + (3)The plot of qt versus ln t should yield a
linear relationship with a slope 1/β and an intercept of
1/β ln(αβ). The α initial adsorption rate (mol g-1 min -1) and β desorption constant (g mol-1) values, the
correlation coefficients. R2, were given in Table-1.
From these mechanisms, it was observed that the Elovich kinetic model did not adequately fit the experimental values (0.8205 < R2 < 0.9896).
Pseudo-first-order Kinetic Model
The rate constant of adsorption is determined from the first-order rate expression given by Lagergren and Svenska [38]. which is the earliest known equation describing the adsorption rate based on the adsorption capacity. The differential equation is generally expresses a follows:
(
)
1 t e t d q k q q d t = − (4)where k1 is the rate constant of pseudo-first-order
adsorption and qe represents adsorption capacity (i.e.
the amount of adsorption corresponding to monolayer
coverage). After definite integration by applying the initial conditions t = 0 to t and qt = 0 to qt Eq. (4)
becomes:
(
)
1ln qe −qt = lnqe−k t (5) where qe and qt are the amount of dye adsorbed (mol
g-1) at equilibrium and at any time t, k
1 is the rate
constant (min− 1). The plot of ln (qe − qt) versus t
gives a straight line for the pseudo-first-order adsorption kinetics. The values of the pseudo-first-order rate constant k1 were obtained from the slopes
of the straight lines. The k1 values, the correlation
coefficients, R2, were given in Table-1. From this
table, it has been seen that while pseudo-first-order kinetic model was not fit very well (0.6512 < R2 <
0.9694).
Pseudo-second-order Kinetic Model
Adsorption kinetics was explained by the pseudo-second-order model developed by [39]:
(
)
2 2 t e t d q k q q d t = − (6)Integrating this equation for the boundary condition (t = 0 to t and qt = 0 to qt), gives:
2 2 1 1 t e e t t q k q q = + (7)
Where k2 is the equilibrium rate constant of
pseudo-second-order equation (g mol-1 min-1) and h=k 2qe2 is
initial adsorption rate (mol g-1 min-1). If the
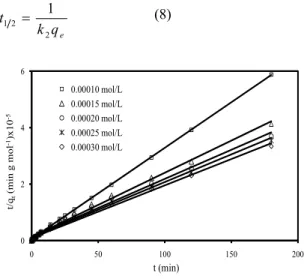
second-order kinetics is applicable, then the plot of t/qt versus t should show a linear relationship. There is no need to know any parameter beforehand and the equilibrium adsorption capacity, qe, can be calculated from Eq. (7). Also, it is more likely to predict the behavior over the whole range of adsorption. Values of k2 and qe were calculated from the intercept and
slope of the plots of t/qt versus t. The linear plots of
t/qt versus t (Fig. 7) showed a good agreement
between experimental. The correlation coefficients (R2) were 0.9912 – 1.0000 (Table-1), suggested a
strong relationship between the parameters and also explained that the process followed pseudo-second-order kinetics. Kinetics of MB adsorption on montmorillonite followed the pseudo second order model, suggesting that the rate-limiting step may be chemisorptions [40, 41]. This confirmed that adsorption of dye took place probably via surface exchange reactions until the surface functional sites were fully occupied; thereafter dye molecules diffused into the polymer network for further
interactions (such as inclusion complex, hydrogen bonding, hydrophobic interactions). Similar results were obtained in the methylene blue adsorption onto clay [42], cationic dyes (methylene blue, crystal violet) adsorption to palygorskite [43], cationic dyes (Basic Blue 3, Basic Violet 3) adsorption onto a cyclodextrin polymer [11], cationic dyes (Basic Yellow 28, Methylene Blue, Malachite Green) adsorption onto Persian Kaolin [44] and cationic dyes (methylene blue, methyl violet) adsorption onto sepiolite [12].
The half-adsorption time of the dye, t1/2, i.e.
the time required for the montmorillonite to uptake half of the amount adsorbed at equilibrium, is often considered as a measure of the rate of adsorption and for the second-order process is given by the relationship [45]: 1 2 2 1 e t k q = (8) 0 2 4 6 0 50 100 150 200 t/ qt (min g m o l -1)x 10 -5 t (min) 0.00010 mol/L 0.00015 mol/L 0.00020 mol/L 0.00025 mol/L 0.00030 mol/L
Fig. 7: Second-order kinetic equation for adsorption of methylene blue on montmorillonite at different initial dye concentrations (Conditions: stirring speed 200 rpm, adsorbent dosage 0.3 g L-1, temperature 303
K, ionic strength 0 mol L-1 NaCl, solution
pH 5.95 (Natural)).
The determined values of t1/2 for the tested
parameters were given in Table-1.
Adsorption Mechanism
The removal of methylene blue by adsorption on montmorillonite was found to be rapid at the initial period of contact time and then to become slow and stagnate with the increase in contact time. The removal of methylene blue by adsorption on surface of montmorillonite was due to
MB as MB+ cationic form. The mechanism for the
removal of dye by adsorption may be assumed to involve the following three steps.
The adsorption process of the adsorbate molecules from the bulk liquid phase onto the adsorbent surface is presumed to involve three stages: (1) mass transfer of the adsorbate molecules across the external boundary layer; (2) intraparticle diffusion within the pores of the adsorbent; (3) adsorption at a site on the surface.
Mass transfer coefficient
Mass transfer coefficients, βL (m s−1) of
methylene blue at the montmorillonite-solution interface, were determined by using the Eq. (9) [46]:
0 1 1 ln ln 1 1 L S t C mK mK S t C mK mK mK β − = − + + + (9)
where K is the adsorption constant (L mol−1), m is the
weight of adsorbent per liter of solution (g L-1) and S S
is the surface area of adsorbent (m2 g−1). A linear
graphical relation between ln[(Ct/C0)−1/(1+ mK)] versus t was not obtained. In plotting the curves, K value for the adsorption of methylene blue onto montmorillonite was calculated. This result indicated that the model mentioned above for the system was not validity. The correlation coefficients, R2,
calculated from equation mentioned above were given in Table-2.
Bangham’s Equation
Kinetic data can further be used to check whether film diffusion is the only rate-controlling step or not in the adsorption system using Bangham’s equation [47]:
( )
0 0
0
log log log log
2, 303 B B t C k m t C q m V α = + − (10)
where C0 is the initial concentration of adsorbate in
solution (mol L-1), V is the volume of solution (ml), m
is the weight of adsorbent per liter of solution (g L-1), qt (mol g-1) is the amount of adsorbate retained at
time t, and αB (less than 1) and k0B are constants (ml
g-1 L) (Table-2). The double logarithmic plot did not
yield satisfactory linear curves for the removal of MB onto montmorillonite (0.857 < R2 < 0.983). This
showed that the film diffusion was not the only rate controlling parameter. It may be concluded that the film and pores diffusion were important to different extents in the removal process [48].
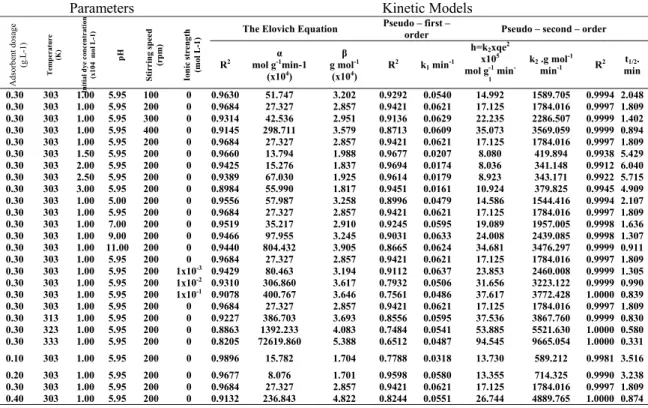
Table-1: The comparison of the Elovich, first-order and second-order rate constant and correlation coefficients at different conditions.
Parameters Kinetic Models
The Elovich Equation Pseudo – first – order Pseudo – second – order
Ad so rben t d os ag e (g .L -1 ) Tem pera ture (K ) In it ia l d ye c on cen tr at io n (x 104 m ol L -1) pH Sti rrin g speed (rpm) Ion ic streng th (mol L -1 ) R2 mol gα -1min-1 (x104) β g mol-1 (x104) R 2 k 1 min-1 h=k2xqe2 x105 mol g-1 min -1 k2 .g mol-1 min-1 R2 min t1/2. 0.30 303 1.00 5.95 100 0 0.9630 51.747 3.202 0.9292 0.0540 14.992 1589.705 0.9994 2.048 0.30 303 1.00 5.95 200 0 0.9684 27.327 2.857 0.9421 0.0621 17.125 1784.016 0.9997 1.809 0.30 303 1.00 5.95 300 0 0.9314 42.536 2.951 0.9136 0.0629 22.235 2286.507 0.9999 1.402 0.30 303 1.00 5.95 400 0 0.9145 298.711 3.579 0.8713 0.0609 35.073 3569.059 0.9999 0.894 0.30 303 1.00 5.95 200 0 0.9684 27.327 2.857 0.9421 0.0621 17.125 1784.016 0.9997 1.809 0.30 303 1.50 5.95 200 0 0.9660 13.794 1.988 0.9677 0.0207 8.080 419.894 0.9938 5.429 0.30 303 2.00 5.95 200 0 0.9425 15.276 1.837 0.9694 0.0174 8.036 341.148 0.9912 6.040 0.30 303 2.50 5.95 200 0 0.9389 67.030 1.925 0.9614 0.0179 8.923 343.171 0.9922 5.715 0.30 303 3.00 5.95 200 0 0.8984 55.990 1.817 0.9451 0.0161 10.924 379.825 0.9945 4.909 0.30 303 1.00 5.00 200 0 0.9556 57.987 3.258 0.8996 0.0479 14.586 1544.416 0.9994 2.107 0.30 303 1.00 5.95 200 0 0.9684 27.327 2.857 0.9421 0.0621 17.125 1784.016 0.9997 1.809 0.30 303 1.00 7.00 200 0 0.9519 35.217 2.910 0.9245 0.0595 19.089 1957.005 0.9998 1.636 0.30 303 1.00 9.00 200 0 0.9466 97.955 3.245 0.9031 0.0633 24.008 2439.085 0.9998 1.307 0.30 303 1.00 11.00 200 0 0.9440 804.432 3.905 0.8665 0.0624 34.681 3476.297 0.9999 0.911 0.30 303 1.00 5.95 200 0 0.9684 27.327 2.857 0.9421 0.0621 17.125 1784.016 0.9997 1.809 0.30 303 1.00 5.95 200 1x10⁻³ 0.9429 80.463 3.194 0.9112 0.0637 23.853 2460.008 0.9999 1.305 0.30 303 1.00 5.95 200 1x10⁻² 0.9310 306.860 3.617 0.7932 0.0506 31.656 3223.122 0.9999 0.990 0.30 303 1.00 5.95 200 1x10⁻¹ 0.9078 400.767 3.646 0.7561 0.0486 37.617 3772.428 1.0000 0.839 0.30 303 1.00 5.95 200 0 0.9684 27.327 2.857 0.9421 0.0621 17.125 1784.016 0.9997 1.809 0.30 313 1.00 5.95 200 0 0.9227 386.703 3.693 0.8556 0.0595 37.536 3867.760 0.9999 0.830 0.30 323 1.00 5.95 200 0 0.8863 1392.233 4.083 0.7484 0.0541 53.885 5521.630 1.0000 0.580 0.30 333 1.00 5.95 200 0 0.8205 72619.860 5.388 0.6512 0.0487 94.545 9665.054 1.0000 0.331 0.10 303 1.00 5.95 200 0 0.9896 15.782 1.704 0.7788 0.0318 13.730 589.212 0.9981 3.516 0.20 303 1.00 5.95 200 0 0.9677 8.076 1.701 0.9598 0.0580 13.355 714.325 0.9990 3.238 0.30 303 1.00 5.95 200 0 0.9684 27.327 2.857 0.9421 0.0621 17.125 1784.016 0.9997 1.809 0.40 303 1.00 5.95 200 0 0.9132 236.843 4.822 0.8244 0.0551 26.744 4889.765 1.0000 0.874
Intra-particle Diffusion Model
The intraparticle diffusion model proposed by Furusawa and Smith [49] is applied to study the adsorption process, which is written as:
1/ 2
t dif
q
=
k t
+
C
(11)where qt (mol g-1) is the amount of solute on the
surface of the sorbent at time t, kdif is the intraparticle
diffusion rate constant (mol g−1 min-1/2) and C is the
intercept (mol g−1) and it gives an idea of the
thickness of the boundary layer. The kdif values are
found from the slopes of qt versus t1/2 plots. If the
intraparticle diffusion is involved in the adsorption process, then the plot of the square root of time versus the uptake (qt) would result in a linear
relationship, and the intraparticle diffusion would be the controlling step if this line passed through the origin. When the plots do not pass through the origin, this is indicative of some degree of boundary layer control and these further shows that the intraparticle diffusion is not the only rate controlling step, but also other processes may control the rate of adsorption.
The kdif values were calculated by using
correlation analysis (Table-2). The correlation coefficients, R2 are close to unity indicating the
application of this model. This functional relationship corresponds to the characteristic of intra-particle
diffusion. The intra-particle diffusion plots have been given in Fig. 8. The values of intercept give an idea about the boundary layer thickness. i.e., the larger intercept the greater is the boundary layer effect [12]. The applicability of intra-particle diffusion model indicates that it is the rate-determining step. Similar results were obtained for basic red 22 on pith [50] and methylene blue on perlite [20].
1 2 3 4 5 0 5 10 15 qt (m ol g -1)x 10 4 t1/2(min1/2) 0.00010 mol/L 0.00015 mol/L 0.00020 mol/L 0.00025 mol/L 0.00030 mol/L
Fig. 8: Intra-particle diffusion plots for adsorption of methylene blue on montmorillonite at different initial dye concentrations (Conditions: stirring speed 200 rpm, adsorbent dosage 0.3 g L-1, temperature 303
K, ionic strength 0 mol L-1 NaCl, solution
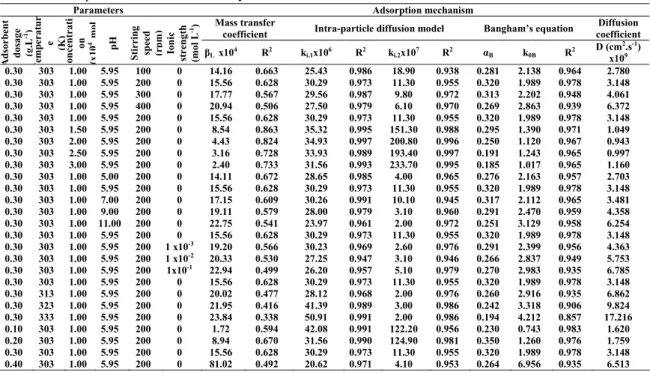
Table-2: Adsorption mechanism for methylene blue onto montmorillonite.
Diffusion Coefficient
The values of diffusion coefficient largely depend on the surface properties of adsorbents. The diffusion coefficients for the intra-particle transport of methylene blue within the pores of montmorillonite particles have been calculated at different temperatures, stirring speed, ionic strength, initial dye concentrations and pH by employing the Eq. (12) [20, 51]: 2 0 1 2 0 , 0 3 0 r t D = (12)
where D is the diffusion coefficient with the unit cm2
s−1; t
1/2 is the time, min, for half adsorption of
methylene blue and r0 is the radius of the adsorbent
particle in cm. The value of r0 was calculated as
3.375×10⁻³ cm for montmorillonite sample. For the
present study, the pore diffusion coefficient values obtained from Eq. (12) were given in Table-2. The values of diffusion coefficient for adsorption of methylene blue were found to vary between 0.943x10⁻⁹ cm2 s-1 to 17.216x10⁻⁹ cm2 s-1. Diffusion
coefficient values are affected by many factors such as dye molecular weight, structure; functional groups have in the type and amount of adsorbent materials used electrokinetic surface properties.
Activation Energy
Adsorption rate constant temperature dependence can be given as follows [52, 53]:
2 0 1 ln ln a g E k k R T = − (13)
where k2 is the pseudo-second-order constant
(g mol−1 min−1), k
0 is the rate constant of adsorption
(g mol−1 min−1), E
a is activation energy of adsorption
(kJ mol−1), R
g is the gas constant (8.314 J mol−1 K−1), T is the solution temperature (K). Plotting of ln k2
against the reciprocal temperature gives a reasonably straight line, the gradient of which is −Ea/Rg. From
Eq, (13), the activation energy, Ea, was
45.597 kJ mol−1 (Fig. 9). The magnitude of activation
energy gave an idea about the type of adsorption which is mainly physical or chemical. Low activation energies (5–50 kJ mol−1) are characteristics for
physical adsorption, while higher activation energies (60–800 kJ mol−1) suggest chemical adsorption [54].
7.3 7.8 8.3 8.8 9.3 9.8 2.9 3.0 3.1 3.2 3.3 3.4
1/T (K
-1)x10
3ln k
2Fig. 9: Arrhenius plots for adsorption of dye on montmorillonite. (Conditions: initial MB 1.0×10⁻⁴ mol L-1, stirring speed 200 rpm,
ionic strength 0 mol L-1 NaCl, solution pH
5.95 (Natural)).
Parameters Adsorption mechanism
Mass transfer
coefficient Intra-particle diffusion model Bangham’s equation
Diffusion coefficient A dsor ben t do sa ge (g .L -1) T em pe ra tu r e (K) con ce n tr at i on (x 10 4 mo l pH Sti rri ng sp ee d (r p m ) Ion ic str eng th (m ol L -1) βL x104 R2 ki.1x106 R2 ki.2x107 R2 αB k0B R2 D (cm 2.s-1) x109 0.30 303 1.00 5.95 100 0 14.16 0.663 25.43 0.986 18.90 0.938 0.281 2.138 0.964 2.780 0.30 303 1.00 5.95 200 0 15.56 0.628 30.29 0.973 11.30 0.955 0.320 1.989 0.978 3.148 0.30 303 1.00 5.95 300 0 17.77 0.567 29.56 0.987 9.80 0.972 0.313 2.202 0.948 4.061 0.30 303 1.00 5.95 400 0 20.94 0.506 27.50 0.979 6.10 0.970 0.269 2.863 0.939 6.372 0.30 303 1.00 5.95 200 0 15.56 0.628 30.29 0.973 11.30 0.955 0.320 1.989 0.978 3.148 0.30 303 1.50 5.95 200 0 8.54 0.863 35.32 0.995 151.30 0.988 0.295 1.390 0.971 1.049 0.30 303 2.00 5.95 200 0 4.43 0.824 34.93 0.997 200.80 0.996 0.250 1.120 0.967 0.943 0.30 303 2.50 5.95 200 0 3.16 0.728 33.93 0.989 193.40 0.997 0.191 1.243 0.965 0.997 0.30 303 3.00 5.95 200 0 2.40 0.733 31.56 0.993 233.70 0.995 0.185 1.017 0.965 1.160 0.30 303 1.00 5.00 200 0 14.11 0.672 28.65 0.985 4.00 0.965 0.276 2.163 0.957 2.703 0.30 303 1.00 5.95 200 0 15.56 0.628 30.29 0.973 11.30 0.955 0.320 1.989 0.978 3.148 0.30 303 1.00 7.00 200 0 17.15 0.609 30.26 0.991 10.10 0.945 0.317 2.112 0.965 3.481 0.30 303 1.00 9.00 200 0 19.11 0.579 28.00 0.979 3.10 0.960 0.291 2.470 0.959 4.358 0.30 303 1.00 11.00 200 0 22.75 0.541 23.97 0.961 2.00 0.972 0.251 3.129 0.958 6.254 0.30 303 1.00 5.95 200 0 15.56 0.628 30.29 0.973 11.30 0.955 0.320 1.989 0.978 3.148 0.30 303 1.00 5.95 200 1 x10⁻³ 19.20 0.566 30.23 0.969 2.60 0.976 0.291 2.399 0.956 4.363 0.30 303 1.00 5.95 200 1 x10⁻² 20.33 0.530 27.25 0.947 3.10 0.946 0.266 2.837 0.949 5.753 0.30 303 1.00 5.95 200 1x10⁻¹ 22.94 0.499 26.20 0.957 5.10 0.979 0.270 2.983 0.935 6.785 0.30 303 1.00 5.95 200 0 15.56 0.628 30.29 0.973 11.30 0.955 0.320 1.989 0.978 3.148 0.30 313 1.00 5.95 200 0 20.02 0.477 28.12 0.968 2.00 0.976 0.260 2.916 0.935 6.862 0.30 323 1.00 5.95 200 0 21.95 0.416 41.39 0.989 3.00 0.986 0.242 3.318 0.906 9.824 0.30 333 1.00 5.95 200 0 23.84 0.338 50.91 0.991 2.00 0.986 0.194 4.212 0.857 17.216 0.10 303 1.00 5.95 200 0 1.72 0.594 42.08 0.991 122.20 0.956 0.230 0.743 0.983 1.620 0.20 303 1.00 5.95 200 0 8.94 0.670 31.56 0.990 124.90 0.981 0.350 1.260 0.976 1.759 0.30 303 1.00 5.95 200 0 15.56 0.628 30.29 0.973 11.30 0.955 0.320 1.989 0.978 3.148 0.40 303 1.00 5.95 200 0 81.02 0.492 20.62 0.971 4.10 0.953 0.264 6.956 0.935 6.513
Thermodynamic Parameters
Free energy (∆G*), enthalpy (∆H*) and
entropy (∆S*) of activation can be calculated by
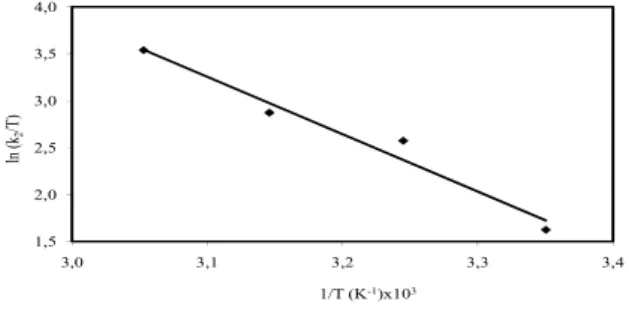
Eyring equation [55]: 2 * * 1 ln b g g k k S H T h R R T ∆ ∆ = + − (14)
where kb and h are Boltzmann’s and Planck’s
constants, respectively. According to Eq. (14), a plot of ln(k/T) versus 1/T should be a straight line with a slope ∆H*/R
g and intercept [ln(kb/h)+∆S*/Rg]. ∆H*
and ∆S* were calculated from slope and intercept of
line, respectively (Fig. 10). Gibbs energy of activation may be written in terms of entropy and enthalpy of activation:
* * . *
G H T S
∆ = ∆ − ∆ (15)
∆G* was calculated at 303 K from Eq. (15).
It was found that the values of the free energy (∆G*),
enthalpy (∆H*) and entropy (∆S*) of activation were
47.587 kJ mol−1, 42.884 kJ mol−1 and −0.0153
J mol−1 K−1, respectively. The free energy of
activation, ∆G* have also been computed at 303 K
(Table-3). 1,5 2,0 2,5 3,0 3,5 4,0 3,0 3,1 3,2 3,3 3,4 ln (k2 /T) 1/T (K-1)x103
Fig. 10: Plots of ln(k2/T ) versus 1/T for adsorption of
dye on montmorillonite(Conditions: initial MB 1.0×10⁻⁴ mol L-1, stirring speed 200
rpm, ionic strength 0 mol L-1 NaCl, solution
pH 5.95 (Natural)).
Table-3: Thermodynamic parameters of methylene blue adsorption onto montmorillonite
T (K) 303 313 323 333 ∆G* (kJ mol-1) 47.587 47.740 47.893 48.045 ∆H* (kJ mol-1) 42.958 ∆S* (kJ mol-1 K-1) -0.0153 Experimental Materials
The montmorillonite sample was obtained from Süd-Chemie Processing Plants (Balikesir,
Turkey). The chemical composition and physicochemical properties of the montmorillonite found in Turkey were given in Table-4 and Table-5. The montmorillonite sample was treated before using in the experiments as follows: the bulk containing 10 g L−1 montmorillonite was mechanically stirred for
24 h. after waiting for about two minutes the supernatant suspension was filtered through a what-man filter paper (Φ = 12.5 cm (diameter of filter paper)). The solid sample was dried at 110 ◦C for 24
h. and then sieved by 45-90-mesh sieve. The specific surface area of montmorillonite was measured by BET N2 adsorption.
Table-4: Chemical composition of montmorillonite
Component Weight (%) SiO2 49.40 Al2O3 19.70 MgO 0.27 CaO 1.50 Fe2O3 0.30 Na2O 1.50 H2O 25.67
Table-5: Physicochemical properties of montmo-rillonite.
Parameters Value Color White
Density (g/cm3) 2.3 – 3
Transparency Semi-transparent and opaque
Brightness Matt
Surface Area(m2/g) 95.36 m2/g
Reflective index 1 – 2
All reagents were of analytical grade chemicals. All solutions were prepared with double distilled water. The cationic dye used in this study. MB was purchased from Merck Co., Germany. MB has a molecular weight of 373.9 g mol-1 and its
chemical formula is C16H18ClN3S.3H2O [55]. The
structure of MB dye was illustrated in Fig. 11. MB concentration in the sample solution was determined using a spectrophotometer (UNICAM UV-visible spectrophotometer) at a wavelength of 663 nm [20]. Calibration curves were plotted between absorbance and concentration of the dye solution.
Fig. 11: The structure of methylene blue.
Methods
Kinetic studies were carried out to establish the effect of time on the adsorption process and to quantify the adsorption rate. The effects of agitation speed, initial MB concentration, adsorbent dosage, pH, temperature and ionic strength on the adsorption kinetics were investigated. For the experiments of
adsorption kinetics, 0.3-g-montmorillonite sample was added into a liter of methylene blue solution at desired concentration, temperature and pH. In systems, the dye concentration was 1.0×10⁻⁴ mol L−1,
except those in which the effect of concentration was investigated. Stock solutions of dye (Merck Co. Germany) were prepared in double-distilled water. The pH of the solution was adjusted with 1 mol L-1
NaOH or HCl solution by using an Orion 920 A pH-meter with a combined pH electrode.
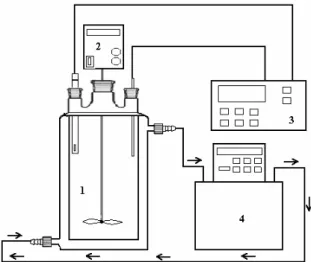
A preliminary experiment revealed that about 180 min times was required for the adsorption process to reach the equilibrium concentration. A Heidolph RZR 2021 mechanic stirrer at 303 K and 200 rpm for 180 min continuously agitated the mixture. A constant temperature bath was used to keep the temperature constant. Experimental set up was seen Fig. 12. Kinetic experiments were made by using 1000 ml of MB solutions of various concentrations, 5 ml samples were taken at different time intervals and remaining dye concentrations were analyzed. At the end of the adsorption period, the solution was centrifuged for 15 min at 5000 rpm. The samples at appropriate time intervals were taken from the reactor by the aid of the very thin point micropipette, which prevents the transition to solution of montmorillonite samples. Preliminary experiments had shown that the effect of the separation time on the amount of adsorbed dye was negligible. The amounts of dye adsorbed were calculated from the concentrations in solutions before and after adsorption. Each experimental point was an average of two independent adsorption tests [56].
Fig. 12: Experimental set up ( 1. Reactor, 2. Mech-anic stirrer, 3. pH-Temperature meter, 4. Circulator).
Following formula was used to determine adsorbed dye concentration qt:
(
0 t)
. t C C V q m − = (1)where qt (mol.g-1) is the adsorption capacity at time t, Co (mol L-1) is the initial dye concentration, Ct (mol
L-1) is the concentration of dye in solution at time t, V
(L) is the volume, and m (g) is the amount of the adsorbent.
Conclusions
We investigated the adsorption kinetics of MB dye on montmorillonite as a function of contact time, stirring speed, initial dye concentration, adsorbent dosage, ionic strength, pH and temperature; and found that;
1. The adsorption rate of dyes on montmorillonite increased with increase in initial dye concentration, ionic strength, stirring speed, pH and temperature;
2. The intra-particle diffusion was the rate-limiting step for the adsorption process;
3. The diffusion coefficient increased with increase in the stirring speed, ionic strength and temperature; and
4. The activation energy was very low and the process is governed by interactions of physical nature. Montmorillonite can be used for the removal of cationic dyes from aqueous solutions.
Acknowledgements
The authors thank the Balikesir University Research Center of Applied Science (BURCAS).
Nomenclature C0 Ct D Ea H K kb k0 k1 k2 k0B kdif m pHiep
Initial dye concentration in aqueous solution, mol L-1
Dye concentration in solution at time t, mol L-1
Diffusion coefficient, cm2 s-1
Activation energy, kJ mol-1
Planck’s constant Adsorption constant, L g-1
Boltzmann’s constant Arrhenius factor, g mol-1 min-1
Adsorption rate constant for pseudo- first-order kinetic equation, min-1
Adsorption rate constant for pseudo-second- order kinetic equation, g mol-1 min-1
Bang ham’s equation constants, ml g-1 L
Intra-particle diffusion rate constant, mol min-1/2 g-1
Mass of adsorbent, g L-1
Isoelectric point
qe Equilibrium dye concentration on adsorbent, mol g-1
qt The amount of dye adsorbed per unit mass of the
r0 The radius of the adsorbent particle, cm
R2 Linear regression coefficient
Rg Gas constant, J K-1 mol-1
SS The surface area of adsorbent, m2 g-1
t Time, min T Temperature, K
t1/2 The half-adsorption time of dye, min
V Solution volume, L
α Initial adsorption rate in The Elovich equation, mol g-1 min-1
β Desorption constant in The Elovich equation, g mol-1
αB Bang ham’s equation constants, (less than 1)
βL Mass transfer coefficient, m s-1
∆G* Free energy of activation, kJ mol-1
∆H* Enthalpy of activation, kJ mol-1
∆S* Entropy of activation, kJ mol-1 K-1
References
1. G. Crini, Bioresource Technology, 97, 1061 (2006).
2. F.-C. Wu and R.-L. Tseng, Journal of Hazardous
Materials, 152, 1256 (2008).
3. M. N. V. R. Kumar, T. R. Sridhari, K. D. Bhavani. and P. K. Dutta, Colorage, 40, 25 (1998).
4. K. R. Ramakrishna and T. Viraraghavan, Water
Science and Technology, 36, 189 (1997).
5. A. Bozdogan and H. Goknil, Journal of Natural
Sciences Institute of Marmara University, 4, p.
83 (1998).
6. K. Majewska-Nowak, T. Winnicki. and J. Wisniewski, Desalination, 71, 127 (1989). 7. O. R. Shendrik, Kimiyi Technology Vody, 11,
467 (1989).
8. Z. Ding, C. W. Min. and W. Q. Hui, Water
Science and Technology, 19, 39 (1987).
9. P. Cooper, Alden Press Oxford, 9 (1995). 10. S. Wang and H. Li, Dyes and Pigments, 72, 308
(2007).
11. G. Crini, Dyes and Pigments, 77, 415 (2008). 12. M. Dogan, Y. Ozdemir. and M. Alkan, Dyes and
Pigments, 75, 701 (2007).
13. S. Wang, Y. Boyjoo, A. Choueib. and Z. H. Zhu,
Water Research, 39, 129 (2005).
14. J. J. M. Órfao, A. I. M. Silva, J. C. V. Pereira, S. A. Barata, I. M. Fonseca, P. C. C. Faria. and M. F. R. Pereira, Journal of Colloid and Interface
Science, 296, 480 (2006).
15. A. A. Attia, W. E. Rashwan. and S. A. Khedr,
Dyes and Pigments, 69, 128 (2006).
16. F. Derbyshire, M. Jagtoyen, R. Andrews, A. Rao, I. Martin-Gullon. and E. Grulke, Chemistry
and Physics of Carbon, Marcel Dekker, New York, 27, 1 (2001).
17. F.-C. Wu, R.-L. Tseng. and R.-S. Juang, Journal
of Hazardous Materials, 69, 287 (1999).
18. R. Dolphen, N. Sakkayawong, P. Thiravetyan. and W. Nakbanpote, Journal of Hazardous
Materials, 145, 250 (2007).
19. G. Annadurai, L. Y. Ling. and J. F. Lee, Journal
of Hazardous Materials, 152, 337 (2008).
20. M. Dogan, M. Alkan, A. Turkyilmaz. and Y. Ozdemir, Journal of Hazardous Materials, 109, 141 (2004).
21. P. Liu and L. Zhang, Separation and Purification
Technology, 58, 32 (2007).
22. T. B. Iyim and G. Guclu, Desalination, 249, 1377 (2009).
23. G. McKay, M. El Geundi. and M. M. Nassar,
Process Safety and Environmental Protection, 74, 277 (1996).
24. J. X. Lin, S. L. Zhan, M. H. Fang, X. Q. Qian. and H. Yang, Journal of Environmental
Management, 87, 193 (2008).
25. N. Dizge, C. Aydiner, E. Demirbas, M. Kobya and S. Kara, Journal of Hazardous Materials,
150, 737 (2008).
26. S. Jain and R. V. Jayaram, Desalination, 250, 921 (2010).
27. A. L. Ahmad, M. M. Loh and J. A. Aziz, Dyes
and Pigments, 75, 263 (2007).
28. Y. Guo, S. Yang, W. Fu, J. Qi, R. Li, Z. Wang and H. Xu, Dyes and Pigments, 56, 219 (2003). 29. V. K. C. Lee, J. F. Porter and G. McKay, Food
and Bioproducts Processing, 79, 21 (2001).
30. Q. Sun and L. Yang, Water Research, 37, 1535 (2003).
31. V. V. Basava Rao and S. Ram Mohan Rao,
Chemical Engineering Journal, 116, 77 (2006).
32. J. German-Heins and M. Flury, Geoderma, 97, 87 (2000).
33. G. Crini, H. N. Peindy, F. Gimbert and C. Robert, Separation and Purification Technology,
53, 97 (2007).
34. S. Karaca, A. Gurses, M. Acıkyıldız and M. Ejder, Microporous and Mesoporous Materials,
115, 376 (2008).
35. T. Robinson, B. Chandran and P. Nigam,
Environment International, 28, 29 (2002).
36. Z. Al-Qodah, Water Research, 34, 4295 (2000). 37. S. H. Chien and W. R. Clayton, Soil Science
Society of America Journal, 44, 265 (1980).
38. S. Lagergren and B. K. Svenska, Kungliga
Svenska Vetenskapsakademiens Handlingar, 24,
1 (1898).
39. Y. S. Ho and G. McKay, Water Research, 34, 735 (2000).
40. Y. S. Ho and G. McKay, The Canadian Journal
of Chemical Engineering, 76, 822 (1998).
41. Y. S. Ho and G. McKay, Trans Institution of
Chemical Engineers, 76B, 332 (1998).
42. A. Gurses, C. Dogar, M. Yalcın, M. Acıkyıldız, R. Bayrak and S. Karaca, Journal of Hazardous
43. A. Al-Futaisi, A. Jamrah and R. Al-Hanai,
Desalination, 214, 327 (2007).
44. A. R. Tehrani-Bagha, H. Nikkar, N. M. Mahmoodi, M. Markazi and F. M. Menger,
Desalination, 266, 274 (2011).
45. W. J. Weber and J. C. Morris, Journal Sanitary
Engineering Division Proceedings American Society of Civil Engineers, 89, 31 (1963).
46. T. Furusawa and J. M. Smith, Industrial and
Engineering Chemistry Fundamental, 12, 197
(1973).
47. C. Aharoni, S. Sideman and E. Hoffer, Journal
of Chemical Technology and Biotechnology, 29,
404 (1979).
48. O. Abdelwahab, Egyptian Journal of Aquatic
Research, 33, 125 (2007).
49. T. Furusawa and J. M. Smith, AIChE Journal,
20, 88 (1974).
50. Y. S. Ho and G. McKay, Chemical Engineering
Journal, 70, 115 (1998).
51. K. P. Yadava, B. S. Tyagi, K. K. Panday and V. N. Singh, Environmental Technology Letters, 8, 225 (1987).
52. M. Al-Ghouti, M. A. M. Khraisheh, M. N. M. Ahmad and S. Allen, Journal of Colloid and
Interface Science, 287, 6 (2005).
53. K. Laidler and J. H. Meiser, Houghton Mifflin
New York, p. 852 (1999).
54. H. Nollet, M. Roels, P. Lutgen, P. Van der Meeren and W. Verstraete, Chemosphere, 53, 655 (2003).
55. A. Rodríguez, J. García, G. Ovejero and M. Mestanza, Journal of Hazardous Materials, 172, 1311 (2009).
56. X.-Y. Yang and B. Al-Duri, Chemical