Journal of Radioanalytical and Nuclear Chemistry, Articles, Vol. 123, No. 1 (1988) 3 - 1 0
E F F I C I E N C Y C A L I B R A T I O N A N D S U M M A T I O N E F F E C T S I N G A M M A - R A Y S P E C T R O M E T R Y
H. N. ERTEN,* ~. AKSOYO~LU** H. GOKTORK**
*Chemistry Department, Bilkent University, Bilkent, Ankara (Turkey) **Chemistry Department, Middle East Technical University, Ankara (Turkey)
(Received September 16, 1987)
Precise, absolute "r-ray efficiences (e?) and total efficiences (el') , have been measured at various distances from the detector, using a set of standards. The observed linear variation of e 3, and eT as well as e3,/e T with E.y and 1/x/dprovides a simple means of interpolation and extrapolation. Experimental coincidence summation effects were determined for various nuclides and compared with calculated values. The results a~e found to be in good agreement with each other.
Introduction
The accuracy o f many gamma-spectrometric measurements is not as high as it should be. Some o f the likely sources of errors include geometry effects, dead-time effects and coincidence summing effects. T h e errors can be minimized if the samples and the standards are o f the same size, shape, material and density. They should be placed at the same positions relative to the detector. If a radionuclide being measured has a decay scheme involving cascading transitions the areas o f the individual "y-lines can be seriously distorted because o f true coincidence summing effects. Furthermore, these summation effects become increasingly significant as one places the samples closer to the detector. Random coincidence summing becomes important only at relatively high activities and does n o t depend on the decay scheme. Previous work on efficiency calibration and summation effects in 7-ray spectrometry are given in References 1 - 9 . To illustrate the calculation of.true coincidence summing, let us consider a species with a decay scheme similar to that shown in Fig. 1. The p'hoto- peak 71 will contain too many counts because o f photopeak-photopeak coincidences of 72 and 73. The photopeaks 3'2 and 73 will both contain too few counts because o f coincidences between the two. Neglecting angular correlations, these effects are given quantitatively by the following equations
f 2 " ~ 2 " f 3 " e 7 3
FEt = fl " eT1 ' (1)
FL~ = f3 "er 3, (2)
FL3 = f2 9 eT2 (3)
where FEt - fractional excess of photopeak "it, FLt - fractional loss o f photopeak 7 t ,
eyt - absolute photopeak efficiency of photopeak 71, ey~ - absolute total efficiency o f p h o t o p e a k ~/t,
fl - fractional emission factors of unconverted ~/t photons.
For an arbitrarily complex decay scheme general forms of the equations given above may be derived considering direct and indirect cascades. Various publications* - 7 may be consulted for such calculations.
As is seen in the equations given above, summation effect calculations involve both photopeak efficiency eT, as well as tottal efficiency e T values. In this work ex-
Y2
Y3
A I
Y2 A u
Fig. I. Energy levels and gamma-ray photopeaks considered in summation effect calculations perimental ey and eT, values were determined at various distances from the detector. Simple ways of interpolation and extrapolation a r e suggested. Experimental coinci- dence summation effects were determined for some nuclides and compared with calculated values.
Experimental
The detector employed in the measurements was a coaxial cylindrical Ge(Li) detector with an active volume of 35 cm 3. It was used in conjunction with a 4096- channel analyzer. The energy resolution of the 1332 keV peak of 6~ was 2.5 keV.
H. N. ERTEN et al.: EFFICIENCY CALIBRATION AND SUMMATION EFFECTS Table 1
Standard nuclides used in the studies
Standard Half-life Gamma-energy, keY Absolute intensity Reference
241Am 458 y STCo 271.6 d la3Ba 10.7 y 137Cs 30 y S4Mn 312.5 d ~2Na 2.6 y 6~ 5.263 y " Y 107 d 'S2Eu 13 y 'S2Ta 115 d 59.5 35.3 I0 122.1 85.5 11 136.4 276.3 7.1 12 302.7 18.3 355.8 62.3 383.7 8.9 661.6 85.0 II 834.8 99.98 II 1274.5 99.97 ll 1173.2 99.87 11 1332.5 99.98 898.0 94.6. 8 1836 99.47 40 46.0 I0 45.4 9.0 244.7 7.2 344.2 31.4 411.0 2.5 443.0 3.3 778.0 15.2 867.4 5.1 964.0 17.3 I085.0 I0.0 1112.0 16.4 1407.9 24.3 67.7 51.0 I0 100.1 11.9 222.0 7.98 1121.2 37.0 1221.3 28.9
Efficiency measurements were made using a set of radioactive standards given in Table 1. All of the standards used were p o i n t sources with a diameter of about 0.1 m m . The sources were counted at various source-to-detector distances ranging from 0.65 to 34.3 cm. In all measurements dead time corrections were below 10%. For total efficiency measurements single line standard sources are needed. The single- line sources 241Am, S4Mn, 137Cs as well as the double-line sources s 7Co ' 6OCo and
energy of 129 keV; 6~ as emitting two 7-rays of a mean energy of 1253 keV per decay. In the case of Say, which has two 7-lines at 898 keV and at 1836 keV the contribution of the 898 keV line can be subtracted from the total count rate in order to get the total efficiency for the 1836 keV 7-ray.
Experimental summing effects were determined for the nuclides 6 o Co, a 8 y , 134 Te and 1 s 2Eu by counting them at close and at far distances from the detector. In the case of 134 Te, it was produced i n reactor irradiation, chemically sepfirated and divided into two halves. To one o f the sources, ~ 37 Cs reference was added. This source was counted at various distances from the detector. The second half of the source was counted simultaneously with the. first at a fixed position of 12 cm from a second detector. The latter measurements were used to correct for the decay of ~ 34 Te (41.8 m) during the measurements. From the areas of various 7-lines, after correction for differences in distances using the reference ~ 37Cs ' experimental summing effects were determined. cy 10 -I
i.
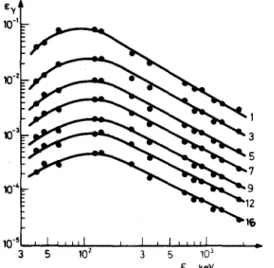
10" 3 5 10 2 3 5 lO ~ E ~ keyFig. 2. Gamma-ray efficiency ,e~, variation as a function of gamma-ray energy, E~/. The numbers represent various positions from the detector:
Position Distance f r o m detector, cm
1 0.65 3 3.25 5 6.30 7 10.1 9 15.7 12 22.0 16 34.3 6
H. N. ERTEN et al.: EFFICIENCY CALIBRATION AND SUMMATION EFFECTS
Results and discusion
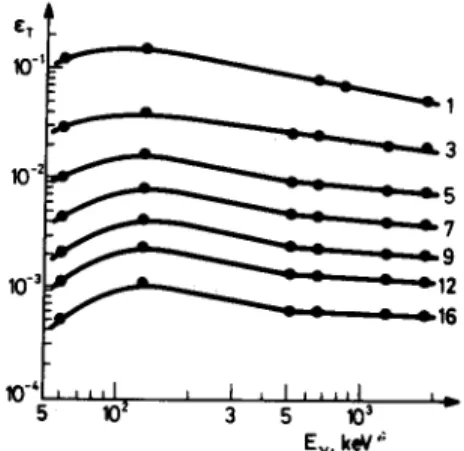
The results of efficiency measurements are given in Figs 2 and 3. Figure 2 shows the variation of the photopeak efficiency e~ and Fig. 3 shows the total efficiency
e T variation, at seven different distances from the detector. It is seen that above about 100 keV the variation of both e7 and e T as a function of energy is approxi- mately linear at all distances when plotted on a log-log scale.
~-~ ~ 1 2
~ 1 6
5 10 2 3 5 10 3 E,~, keV '~
Fig. 3. Total efficiency e T variation as a function of gamma-rw energy E~. The numbers represent various positions from the detector. The corresponding distances (in cm) are as given in the caption of Fig. 2
Figure 4 shows the variation of e~ and e~ r values as a function of distance from the detector for various energy 7-rays. Except for positions very near the detector, e7 and e T change linearly with 1/x/~, where d is the distance from the detector. Furthermore, it was observed that the ratio e~//~ T changes smoothly and approxi- mately linearly with E~ as shown in Fig. 5. On the other hand, % / e T did not vary much with distance from the detector for a particular E~ energy. Each point shown in Fig. 5 represents the average of values measured at sixteen different distances from the detector. The errors given are the standard deviations of these average values.
Often in 7-ray spectroscopy one measures several 7-lines at various distances from the detector. These measurements necessitate the knowledge of e.~ and e T values. A simple and reliable method of interpolation and/or extrapolation of such efficiency values will be of outmost importance. The linear variation of % and e~ r as well as e ~ / e T with E~ and 1/x/'d as pointed above provides such a simple means of estima-
u >" 10-2
C
I..U
10 .3
10 -4.Ey:
661~
/
J
i
4- #H
l
/
2.10 "s , , , / , , [ ~ l ~,. [ L L I ~ i j , , . 10 -~ 0.5 I 0 S 1 I / i / " ~ , c m -I/2 11"Jd, c m "I/2 E y = 1 8 3 6 . 0/
,i
J
+ §,i
+ t 05 1Fig. 4. Variation o f e~/and e T values as a function of distance from the detector for various energy 7-rays. Points represent e T and crosses e 7 values
t
3 10 z 3 10 3
E y , keV
Eig. 5. Variation of e T / e T ratio with ~-ray energy. Each point represents average eT/e T values for sixteen different positions from the detector. The errors shown are the standard devia- tions o f the average values
H. N. ERTEN et al.: EFFICIENCY CALIBRATION AND SUMMATION EFFECTS 1.3s "6 13C c 1.2~ .o E E f.lfl 1.12 1.06 tO( 1 l a i i I I i 2 4 6 8 d,cm
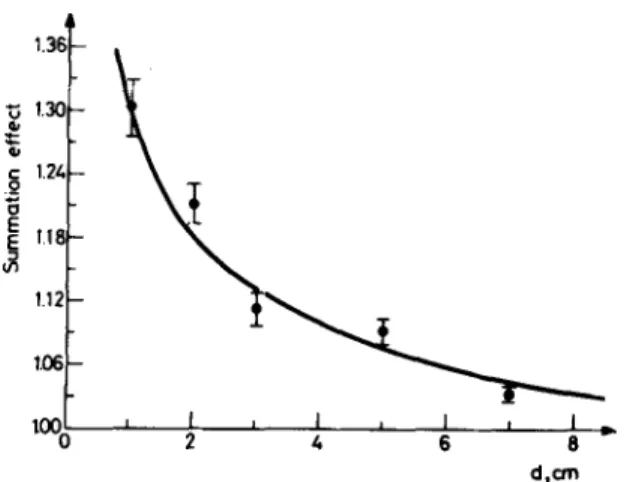
Fig. 6. Results of summation effect studies in t 34Te as illustrated for the 211 keV y-ray. The curve represents calculated values and the points are experimentally determined values. The ordinate gives the summation correction factors
Table 2
Experimental and calculated summation effects for some nuclides
Nuclide Gamma-energy, Distance to
keV detector, cm
Summation correction factor
Experimental Calculated 60Co 1173.2 1.2 1.057 1.067 s. y 1836.0 1.2 1.027 1.056 t s 2 E u 121.8 1.2 1.079 1.086 244.7 1.2 1.121 1.157 344.3 1.2 1.045 1.058 411.0 1.2 1.134 1.163 443.0 1.2 1.094 1.135 778.9 1.2 1.105 1.116 867.4 1.2 1.182 1.232 964.0 1.2 1.072 1.096 1085.0 1.2 1.019 1.984 1112.0 1.2 1.060 1.08.4 ] 3 4 T e 211.0 1.0 1.33 1.29 211.0 2.0 1.23 1.18 211.0 3.0 1.11 1.13 211.0 5.0 1.09 1.08 211.0 7.0 1.03 1.04
The results o f summation effect measurements are given in Table 2. The experi- mental values ,are seen to be in good agreement with the calculated values using Eqs ( 1 ) - ( 3 ) .
The results of 1 a 4 Te measurements are illustrated in Fig. 6 for 211 l~eV "r-rays. The curve represents calculated s u m m a t i o n effects and the points are experimentally determined values.
The 13, Te measurements were made at the Institute of Nuclear Chemistry, Mainz University, Federal Republic of Germany. One of us (HNE) thanks Prof. H; O. DENSCHLAG for Iris kind hospitality and the Alexander yon Humboldt-Stfftung for a fellowship.
References
1. G. AUBIN, J. BARRETTE, M. BARRETTE, S. MONARO, Nucl. Instr. Methods, 76 (1969) 93.
2. R. GRIFFITHS, Nucl. Instr. Methods, 91 (1971) 377.
3. L. A. McNELLES, J. L. CAMPBELL, Nucl. Instr. Methods, 109 (1973) 241. 4. G. J. McCALLUM, G, E. COOTE, Nucl. Instr. Methods, 130 (19"/5) 189.
5. D. S. ANDREEV, K. I. EROKHINA, V. S. ZVONOV, I. KI~ LEMBERG, Izv. Akad. Nauk. SSR, Set. Fiz., 37 (1975) 1609.
6. K. DEBERTIN, U. SCHOTZIG, NucL Instr. Methods, 140 (1973) 337.
7. R. J. GEHRKE, R, O. HELMER, R. C: GREENWOOD, NucL Instr. Methods, 147 (1977) 405. 8. K. DEBERTIN, U. SCHOTZIG, Kerntechnik. 19 (1977) 420.
9. K. DEBERTIN, Nucl. Instr. Methods, 158 (1979) 479.
10. G. ERDTMANN, W. SOYKA, The Gamma-Lin'es of Radionucfides, KFA, Jiil-100 3-AC, 1974. 11. Calibration References of the "Laboratory for Measurement of Ionizing Radiation" C. E. N.
Sacley, France.
12. V. SHOTZIG, K. DEBERTIN, J. AppL Radiation Isotopes, 28 (1977) 503.


![Synthesis of new N,N′-bis [1-aryl-3-(piperidine-1-yl)propylidene] hydrazine dihydrochlorides and evaluation of their cytotoxicity against human hepatoma and breast cancer cells](data:image/gif;base64,R0lGODlhAQABAIAAAP///wAAACH5BAEAAAAALAAAAAABAAEAAAICRAEAOw==)