Tar. Bil. Der. Dergi web sayfası:
www.agri.ankara.edu.tr/dergi www.agri.ankara.edu.tr/journalJournal homepage:
Analyzing Variation of Sediment Yields in Wet and Drought Years
İrfan OĞUZa
a
Gaziosmanpasa University, Faculty of Agriculture, Department of Soil Science and Plant Nutrition, Tokat, TURKEY ARTICLE INFO
Research Article — Natural Resources Management and Landscape Planning
Corresponding Author: İrfan OĞUZ, e-mail: [email protected], Tel: +90(356) 252 16 16 Received: 19 August 2011, Received in revised form: 24 February 2012, Accepted: 10 December 2012
ABSTRACT
This study presents meteorological and hydrologic drought effects on sediment yield in a small rural basin, Uğrak Watershed in Tokat Region of North Central Anatolia, Turkey. Sediment yield was estimated by using Modified Universal Soil Loss Equation (MUSLE) model for 25 years period. The maximum and minimum sediment yields were estimated in 1980 and 1997 respectively. Historical precipitation and flow data were analyzed to determine meteorological and hydrological drought by Standardized Precipitation Index (SPI) method. Results showed that there was 10-year drought vs. 15-year wet for meteorological and 14-year drought vs. 11-year wet for hydrological conditions. In the meteorologically drought and wet years, the sediment yields were estimated as 6920.7 tons and 18068.2 tons, respectively. In the hydrological dry and wet years, the sediment yields were estimated as 7417.8 tons and 21489.2 tons, respectively. Sediment yields were found similar in meteorological and hydrological wet and also similar in meteorological and hydrological dry conditions. Drought reduced the sediment yield in the study area. Keywords: MUSLE; GIS; Drought; Sediment yield; Watershed
Yağışlı ve Kurak Yıllarda Sediment Veriminin Değişim Analizi
ESER BİLGİSİAraştırma Makalesi—Doğal Kaynak Yönetimi ve Peyzaj Planlama
Sorumlu Yazar: İrfan OĞUZ, e-posta: [email protected], Tel: +90(356) 252 16 16 Geliş Tarihi: 19 Ağustos 2011, Düzeltmelerin gelişi: 24 Şubat 2012, Kabul: 10 Aralık 2012
ÖZET
Bu çalışma meteorolojik ve hidrolojik kuraklığın küçük bir kırsal havzada, Kuzey Orta Anadolu Bölgesi Tokat İli Uğrak Havzası, sediment verimi üzerine etkilerini incelemek amacıyla yürütülmüştür. Sediment verimi Modifiye Üniversal Toprak Kaybı Eşitliği (MUSLE) denklemi kullanılarak 25 yıllık bir dönem için tahmin edilmiştir. En fazla ve en az sediment verimi sırasıyla 1980 ve 1997 yıllarında hesaplanmıştır. Meteorolojik ve hidrolojik kuraklık, tarihsel yağış ve akış verileri kullanılarak Standardize Edilmiş Yağış İndeksi (SPI) ile tespit edilmiştir. Çalışma süresinin 10 yılı meteorolojik olarak kurak ve 15 yılı yağışlı geçerken, hidrolojik olarak 14 yılı kurak, 11 yılı yağışlı geçmiştir. Meteorolojik olarak kurak ve yağışlı yıllarda sediment verimi sırasıyla 6920.7 ton ve 18068.2 ton olarak hesaplanmıştır. Hidrolojik olarak kurak ve yağışlı yıllarda sediment verimi sırasıyla 7417.8 ton ve 21489.2 ton olarak hesaplanmıştır. Hesaplanan sediment verimi, meteorolojik ve hidrolojik yağışlı ve aynı zamanda meteorolojik ve hidrolojik kurak şartlar altında benzer bulunmuştur. Kuraklık, çalışma alanındaki sediment verimini düşürmüştür.
Anahtar Kelimeler: MUSLE; CBS; Kuraklık; Sediment verimi; Havza
© Ankara Üniversitesi Ziraat Fakültesi
TA RI M B İL İM LER İ DE RG İS İ
J
O
UR
N
A
L
O
F
A
G
RI
CU
LT
U
R
A
L
SC
IE
N
CE
S
18 (201 2) 146 -1561. Introduction
Drought and wet conditions may affect the sediment amount. The suspended sediment loads in a stream are the results of erosion and transportation process. Sediment yield might increase or decrease during drought seasons. Drought influences erosion primarily through changes in the amount and intensity of rainfall, which associated with reduction of cover vegetation (Schumm 1977). These two factors describe the erosion response to drought. The reduction of rainfall during dry season reduces the erosion; moreover it reduces cover vegetation and the landscape becomes more vulnerable to erosion.
In order to understand which is the most controlling factor on sedimentation in drought condition, several studies has been conducted. Giakoumakis & Tsakiris (1997) used continuous simulation model with the reconnaissance estimation of sediment yield from a hydrological basin to describe drought effect on sediment yield. In their study, sediment yield estimations were found higher during the wet period following a drought period. Pruski & Nearing (2002) used WEPP model to find a relation between changes of precipitation and their significant implications on runoff, soil erosion, and conservation planning. In this study, erosion increased approximately 1.7% for each 1% change in annual rainfall. Rainfall amounts and intensities were found as the most direct and important factor on changes of erosion under various climate. Nearing et al (2005) investigated the response of seven soil erosion models using a few basic precipitation and vegetation data under humid and semiarid watersheds. They indicated that soil erosion is likely to be more affected by rainfall and cover vegetation than runoff, though both are likely impacted in similar ways. Nunes et al (2008) conducted a research to estimate the effect of climate change on water resources, vegetation productivity and erosion. This was done by analyzing the sensitivity of these variables to varying degrees of temperature change, rainfall (reduced by up to 40%) and atmospheric CO2 concentrations. The SWAT
watershed model was applied to 18 large watersheds in two contrasting regions of Portugal (humid and semi-arid regions); incremental changes to climate variables were simulated using a stochastic weather generator. The main results indicated that, water runoff is highly sensitive to the trend of climate change. For the milder rainfall changes, soil erosion showed a significant increasing trend in the wheat fields (up to 150% in the humid watersheds). The common agreement of these studies is that the rainfall factor dominates and erosion tends to decrease with decreasing annual rainfall. This suggests that drought is associated with periods of low sediment yield. But the effects of drought on vegetation
and sedimentation are nonlinear. The results of numerous plot studies indicated that vegetative cover is the dominant factor controlling erosion, particularly during drought conditions (Dadkah & Gifford 1980; Wood et al 1987; Blackburn et al 1992; Gutierrez & Hernandez 1996). These studies indicate that the loss of cover vegetation leaves soils so vulnerable to erosion that even with decreases rainfall erosivity during drought seasons, erosion rates increase dramatically. However, it is not clear that drought effect on sediment yield at watershed scale due to watershed complexity.
Dodangeh at al (2011) conducted a research to consider for hydrological drought analysis at 26 selected stations out of 41 stream flow gauging stations located at the north of Iran. The study area was found heterogeneous and therefore Fuzzy Cluster Analysis (FCA) algorithm was applied to divide being homogenous subregions. Two regions were identified as the result of FCA analysis and the L-Moment analysis. One region was found homogenous and the Generalized Logistic (GLO) distribution was selected for this region. A study related to hydrological drought by using SPI were conducted in the southern Cordoba Province in Argentina to analyze the potential of the SPI as a tool for monitoring flood risk. This study indicated that the SPI satisfactorily explains the development of conditions leading up to the three main flood events to occur in the region during the past 25 years (Seiler et al 2002). The numerous studies in Turkey were used to describe drought with the help of SPI method (Yurekli & Kurunc 2006; Yurekli & Anlı 2008; Anlı et al 2009; Yurekli et al 2009; Yurekli et al 2010; Yurekli et al 2010; Yurekli et al 2012).
Information on the sediment yield at the outlet of a river basin is providing a useful perspective to predict the rates of erosion and soil loss in the watershed upstream. In many countries, such measurements were conducted in some research basins. These research activities needs time and costs. Some empirical equation or models produced from these studies, and these models give some advantages as time and costs. The empirical models are widely used for computing the amount of potential soil erosion and sediment yield. Empirical models such as USLE (Universal Soil Loss Equation), MUSLE (Modified Universal Soil Loss Equation) and RUSLE (Revised Universal Soil Loss Equation) provide useful information to predict sediment amount from outlet. Many researchers have conducted some research to evaluate the MUSLE under different conditions for different purposes around the world (Asokan 1981; Nicks et al 1994; Banasik & Walling 1996; Kinnel 2001; Erskine et al 2002; Sadeghi 2004; Cambazoglu & Gogus 2004; Mishra et al 2006; Sadeghi et al 2007; Pandey et al 2009).
Oğuz et al (2011) stated that the K value which is one of MUSLE equation factors is greatly influenced by land slope. In their study, to describe desertification potential in a rural watershed they compared some soil properties in two slope groups (mild to moderate and moderate to steep) with the help of coefficient of variation and fractal dimension of spatial variation. In the study, they found higher fractal coefficients in steep slopes than mild slope and high fractal coefficients values expected to be short-range variation. Generally higher CV values and lower D values occurred in moderate to steep slopes, indicating greater desertification potential.
Yurekli & Ozturk (2000) calculated erosion index of Uğrak watershed according to total kinetic energy from 1978 to 1998 years. Yearly erosive index values of the watershed varied between 0.40 and 24.16 MJ.cm/ha.h.
Uğrak watershed is a research basin and rainfall and runoff characteristics were investigated for 25 years period. The storm runoff volume and peak runoff parameters are required for MUSLE models and the mentioned parameters were directly obtained from research findings of the watershed.
In the present study, we investigated the effect of drought on sediment yield in a small agricultural watershed. The objective of this study is to compare the sediment yields in meteorological drought and hydrological drought conditions. This was done by history of meteorological and hydrological data and estimated sediment data by MUSLE.
2. Material and Methods
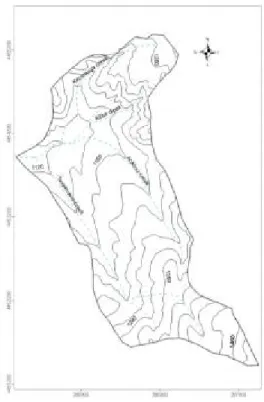
The present study took place at the Uğrak watershed in Tokat region of North Central Anatolia. The geographical area of the watershed is approximately 700 ha with an elevation ranging from 1292.5 to 1485.0 m above mean sea level (Figure 1). Some of the other geometric characteristics of the catchment area are as listed in Table 1. The average rainfall is 483.6 mm and minimum and maximum temperature is varying from – 3.3 to 17.8˚C. The overall climate of the area is semi-arid. The soils, Entisols and Inceptisols are moderate to well-drained. The watershed contains mild to moderate steep areas with low vegetation densities and/or under cultivation. The areas with <12% slopes are mainly cultivated. The major vegetation type in fallow areas is grassland with Graminea and Fabaceae as dominant species, other types being shrubs and meadows. The cultivated areas are relatively large, covering 76.6% of the catchment and the wheat – fallow rotation is common. Some woodland, mostly shrubs with a few trees, covering approximately 6.2% of the catchment, are scattered about. The natural
grassland mostly degraded due to heavy grazing, covers 17.2% of the area. Daily rainfall and runoff data of the watershed were collected from the three automatic rain-gauge stations and stream flow gauging station located at the outlet of the study watershed bridge between from 1978 and 2002.
Figure 1- General feature and topographical map of Ugrak watershed
Şekil 1-Uğrak havzasının genel özellik ve topografik haritası
Table 1- Some of the geometric characteristics of the Ugrak watershed
Çizelge 1- Uğrak havzası bazı şekil karakteristikleri
Area, ha 700.0
Mean elevation, m 1292.5
The most top point elevation, m 1485.0 Outlet elevation above sea level, m 1100.0
Catchment perimeter, km 14.0
Average slope, % 20.6
Average slope of main river, % 4.7 Total length of the river, km 18.2 Length of the main river, km 6.7 2.1. Sediment Yield Prediction (MUSLE)
The MUSLE was developed from USLE by replacing the rainfall energy factor (R factor) with a runoff energy factor. The equation was developed using
individual storm data from 18 basins in Texas and Nebraska and subsequently validated on 102 basins throughout the United States using runoff data generated by the hydrologic component of the SWRRB (Simulator for Water Resources in Rural Basins) model (Williams 1982). The MUSLE increases sediment yield prediction accuracy, eliminates the need for sediment delivery ratios, and is applicable to individual storms. MUSLE is expressed by Williams & Berndt (1977) as: = 11.8( ) . S (1)
Where Y is the sediment yield from an individual storm in metric tons, Q is the storm runoff volume in m3, qp is the peak runoff rate in m3s-1, and K is soil erodibility factor (t.h.t-1m-1), LS is topographic factor (dimensionless), C is crop factors (dimensionless) and finally P is erosion control practice factor (dimensionless) similar to the USLE model (Williams & Berndt 1977). MUSLE is used to predict sediment yield on a single storm basis, but it can also be used to predict sediment yield on annual basis with Equation 2 (Simons & Senturk 1992; Cambazoglu & Gogus 2004). = ( . . . . . ) . . . . . (2)
Where As is the annual sediment yield, and Qa is the average annual water yield, and Ys and Qv are single storm event sediment yield and water yield with corresponding return periods, respectively.
Soil erodibility factor was estimated using the Equation 3 given by Foster et al (1991).
100 = 2.1 . 10 (12 − ) + 3.25( − 2) + 2.5( − 3) (3) Where M [(silt + very fine sand)(100 - clay)] is particle size parameter, a is percent organic matter, b is soil structure code and c is soil permeability class.
The slope length factor (L) was calculated with the help of Equation 4 (Mc Cool et al 1987).
= ( /22.1) (4) Where L is slope length factor, which is field slope length (m), m is a coefficient that depends on slope steepness, being 0.5 for slopes exceeding 5%, 0.4 for 4% slopes and 0.3 for slopes less than 3%. The percent slope was determined from DEM with the help of Equation 5.
= 10.8 + 0.03 s < 9%, S = 16.8 − 0.05 s ≥ 9% (5)
Where s is slope steepness factor and θ is slope angle in degree.
The cover and management factor (C factor) represents a combined effect of interrelated cover and management variables. C values derived from local research findings for each land use. The support practice factor (P factor) represents a combined effect of support practices and management variables. They are also known as structural methods for controlling
erosion. In an area, if conservation practices are not followed P value should assign as 1.
2.2. The Method of L-Moments
To obtain the sediment and water yield with corresponding return periods in the watershed, we used the distributions of Normal, 2-parameter Log-Normal, Extreme Value Type I, Generalized Logistic, Generalized Pareto, Generalized Extreme Value, 3-parameter Log Normal. The 3-parameter estimation of the distributions taken into account in the study was obtained from L-moment approach as defined by Hosking and Wallis (1997). L-moments are linear combinations of probability weighted moments (PWM). Greenwood et al (1979) summarizes the theory of PWM and defined as;
= { [ ( )] } (6) Where
β
ris the rth order PWM and Fx(X) is thecumulative distribution function (cdf) of Hosking & Wallis (1997) defined unbiased sample estimators of PWMs as (bi) and, obtained unbiased sample estimators
of the first four L-moments by PWM sample estimators. Unbiased sample estimates of the PWM for any distribution can be computed from;
= ∑ [ ] [ ]
(7)
Where Xj is an ordered set of observations x1 ≤ x2≤ x3
≤ …xn. For any distribution the first four L-moments
are easily computed from PWM using; = = 2 −
= 6 − 6 +
= 20 − 30 + 12 − (8) Sankarasubramanian & Srinivasan (1999) defines the moment ratios (coefficient of variation, L-skewness and L-kurtosis, respectively)
τ =λλ , τ =
λ λ τ =
λ
λ (9)
The goodness-of-fit-test based on the Kolmogorov-Smirnov approach given in Haan (1977) was used to select the best distribution fit to the sediment and water yield data.
2.3. Standardized Precipitation Index (SPI) Algorithm
In our study, the Standardized Precipitation Index (SPI) approach was used to determine sediment yield in wet and drought periods. The SPI developed by McKee et al (1993) is a way of measuring drought based only on precipitation. Although the SPI approach was originally developed to monitor drought from precipitation, but in the study the SPI was used in predicting wet and drought periods based on both precipitation and stream flow. The SPI are used to monitor conditions on a
variety of time scales. Technically, the SPI is the number of standard deviations that the observed value would deviate from the long-term mean, for a normally distributed random variable. The SPI have some advantages for the following reason. Precipitation is only variable in the SPI calculation. Therefore, this index can be applied in regions where the availability of climatic variables limits the use of other well-accepted indices as Palmer Drought Index (PDSI). SPI, which has a wide spectrum of time scales, make this index more flexible for both short-term and long-term drought monitoring (Edwards & McKee 1997). The SPI algorithm is conceptually equivalent to z-score commonly used in statistic:
= ∑ (10)
Where SPI is represent the standardized precipitation index, Pi is rainfall for a given period, n is
the total length of record and σp is standard deviation.
It is known that rainfall is typically positively skewed. Therefore, the precipitation data should be transformed a more normal or Gaussian symmetrical distribution to use the above z-score relationship (SPI). McKee et al (1993; 1995) and Komuscu (1999) implied that the long-term rainfall data sets must first be normalized to determine SPI belonging to the data sets. The prevalent conviction related to the transformation of monthly rainfall is that the gamma distribution is applied. Thorn (1966) stated that monthly rainfall generally fit to the gamma distribution. Guttman (1999) examined the impact of six distributions on SPI and recommended that Pearson Type III distribution is the best way to normalize long-term data when calculating SPI. Edwards and McKee (1997) suggested gamma distribution with two parameters to transform the precipitation data.
Sediment yields in meteorological and hydrological drought and wet conditions were compared using t-test.
3. Results and Discussion
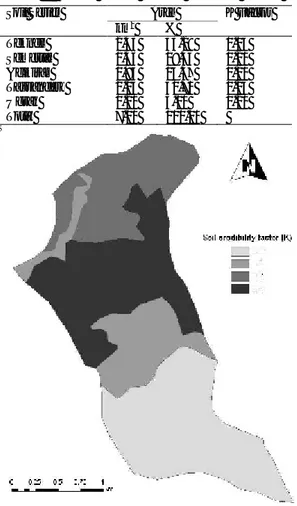
For estimating of soil erodibility factor for each soil series, soil samples were taken from the topsoil. The calculated K values using the Equation 3 are presented in Table 2. In the study area, the calculated K values varied between 0.03 and 0.25 t.h.t-1m-1. The most dominated soil series were Tekneli and Tavşandere soil series, and their K factors were 0.03 and 0.25, respectively. The spatial distribution of soil erodibility values are given in Figure 2.
Topographic factor (LS) was derived from DEM by multiplying the L and S factors. An increase in LS values show that the increasing rate of soil erosion. The LS values in the Uğrak watershed varied between 0 and
8.5 and its spatial distribution was presented in Figure 3.
Table 2- Soil erodibility factor for soil series
Çizelge 2- Toprak serileri aşınıma duyarlılık faktörü
Soil Series Area K Factor
km2 % Tekneli 2.33 33.29 0.03 Semertas 1.36 19.43 0.21 Acikiraz 0.95 13.57 0.20 Tavsandere 2.15 30.71 0.25 Ugrak 0.21 3.00 0.20 Total 7.00 100.00
Figure 2- Distribution of soil erodibility factor in the study watershed
Şekil 2-Çalışma havzası aşınıma duyarlılık dağılımı The factors of C were assigned to different land use types (Table 3) and were presented spatially in Figure 4. There are 3 main land use types as cropland, grassland and shrub in the Uğrak watershed. The crop management factors for cropland were obtained experimental plots (Oğuz et al 1998). On the other hand, the crop management factors for grassland and shrubs were used by previously proposed values of Çanga (1995).
In the study area, conservation practices are not followed. Hence, the conservation practice factor of 1 was assigned.
Figure 3- Distribution of topographic factor in the study watershed
Şekil 3-Çalışma havzası topoğrafik faktör dağılımı
Figure 4- Distribution of crop management factor in the study watershed
Şekil 4-Çalışma havzası bitki yönetim faktör dağılımı
Table 3- Crop management factor for land use/land cover classes
Çizelge 3- Arazi kullanım türlerine ait bitki yönetim faktörleri
Landuse Area C Factor
km2 %
Shrub 0.32 4.57 0.038
Grassland 1.22 17.43 0.050 Dry farming 5.46 78.00 0.280
Total 7.00 100.00
Finally KLSCP values were multiplied in ArcGIS environment and the result is presented spatially in Figure 5. Average KLSCP value was found 0.07 and some statistical evaluations were given in Table 4. In order to calculate the sediment yield in Uğrak watershed by MUSLE, average KLSCP value was taken as 0.07.
Figure 5- Distribution of multiplied KCLSP factors in the study watershed
Şekil 5-Çalışma havzasında KCLSP factor çarpımlarının dağılımı
Table 4- Statistical distribution of KLSCP values
Çizelge 4- KLSCP değerlerinin istatistiksel dağılımı Statistical
parameters
Min Max Mean STDV CV, %
K 0.03 0.25 0.18 0.08 44.44 LS 0.00 8.50 1.90 2.00 105.26 C 0.038 0.28 1.90 2.00 105.26 KLSCP 0.00 1.38 0.07 0.10 142.86
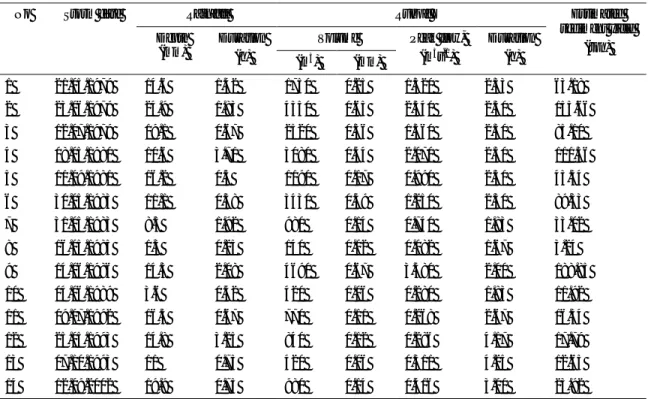
The average long-term discharge of the Ugrak watershed was 55.64 mm/year. Fourteen storms, for which an accurate and a reported data were available, were selected in the present study and detailed information is shown in Table 5 (Oguz & Balcin 2003). The selected storms of Uğrak watershed were used in applying Equation 1, and the results are presented in Table 5. The next step to predict annual sediment yield in the watershed were applied Equation 2. For this purpose the weighted storm yield was multiplied by the ratio of annual water yield to single storm sediment yield and water yield at some return periods (Table 6.). Table 6 is predicted from the Log-Normal distribution. The Log-Normal distribution among the distributions used in this study had the most minimum Kolmogorov-Smirnov test value than the other distributions. Therefore, the Log-Normal distribution was selected as best-fit distribution in order to obtain the sediment and
water yield with corresponding return periods. The computation of annual sediment yield after using MUSLE was presented in Table 7.
In this study, annual total rainfall and flow were used to determine meteorological and hydrological drought in the watershed. For this purpose we used Standardized Precipitation Index (SPI) to rainfall and flow between 1978-2002 years for 25 years period. In this period, 10 years drought and 15 years wet were found as meteorological and 14 years drought and 11 years wet were experienced as hydrological (Table 7). As rainfall and stream flow data were skewed, the mentioned data was transformed by taking logarithm of the data set. Thus, the rainfall and stream flow data were transformed a more normal or Gaussian symmetrical distribution to use the above z-score (SPI) relationship.
Table 5- Selected storms and estimated sediment yield by MUSLE in Ugrak watershed
Çizelge 5- Uğrak havzası seçilmiş akımları ve MUSLE ile hesaplanmış sediment verimi
No Storm date Rainfall Runoff Estimated
sediment yield (ton) Depth (mm) Duration (h)
Volume Peak flow, (m3 s-1 ) Duration (h) (m3 ) (mm) 1 21.05.1979 14.6 1.42 1750 0.25 1.320 2.33 63.18 2 23.06.1979 24.9 1.83 4550 0.65 2.540 2.50 155.66 3 12.07.1979 19.1 0.67 2520 0.36 1.560 2.50 85.10 4 08.05.1980 10.6 3.71 3080 0.44 2.070 2.50 111.56 5 11.09.1981 16.2 0.5 1190 0.17 0.990 2.50 43.34 6 30.05.1983 11.1 0.58 3430 0.49 1.250 2.50 89.33 7 31.05.1983 8.5 1.92 980 0.14 0.740 1.83 33.02 8 16.05.1985 1.3 0.25 140 0.02 0.082 1.67 3.24 9 14.06.1986 14.5 2.08 4690 0.67 3.480 2.00 188.85 10 04.06.1989 3.6 0.42 420 0.06 0.280 1.83 11.92 11 09.07.1992 16.5 0.67 770 0.11 0.268 2.67 16.34 12 25.05.1993 14.8 3.25 840 0.12 0.286 4.17 17.79 13 07.10.1993 11 0.75 420 0.06 0.311 4.25 12.65 14 12.09.2002 19.9 0.75 980 0.14 0.416 3.00 23.92
Table 6- Return periods for single storm sediment yield and water yield (for non-exceedance probability)
Çizelge 6- Sediment ve su verimi için bireysel fırtınaların tekerrür süreleri (aşılmama olasılığına göre)
Series Return periods, years
2 10 25 50 100
Ys, ton 1775.66 537.98 347.48 261.99 203.22
Qv, m3
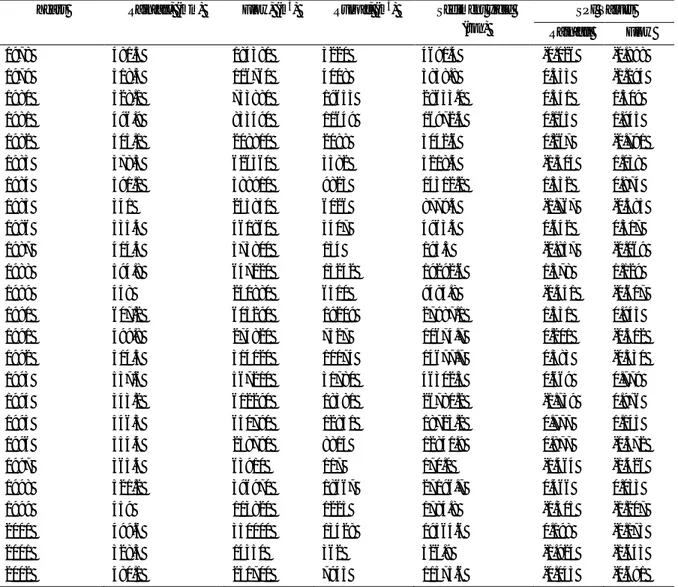
Table 7- Rainfall, flow, runoff, sediment yield and SPI values in Ugrak watershed
Çizelge 7- Uğrak havzasında yağış, akış, yüzey akış, sediment verimi ve SPI değerleri
Years Rainfall, (mm) Flow, (m3
) Runoff, (m3 ) Sediment yield (ton) SPI Values Rainfall Flow 1978 481.5 184380 3220 4691.4 -0.026 -0.898 1979 518.5 116760 4008 5838.8 0.433 -1.194 1980 528.1 733880 19653 28633.0 0.551 1.509 1981 496.9 833490 11649 16972.4 0.165 1.945 1982 505.1 208810 2088 3042.6 0.267 -0.791 1983 378.3 626360 3582 5218.4 -1.304 1.038 1984 591.1 588910 9823 14312.2 1.332 0.874 1985 341 255850 6026 8779.4 -1.767 -0.585 1986 535.4 461860 3407 4963.4 0.642 0.317 1987 414.4 373800 134 195.5 -0.857 -0.069 1988 594.8 647220 13242 19292.6 1.378 1.129 1989 448 250880 6510 9484.8 -0.441 -0.607 1990 607.2 605290 19209 27987.1 1.531 0.945 1991 499.8 274820 7327 10674.7 0.201 -0.502 1992 514.5 314020 10074 14677.7 0.383 -0.330 1993 537.6 567210 31780 46302.3 0.669 0.779 1994 343.2 612290 18381 26780.2 -1.739 0.976 1995 546.3 650790 12851 18723.2 0.777 1.145 1996 554.4 258790 8814 12841.9 0.877 -0.572 1997 365.4 63910 117 170.0 -1.464 -1.426 1998 521.2 396970 18667 27196.7 0.466 0.033 1999 459 113820 1225 1784.8 -0.305 -1.207 2000 499.6 350000 13428 19564.6 0.198 -0.173 2001 328.3 14350 362 526.9 -1.924 -1.643 2002 480.1 231700 7945 11575.6 -0.043 -0.691
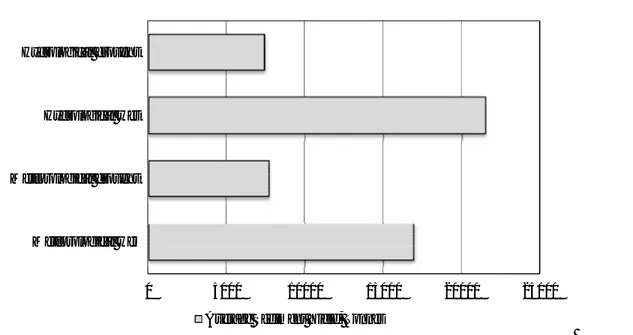
Estimated sediment yield by MUSLE were grouped meteorologically and hydrological drought and wet conditions in Figure 6. Sediment yields in meteorological and hydrological drought and wet conditions were compared using t-test and presented in Table 8. The estimated mean sediment yields were found similar in meteorological and hydrological wet conditions, whereas it was significantly different in meteorological and hydrological drought conditions. Changes in rainfall, erosion and as well as in the amount of cover vegetation result in further changes in both hydrology and soil erosion. These interactions
may not be accurately represented by watershed complexity.
Increasing precipitation and stream flow often result to increasing erosion as well as the amount of suspended sediment in a watershed. In Uğrak watershed we concluded that the drought decreases sediment yield dramatically. Same result was found in the Selenga River watershed within the Yenisey River watershed in southern East Siberia (Korytny et al 2003). In that study, an increase in precipitation was observed by an increase in suspended sediment load.
Figure 6- Sediment yield in drought and wet periods in Ugrak watershed
Şekil 6-Kurak ve yağışlı dönemlerde Uğrak havzası sediment verimi
Table 8- Average estimated sediment yield of different drought conditions
Çizelge 8- Farklı kuraklık koşullarında hesaplanmış ortalama sediment verimi
Drought Average Estimated
Sediment Yield (ton) Meteorological drought 6921b
Meteorological wet 18068a
Hydrological drought 7418b
Hydrological wet 21489a
As contrast, at four watersheds, the Edwards Plateau Land Resource Area of Texas in USA, were combined with the results of three prior surveys to assess the effect of the 1950s drought on sediment yield (Dunbar et al 2010). It was concluded that drought increased sediment yield dramatically. This suggests that the reduction of cover vegetation during the drought period become the rangeland so vulnerable to erosion. This factor outweighed the reduction in rainfall erosivity. In Uğrak, watershed land use is mostly dry farming (Table 3). Limited perennial vegetation and limited reduction of cover vegetation had a limited effect on sediment yield at drought conditions in the watershed.
Because of having different watershed characteristics, drought effect on sediment yield is different for every watershed. Therefore, more studies should be done to determine the effect of drought and wet conditions on sediment yield in different watersheds throughout the world.
4. Conclusion
Average rainfall and sediment yield were found as 403.9 mm and 6920.7 ton for the meteorological drought years and 536.7 mm and 18068.2 ton for the meteorological wet years, respectively. These values were measured as 30.7 mm and 7417.8 ton for the hydrological drought years and 87.3 mm and 21489.2 ton for the hydrological wet years. The sediment yields were found similar within the meteorological and hydrological wet conditions and at the same time within the meteorological and hydrological drought conditions. Average sediment yield was found statistically significant at meteorological and hydrological drought and wet years. In Uğrak watershed, cultivated lands cover larger areas than grassland and shrub areas therefore much more soil erosion occurred in wet years in the watershed. In the study, negative correlation between drought and sediment yield was also found.
References
Anlı A S, Apaydın H & Öztürk F (2009). Regional frequency analysis of the annual maximum precipitation observed in Trabzon province. Tarım Bilimleri Dergisi 15: (3) 240-248
Asokan K (1981). Runoff and sediment yield from Bino subwatershed of Ramganga catchment. Msc Thesis, Govind Ballabh Pant University (Unpublished), India
0 5000 10000 15000 20000 25000
Meteorological wet Meteorological drought Hydrological wet Hydrological drought
Banasik K & Walling D E (1996). Predicting sediment graphs for a small agricultural catchment. Nordic Hydrology
27(4): 275-294
Blackburn W H, Pierson F B, Hanson C L, Thurow T L & Hanson A L (1992). The spatial and temporal influence of vegetation on surface soil factors in semiarid rangelands. Transactions of the ASAE 35: 479–486
Canbazoğlu M K & Gogus M (2004). Sediment yields of basins in the Western Black Sea Region of Turkey. Turkish Journal of Engineering and Environmental Sciences 28: 355-367
Canga M R (1995). Toprak ve Su Koruma. Ankara Üniversitesi Ziraat Fakültesi Yayınları: 1386, Ders kitabı: 400, Ankara
Dadkah M & Gifford G F (1980). Influence of vegetation, rock cover and trampling on infiltration rates and sediment production. Water Resources Bulletin 16: 979– 986
Dodangeh Smaeel, Sattari M T & Seçkin N (2011). Regional frequency analysis of minimum flow by L-Moments method. Tarım Bilimleri Dergisi 17: 43-58
Dunbar J A, Allen P M & Bennett S J (2010). Effect of multiyear drought on upland sediment yield and subsequent impacts on flood control reservoir storage. Water Resources Research 46: 1-12
Edwards D C & McKee T B (1997). Characteristics of 20th century drought in the United States at multiple time scales. Climatology Report 97-2, Colorado State University, Fort Collins, CO
Erskine W D, Mahmoudzadeh A & Myers C (2002). Land use effects on sediment yields and soil loss rates in small basins of Triassic sandstone near Sydney NSW Australia. Catena 49: 271-287
ESRI (2009). ArcGIS desktop 9.3 help, Environmental Systems Research Institute (ESRI), http://webhelp.esri.com/arcgisdesktop/9.3/
Foster G R, Mc Cool D K, Renard K G & Moldenhauer W C (1991). Conversion of the universal soil loss equation to SI metric units. Journal of Soil and Water Conservation
36: 355-359
Giakoumakis S G & Tsakiris G P (1997). Meteorological drought effect on sediment yield. Water Resources Management 11: 365–376
Greenwood J A, Landwehr JM, Matalas NC & Wallis J R (1979). Probability weighted moments: Definition and relation to parameters of several distributions expressible in inverse form. Water Resources Research 15: 1049– 1054
Gutierrez J & Hernandez I I (1996). Runoff and interril erosion as affected by grass cover in a semi-arid rangeland of northern Mexico. Journal of Arid Environment 34: 287–295
Guttman NB (1999). Accepting the standardized precipitation index: A Calculation algorithm. Journal of the American Water Resources Association 35: 311-322
Haan, C T (1977). Statistical methods in hydrology. Iowa State Uni. Press, Ames, IA
Hosking J R M & Wallis J R (1997). Regional frequency analysis: An approach based on LMoments. Cambridge University Press, Cambridge, U.K
Kinell P I A & Risse L M (1998). USLE-M: empirical modeling rainfall erosion through runoff and sediment concentration. Soil Science Society of America Journal
62: 1162-1672
Kinell P I A (2001). The USLE-M and modeling erosion within catchments. In: Slott D E Mohtar R H Steinardt (Eds) 10th
International Soil Conservation Organization Meeting Purdue University-USDA-ARS National Soil Erosion Research Laboratory, USA
Komuscu A U (1999). Using the SPI to analyze spatial and temporal patterns of drought in Turkey. Drought Network News 11: 7–13
Korytny LM, Bazhenova OI, Martianova GN & Ilyicheva EA (2003). The influence of climatic change and human activity on erosion processes in sub-arid watersheds in southern East Siberia. Hydrological Processes 17: 3181-3193
Kundzewicz Z W & Parry M L (2002). Europe, in Climate Change 2001: Impacts, Adaptation, and Vulnerability. Edited by J. McCarthy et al., pp. 641–692, Cambridge Univ. Press, Cambridge, U. K
Mc Cool D K, Foster G R, Mutchler C K & Meyer L D (1987). Revised slope steepness factor for the universal soil loss equation. Transactions of the AAE 30:(5) 1387-1396
McKee T B, Doesken N J & Kleist J (1993). The relationship of drought frequency and duration to time scales. Eighth Conference on Applied Climatology, American Meteorological Society, Anaheim, CA
McKee T B, Doesken N J & Kleist J (1995). Drought monitoring with multiple time scales. Preprints, 9th Conference on Applied Climatology 15-20 January Dallas Texas American Meteorological Society 233-236 Mishra S K, Tyagi J V, Singh V P & Singh R (2006).
SCS-CN based modelling of sediment yield. Journal of Hydrology 324: 301-322
Nearing, M A, Jetten V, Baffaut C, Cerdan O, Couturier A, Hernandez M, Le Bissonnais Y, Nichols M.H, Nunes J.P, Renschler C.S, Souchère V & Van Oost K (2005). Modelling response of soil erosion and runoff to changes in precipitation and cover. Catena 61: 131–134
Nicks A D, Williams J R & Gander G A (1994). Estimating erosion with models having different technologies. Proc.25th Annual Conference International Erosion Control Associate Reno NV February 15-18 pp. 51-61 Nunes J P, Seixas J & Pacheco N R (2008). Vulnerability of
water resources, vegetation productivity and soil erosion to climate change in Mediterranean watersheds. Hydrological Process Journal 22: 3115–3134
Oguz I, Balcin M & Senol M (1998). Yozgat yöresinde Üniversal Denklemin K, R, C ve P faktörleri. Toprak ve Su Kaynakları Araştırma Yıllığı 1997. Köy Hizmetleri Genel Müdürlüğü, 106:71-81
Oguz I & Balcin M (2003). Tokat- Uğrak havzası yağış ve akış karakteristikleri. Toprak ve Su Kaynakları Araştırma
Sonuç Raporları 2003. T.C. Tarım ve Köy İşleri Bakanlığı, Köy Hizmetleri Genel Müdürlüğü, APK Dairesi Başkanlığı, Toprak ve Su Kaynakları Araştırma Şube Müdürlüğü, Yayın No: 124. Ankara
Oguz I, Ersahin S & Susam T (2011). Evaluation of Desertification Potential in a Sloping Catchment. Carpathian Journal of Earth and Environmental Sciences 6 (1): 81-88
Pandey A, Chowdary V M & Mal B C (2009). Sediment yield modelling of an agricultural watershed using MUSLE, remote sensing and GIS. Paddy and Water Environment
7: 105-113
Pruski F F & Nearing M A (2002). Runoff and soilloss responses to changes in precipitation: A computer simulation study. Journal of Soil Water Conservation 57: 7–16
Sadeghi S H (2004). Aplication of MUSLE in prediction of sediment yield in Iranian Conditions. ISCO 2004-13th Int. Soil Conservation Org. Conference Brisbane
Sadeghi S H R, Mizuyama T & Miyata S (2007). Is MUSLE apt to small steeply reforested watershed? Journal of Forest Research 12: 270-277
Sankarasubramanian A & Sirinivasan K (1999). Investigation and comparison of sampling properties of L-Moments and conventional moments. Journal of Hydrology 218: 13-34
Schumm S A (1977). The fluvial system. 338 pp John Wiley, New York
Seiler R A, Hayes M & Bressan L (2002). Using the standardized precipitation index for flood risk monitoring. International Journal of Climatology 22: 1365-1376 Simons D B & Şentürk F (1992). Sediment transport
technology. Water Resources Publications Littleton Col
Thorn H C S (1966). Some methods of climatological analysis. WMO Techniques Note 81: 8, 16-22
Yurekli K & Kurunc A (2006). Simulating agricultural drought periods based on daily rainfall and crop water consumption. Journal of Arid Environments 67: 629-640 Yurekli K & Anlı S A (2008). Analyzing drought based on
annual total rainfalls over Tokat province. International Journal of Natural and Engineering Sciences 2: (2) 21-26 Yurekli K, Anlı S A, Karahan G & Ors I (2009). Drought trend analysis in Karaman province. 1. Ulusal Kuraklık ve Çölleşme Sempozyumu, 113–119, 16–18 Haziran, Konya, Turkiye
Yürekli K & Öztürk F (2000). Tokat-Uğrak havzasında erozyona sebep olan yağmurların incelenmesi. Tarım Bilimleri Dergisi-Journal of Agricultural Sciences 6 (1): 67-72
Yurekli K, Ünlükara A & Yıldırım M (2010). Karaman province drought analysis by different approaches. Research Journal of Agricultural Sciences 3: (1) 19-23 Yurekli K, Sattari M H, Anlı A S Hınıs M A (2012). Seasonal
and annual regional drought prediction by using data-mining approach. Atmosfera 25: (1) 85-105
Williams J R & Berndt H D (1977). Sediment yield prediction based on watershed hydrology. Transactions of the ASAE 23: 1100-1104
Williams J R (1982). Testing the modified universal soil loss equation. In: Proceedings of the Workshop on Estimating Erosion and Sediment Yield on Rangelands. U.S. Department of Agriculture ARM-W-26, 157-161 Wood J C, Wood M K & Tromble J M (1987). Important
factors influencing water infiltration and sediment production on arid lands in New Mexico. Journal of Arid Environment 12: 111–118