Address for correspondence: Dr. Bahri Elmas, Sakarya Üniversitesi Tıp Fakültesi Pediyatri Bölümü, Sakarya-Türkiye
E-mail: [email protected]
Accepted Date: 17.05.2017 Available Online Date: 25.07.2017
©Copyright 2017 by Turkish Society of Cardiology - Available online at www.anatoljcardiol.com DOI:10.14744/AnatolJCardiol.2017.7740
Bahri Elmas, Mehmet Karacan
1, Pınar Dervişoğlu*, Mustafa Kösecik*, Şükriye Pınar İşgüven**, Ceylan Bal
2Departments of Pediatrics, *Pediatric Cardiology, **Pediatric Endocrinology, Faculty of Medicine, Sakarya University; Sakarya-Turkey Department of 1Pediatric Cardiology, Faculty of Medicine, Medipol University; İstanbul-Turkey
Department of 2Biochemistry, Faculty of Medicine, Yıldırım Beyazıt University; Ankara-Turkey
Dynamic thiol/disulphide homeostasis as a novel indicator
of oxidative stress in obese children and its relationship
with inflammatory-cardiovascular markers
Introduction
Obesity is an increasing major health problem in both chil-dren and adults and is a multifactorial disorder (1). A recent study has suggested that an estimated 1.48 billion adults are overweight, 502 million adults are obese, and 180 million chil-dren are overweight or obese worldwide. Moreover, approxi-mately 32% and 17% of children and adolescents in the United States are considered overweight and obese, respectively (2). Obese children and adolescents have a higher risk of be-ing obese in adulthood, and adulthood obesity is associated with an increased risk of mortality and morbidity (3). Obesity is a low-grade (subclinical) systemic inflammatory disease. Overweight and obese children have elevated serum levels
of white blood cells (WBCs), lymphocytes (L), high-sensitivity C-reactive protein (hs-CRP), interleukin 6, and tumor necrosis factor-alpha and increased neutrophil-lymphocyte ratio (NLR), which are known markers of inflammation and closely associ-ated with cardiovascular risk factors (4, 5).
There is a significant direct relationship between the amount of epicardial adipose tissue thickness (EATT) and general body adiposity. There is substantial evidence that supports the role of EATT in the pathogenesis of coronary artery disease. There is a positive correlation of EATT with the presence of coronary pathology and the ability of adipose tissue to secrete hormones and cytokines that provoke coronary artery atherothrombosis. Thus, EATT may be an important risk factor for cardiovascular disease in obesity (6).
Objective: Childhood obesity is an important cause of cardiovascular risk with chronic inflammation. Oxidative stress may contribute to the pathogenesis of obesity-related cardiovascular pathologies. We aimed to evaluate thiol/disulphide homeostasis as a novel and sensitive marker of oxidative stress and to evaluate its relationship with some inflammatory and cardiovascular markers in obese children.
Methods: In this case-controlled study, 65 children with exogenous obesity and 64 healthy children, as a control group, were included. In both groups, thiol/disulphide homeostasis parameters and inflammatory (white blood cells, platelets, mean corpuscular volume, neutrophil/lympho-cyte ratio, and high-sensitivity C-reactive protein) and cardiovascular (epicardial adipose tissue thickness and left ventricular mass index) markers were studied. Correlation analyses of thiol/disulphide homeostasis parameters with body mass index standard deviation scores (BMI SDS) and inflammatory and cardiovascular markers were performed. Receiver-operating characteristic analysis was performed to determine the sensitivity, specificity, and optimal cut-off values of thiol/disulphide homeostasis parameters.
Results: Native thiol, total thiol, and native thiol/total thiol ratios (antioxidant parameters) were lower (p<0.05) and disulphide/native thiol and disulphide/total thiol ratios (oxidant parameters) were higher in the obese group than in the control group (p<0.01). A positive correlation of oxi-dant parameters with BMI SDS and inflammatory markers was found. However, a negative correlation of antioxioxi-dant parameters with BMI SDS and inflammatory markers was found. The specificities of disulphide/native thiol and disulphide/total thiol ratios were higher in the obese group. Conclusion: The impairment in thiol/disulphide homeostasis, which is indicative of oxidative stress, is associated with inflammation in obesity. In addition, cardiovascular involvement may also contribute to this impairment. (Anatol J Cardiol 2017; 18: 361-9)
Keywords: cardiovascular risk, children, inflammation, obesity, oxidative stress, thiol/disulphide homeostasis
mass that are related to an increase in cardiac workload (7). Even with normal ventricular mass, overweight children exhibit subtle changes in LV systolic and diastolic functions that may have implications for their future cardiovascular health (8). LV mass has been established as an independent risk factor for car-diovascular morbidity and mortality (9, 10). The LV mass index (LVMI) has been proposed to be accountable for differences in body size (11).
Recent studies have highlighted the role of oxidative stress in the pathogenesis of obesity. It is emphasized that the coexis-tence of subclinical inflammation and oxidative stress plays a significant role as a pathophysiological mechanism in the deve- lopment and progression of atherosclerotic process (12). Excess energy due to energy imbalance accumulates in adipocytes; this in turn leads to hypertrophy and hyperplasia. This situation causes hypoxia in adipose tissue and increases the secretion of inflammatory cytokines and chemokines (13). Adipocytokines are responsible for local and systemic inflammation associated with obesity. Inflammation causes mitochondrial oxidative stress and endoplasmic reticulum dysfunction in adipocytes. Additional- ly, adipocyte-related macrophages can trigger the oxidative stress (14, 15).
Thiols, as a major antioxidant, play an important role in the eradication of reactive oxygen molecules via nonenzymatic pathways. Thiols engage in oxidation reactions, forming disul-phide bonds with oxidant molecules. Thiol/disuldisul-phide homeosta-sis is essential for detoxification. The parameters of this homeo-stasis include native and total thiol; disulphide; and disulphide/ native thiol, native thiol/total thiol, and disulphide/total thiol ratios. These parameters have recently been studied as novel oxidative stress parameters in a wide range of diseases such as coronary heart disease (16, 17), isolated coronary artery ectasia (18), slow coronary flow (19), diabetes mellitus (20, 21), respira-tory diseases (22), Alzheimer’s disease (23), and pre-eclampsia (24). Nevertheless, to the best of our knowledge, no study has investigated thiol/disulphide homeostasis as a novel oxidative stress indicator in obese children and their association with in-flammatory and cardiovascular markers until today. Therefore, we conducted this study to investigate thiol/disulphide homeo-stasis, a novel and sensitive oxidative stress marker, and its re-lationship with some inflammatory and cardiovascular markers in obese children.
Methods
Study design, participants, and blood samples
This case-control study included 139 children aged 5–17 years who were admitted to outpatient clinics of the Departments of Pediatric Endocrinology and Pediatric Cardiology of the Sakarya University, Research and Training Hospital between May 2015 and April 2016; the children were divided into obese and control groups. Obese group comprised 75 children with exogenous
obe-for obesity. In all obese children, age- and gender-adjusted body mass indices were above the 95th percentile. They were asked
to have obesity for at least a year. Body weight and height mea-surements were performed using a same tool. The body mass index (BMI) values were calculated as weight (kg) divided by height (m) squared. The BMI reference curves established by Bundak et al. (25) for Turkish children were used for determina-tion of corpulence. As defined by the Internadetermina-tional Obesity Task Force, children with BMIs above 95th percentiles were accepted
as obese, according to age and sex (26). BMI standard deviation score (BMI SDS) was used in statistical calculations because there was a wide age distribution in both obese and control groups. Patients with BMI SDS of 2 and above were accepted as obese. Children with obesity originating from secondary and genetic causes were excluded from the study after an evalu-ation by the pediatric endocrinologist. Children aged <4 years, children with suspected monogenic obesity and with syndromic obesity, and obese children with hormonal disorders were ex-cluded from the study. Patients with impaired glucose tolerance, diabetes, dyslipidemia, and hypertension were also excluded. Furthermore, patients with early cardiovascular disease his-tory, chronic illnesses, long-term medication for any reason, or infection with and without fever during the last 15 days and smokers were excluded. Age- and gender-matched 64 children who visited the outpatient clinic of the Department of Pediatric Cardiology with chest pain or murmur in whom pathology could not be identified by the pediatric cardiologist on physical exami-nation, electrocardiography, and echocardiographic findings and in whom cardiac enzyme and hemoglobin levels and BMI were within the normal range (BMI values under 85th percentile; BMI
SDS <2) were included in the control group. All control cases were healthy.
Systolic blood pressure (SBP) and diastolic blood pressure (DBP) were measured twice from the right arm after a 10-min rest in the supine position using a same mark and model sphyg-momanometer that was appropriate for ages of all participants in this study. All ultrasound studies were performed using a Philips iE33 ultrasound machine with 3 MHz phase transducer (Philips Ultrasound, Bothell, USA). Examinations were performed in the left lateral position with standard parasternal long-axis and api-cal four-chamber views. Two-dimensional targeted M-mode echocardiographic tracings were obtained in the parasternal long-axis view. LV mass was automatically calculated by the device using the current standardized formula, and height was used for indexing, and indexation of LV mass to height raised to an allometric exponent of 2.7 (LVMI=LV mass/height 2.7) (11, 27).
EATT was measured using two-dimensional echocardiogra-phy as an echo-free space over the pericardial layers, and its thickness was measured on the free wall of the right ventricle, perpendicular to the wall, using parasternal long-axis view at end-diastole (28). The measurements were performed by the same pediatric cardiologist.
Peripheral venous blood samples were obtained using EDTA-containing blood collector tubes for determining complete blood count (CBC), including WBC, L, neutrophil (N), and platelet (PLT) counts as well as NLR and mean corpuscular volume (MCV). CBC was determined within 1 h. Blood samples for measuring serum thiol/disulphide homeostasis parameters and hs-CRP le- vels were collected in 5 mL to 16x100-mm tubes with red caps not containing gel (BD Vacutainer, New Jersey, USA). Serum samples were separated after centrifugation at 1500 rpm for 10 min and stored at –80°C until further analysis.
This study was conducted in accordance with the prin-ciples of the Declaration of Helsinki. The study protocol was approved by the Sakarya University Local Ethical Committee, and fully informed consents were obtained from the parents of all the children.
Measurement of thiol/disulphide homeostasis parameters and hs-CRP levels
Thiol disulphide parameters were determined using a novel spectrophotometric method previously described by Erel and Neşelioğlu (29). Briefly, reducible disulphide bonds were re-duced to form free functional thiol groups. Formaldehyde was used to remove unused and consumed sodium borohydride. All thiol groups including native thiol groups and reduced thiol groups were measured after reaction with DTNB
[5,5’-dithio-bis-(2-nitrobenzoic acid)]. The amount of dynamic disulphide was calculated using the half of the difference between the to-tal thiol and native thiol. Disulphide/native thiol, disulphide/toto-tal thiol, and native thiol/total thiol ratios were calculated after de-termining dynamic disulphide, native thiol, and total thiol levels. An automated clinical chemistry analyzer (Cobas 501, Roche Diagnostics, Mannheim, Germany) was used, and the results were presented in μmol/L. Serum hs-CRP concentration was determined using the Siemens CardioPhase hs-CRP (Siemens Healthcare Diagnostics Products GmbH, Marburg, Germany) particle-enhanced immune nephelometric assay on the BN II analyzer (Siemens Healthcare Diagnostics Products GmbH, Marburg, Germany). Expected hs-CRP levels in healthy individu-als were lower than 3.0 mg/L.
Statistical analysis
Descriptive statistics were conducted to inform the gen-eral features of participants. Kolmogorov–Smirnov test was used to determine the distribution of numerical variables. Nu-merical variables with normal distribution were calculated as mean±standard deviation, those with abnormal distribution me-dian (range). Categorical variables were denoted as numbers (n) and percentages (%). Student’s t-test was used to compare numerical variables with normal distribution. Mann–Whitney U test was used to compare numerical variables with abnormal
Table 1. Demographic data, clinical findings, inflammatory parameters, and echocardiographic data of study groups
Obese group (n=75) Control group (n=64) P
Demographic data and clinical findings
Age, years 12.0 (5.0–17.0) 12.8 (5.0–17.0) 0.303 Gender, male/female 34/41 27/37 0.710 BMI SDS 2.63 (2.01–14.64) -0.13 (-3.50–1.94) <0.001 SBP, mm Hg 125 (100–139) 120 (71–137) 0.021 DBP, mm Hg 70 (50–95) 70 (58–95) 0.816 Inflammatory markers WBC, x103/mm3 8.40 (4.88–15.00) 7.35 (2.50–16.10) 0.004 NLR 1.27 (0.63–14.06) 1.91 (0.78–47.67) <0.001 N, x103/mm3 3.92 (1.53–12.50) 3.93 (1.58–14) 0.884 L, x103/mm3 3.18 (1.67–11.20) 2.27 (0.73–3.63) <0.001 MCV, fL 81.2 (73.80–92.80) 85.4 (65.8–94.8) <0.001 PLT, mm3 354 (191–624) 268 (175–491) <0.001 PLR 118.30 (28.84–230.15) 120.10 (63.35–294.52) 0.289 hs-CRP, mg/L 2.37 (0.10–15.50) 0.45 (0.16–10.10) <0.001 Echocardiographic data EATT, mm 5.10 (3.90–5.70) 4.80 (4.20–5.60) <0.001 LVMI, g/m2.7 51.85 (26.86–80.76) 39.33 (18.20–94.87) <0.001
Parameters were expressed as n and median (range). Mann–Whitney U test and χ2 test were performed, and P value < 0.05 was considered significant. BMI SDS - body mass
index standard deviation score; DBP - diastolic blood pressure; EATT - epicardial adipose tissue thickness; hs-CRP - high-sensitivity C-reactive protein; L - lymphocytes; LVMI - left ventricular mass index; MCV - mean corpuscular volume; N - neutrophils; NLR - neutrophil-to-lymphocyte ratio; PLR - platelet-to-lymphocyte ratio; PLT - platelets; SBP - systolic blood pressure; WBC - white blood cells
For establishing a relationship between numerical variables with normal distribution, Pearson correlation coefficient was calcu-lated and for those with abnormal distribution, Spearman cor-relation coefficient was calculated. The cut-off value for thiol/ disulphide homeostasis parameters was calculated using a re-ceiver-operating characteristic (ROC) curve. A p value <0.05 was considered as statistically significant for all analyses.
Results
The median ages of 75 obese children and 64 healthy controls were 12.0 (5.0–17.0) years and 12.8 (5.0–17.0) years, respectively. No significant differences regarding age and gender were ob-served between the groups (p>0.05). There was no significant difference between two groups regarding DBP (p=0.816), but SBP values were significantly higher in obese group (p=0.021).
hs-CRP levels and L and PLT counts were significantly higher (p<0.001 and p<0.001, respectively) and NLR and MCV were lo- wer (p<0.001 and p<0.001, respectively) in obese group. Howev-er, there were no significant differences regarding N count and platelet-to-lymphocyte ratio between the groups (p=0.884 and p=0.289, respectively). EATT and LVMI were significantly higher in obese group than in control group (p<0.001, both). Demographic data, clinical characteristics, inflammatory parameters, and echocardiographic data of subjects are summarized in Table 1.
Thiol/disulphide homeostasis parameters of the groups are summarized in Table 2. The native and total thiol levels and native thiol/total thiol ratios were lower (p=0.019, p=0.044, and p=0.001,
respectively) and disulphide/native thiol and disulphide/total thiol ratios were higher (p=0.001 and p=0.001, respectively) in obese group than in control group. Although disulphide levels were high-er in obese group, the diffhigh-erence was not significant (p=0.051).
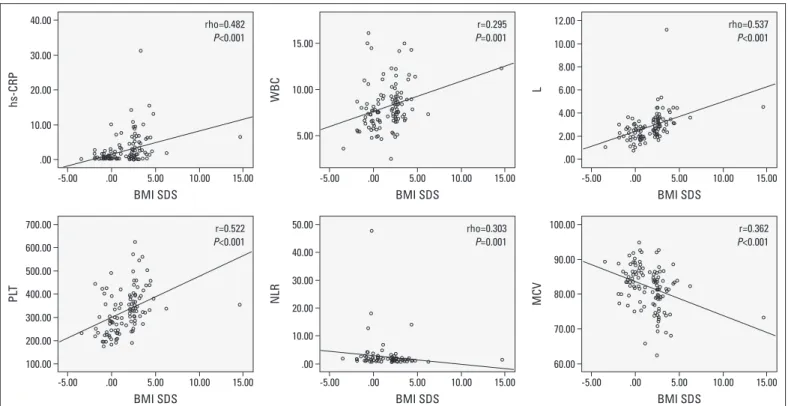
The results of correlation analysis are summarized in Table 3. There was a positive correlation of BMI SDS with hs-CRP levels (r=0.482, p<0.001), WBC count (r=0.295, p=0.001), L count (r=0.537, p<0.001), and PLT count (r=0.406, p<0.001) and a nega-tive correlation with NLR (r=–0.303, p=0.001) and MCV (r=–0.362, p<0.001) (Fig. 1). In addition, BMI SDS positively correlated with SBP (r=0.241, p=0.004), LVMI (r=0.428, p<0.001), and EATT (r=0.451, p<0.001) in obese group (Fig. 2). There was a negative correlation of BMI SDS with native thiol (r=–0.239, p=0.005), total thiol (r=–0.224, p=0.008), and native thiol/total thiol ratio (r=–0.205, p=0.015) and a positive correlation with disulphide/
Table 2. Thiol/disulphide homeostasis parameters of study groups Obese group Control group P
(n=75) (n=64)
Native Thiol, μmol/L 383.28 (52.07) 403.11 (45.68) 0.019 Total Thiol, μmol/L 419.82 (53.92) 437.53 (47.92) 0.044 Disulphide, μmol/L 18.27 (3.64) 17.21 (2.67) 0.051 Disulphide/Native thiol % 4.83 (1.09) 4.29 (0.67) 0.001 Disulphide/Total thiol % 4.38 (0.89) 3.94 (0.57) 0.001 Native Thiol/Total thiol % 91.22 (1.78) 92.10 (1.14) 0.001
Parameters are expressed as mean (SD). Student’s t-test was performed, and P value <0.05 was considered significant
Table 3. Results of the correlation analyses between thiol/disulphide homeostasis parameters and BMI SDS, inflammatory, and cardiovascular markers
Native thiol Total thiol Disulphide Disulphide/ Disulphide/ Native Thiol/ BMI SDS Native thiol Total thiol Total thiol
R P R P R P R P R P R P R P BMI SDSa -0.239 0.005 -0.224 0.008 0.053 0.533 0.206 0.015 0.205 0.015 -0.205 0.015 SBPb 0.015 0.859 0.011 0.901 0.001 0.999 0.034 0.692 0.034 0.692 -0.034 0.692 0.241 0.004 DBPa 0.044 0.610 0.040 0.643 -0.020 0.814 -0.039 0.651 -0.038 0.655 0.038 0.655 -0.011 0.893 hs-CRPb -0.134 0.115 -0.136 0.110 0.019 0.824 0.125 0.141 0.125 0.141 -0.125 0.141 0.482 <0.001 WBCa -0.123 0.194 -0.137 0.148 -0.032 0.733 0.095 0.318 0.095 0.318 -0.095 0.318 0.295 0.001 Nb -0.008 0.931 -0.025 0.793 -0.100 0.296 -0.054 0.573 -0.054 0.573 0.054 0.573 0.086 0.369 Lb -0.311 0.001 -0.310 0.001 0.016 0.865 0.253 0.007 0.253 0.007 -0.253 0.007 0.537 <0.001 NLRb 0.213 0.024 0.197 0.037 -0.103 0.280 -0.231 0.014 -0.231 0.014 0.231 0.014 -0.303 0.001 PLTa -0.102 0.285 -0.097 0.305 0.108 0.254 0.221 0.019 0.221 0.019 -0.221 0.019 0.522 <0.001 PLRa 0.277 0.003 0.262 0.005 -0.039 0.685 -0.216 0.023 -0.216 0.023 0.216 0.023 -0.102 0.286 MCVa 0.146 0.124 0.147 0.120 0.057 0.546 -0.055 0.565 -0.053 0.579 0.053 0.579 -0.362 <0.001 LVMIb -0.174 0.041 -0.172 0.043 -0.021 0.805 0.096 0.260 0.096 0.260 -0.096 0.260 0.428 <0.001 EATTb 0.034 0.688 0.041 0.635 0.045 0.596 0.018 0.833 0.018 0.833 -0.018 0.833 0.451 <0.001
aPearson correlation test and bSpearman correlation test were performed. BMI SDS - body mass index standard deviation score; DBP - diastolic blood pressure; EATT - epicardial
adipose tissue thickness; hs-CRP - high-sensitivity C-reactive protein; L - lymphocytes; LVMI - left ventricular mass index; MCV - mean corpuscular volume; N - neutrophils; NLR - neutrophil-to-lymphocyte ratio; PLR - platelet-to-lymphocyte ratio; PLT - platelets; SBP - systolic blood pressure; WBC - white blood cells
native thiol (r=0.206, p=0.015) and disulphide/total thiol (r=0.205, p=0.015) ratios in the obese group (Fig. 3). However, there was no significant correlation between BMI SDS and disulphide level (r=0.053, p=0.533). Furthermore, there was a negative correlation of LVMI with native thiol (r=–0.174, p=0.041) and total thiol (r= –0.172, p=0.043) in the obese group (Fig. 4).
ROC curve evaluating thiol/disulphide homeostasis param-eter thresholds is summarized in Figure 5. Specificities of disul-phide/native thiol and disulphide/total thiol ratios determined using the optimum cut-off values, 4.973 for the former and 4.582 for the latter, were higher in obesity group; sensitivities of both disulphide/native thiol and disulphide/total thiol ratios
deter-mined using the same optimum cut-off value were low. The sen-sitivity and specificity of native and total thiol, disulphide values, and native thiol/total thiol ratios were low.
Discussion
In our study, the thiol/disulphide homeostasis antioxidant pa-rameters were lower in the obese children, whereas the oxidant parameters were higher in them. Thus, thiol/disulphide homeo-stasis was found to shift toward disulphide formation. In addition, there was an increase in the values of cardiovascular markers such as SBP, EATT, and LVMI with elevation in levels of
inflam-hs-CRP WBC L
PLT NLR MCV
BMI SDS BMI SDS BMI SDS
BMI SDS BMI SDS BMI SDS
40.00 15.00 12.00 700.00 50.00 100.00 90.00 80.00 70.00 60.00 40.00 30.00 20.00 10.00 .00 600.00 500.00 400.00 300.00 200.00 100.00 10.00 8.00 6.00 4.00 2.00 .00 10.00 5.00 rho=0.482 P<0.001 r=0.295 P=0.001 rho=0.537 P<0.001 r=0.522 P<0.001 rho=0.303 P=0.001 r=0.362 P<0.001 30.00 20.00 10.00 .00 15.00 15.00 15.00 15.00 15.00 15.00 10.00 10.00 10.00 10.00 10.00 10.00 5.00 5.00 5.00 5.00 5.00 5.00 .00 .00 .00 .00 .00 .00 -5.00 -5.00 -5.00 -5.00 -5.00 -5.00
Figure 1. Scatter plot figures for correlations analyses of hs-CRP, WBC, L, NLR, PLT, and MCV with BMI SDS in obese group. Spearman correlation coefficient was calculated between BMI SDS and hs-CRP, L, and NLR, whereas Pearson correlation coefficient was calculated between BMI SDS and WBC, PLT, and MCV
BMI SDS - body mass index standard deviation score; hs-CRP - high-sensitivity C-reactive protein; L - lymphocytes; MCV - mean corpuscular volume; NLR - neutrophil-to-lymphocyte ratio; PLT - platelets; WBC - white blood cells
Figure 2. Scatter plot figures for correlations analyses of EATT, LVMI, and SBP with BMI SDS in obese group. Spearman correlation coefficient was calculated
BMI SDS - body mass index standard deviation score; EATT - epicardial adipose tissue thickness; LVMI - left ventricular mass index; SBP - systolic blood pressure
EA TT SBP LVMI 6.00 140 120 100 80 100.00 80.00 60.00 40.00 20.00 .00 5.50 5.00 4.50 4.00 3.50
BMI SDS BMI SDS BMI SDS
15.00 15.00 15.00 10.00 10.00 10.00 5.00 5.00 5.00 .00 .00 .00 -5.00 -5.00 -5.00 rho=0.451 P<0.001 rho=0.241 P=0.004 rho=0.428 P<0.001
matory markers such as WBC, NLR, L, MCV, PLT, and hs-CRP in obese children. Furthermore, there was a negative correlation between thiol/disulphide homeostasis antioxidant parameters and BMI SDS, some inflammatory and cardiovascular markers.
Although different mechanisms have been postulated in the pathogenesis of obesity-related complications, the most widely accepted hypothesis is that adipose tissue inflammation plays a critical role and an oxidant status emerges in obese individuals (30). Oxidative stress is a product of imbalance between reac-tive oxygen species (ROS) and antioxidant molecules. ROS are involved in many aspects of atherogenesis, including oxidized LDL formation, endothelial activation, monocyte-derived mac-rophage recruitment, vascular smooth muscle cell proliferation, and matrix remodeling. Physiologically, ROS perform important signaling functions as intracellular messengers, and one of their key targets are protein thiols (31). Thiols are mercaptans that contain sulfhydryl residues. They are the main molecules coordinating antioxidant protective mechanisms (1). Thiols form disulphide bonds by engaging in oxidation reaction with ROS. Di-sulphide bonds are reversible bonds that are formed between protein thiol groups and low molecular weight thiols via oxida-tion of cystine residues due to oxidative stress. The disulphide bonds can be reduced to thiol groups; thus, dynamic thiol/disul-phide homeostasis is sustained (12, 13). Total thiols comprise free forms, reduced to glutathione forms, and proteins-bonded forms in intracellular and extracellular spaces. Native thiol com-prises only reduced thiols, whereas total thiol comcom-prises both reduced and oxidized thiols (14).
Thiol/disulphide homeostasis was first described as a newly developed method by Erel et al. (29). They defined this method
Figure 4. Scatter plot figures for correlations analyses of LVMI with native and total thiol in obese group. Spearman correlation coefficient was calculated
LVMI - left ventricular mass index
Nativ e thiol Total thiol 550.00 600.00 500.00 550.00 450.00 500.00 400.00 450.00 350.00 400.00 300.00 350.00 250.00 300.00 100.00 100.00 80.00 80.00 60.00 60.00 40.00 40.00 20.00 20.00 .00 .00 LVMI LVMI rho=-0.174 P=0.041 rho=-0.172 P=0.043 Nativ e thiol Disulphide/Nativ e thiol Disulphide/T otal thiol Total thiol BMI SDS BMI SDS BMI SDS BMI SDS 550.00 8.00 8.00 7.00 6.00 5.00 4.00 3.00 2.00 6.00 4.00 2.00 600.00 550.00 500.00 450.00 400.00 350.00 300.00 500.00 450.00 400.00 350.00 300.00 250.00 rho=-0.239 P=0.005 rho=0.206P=0.015 rho=0.205 P=0.015 rho=-0.224 P=0.008 15.00 15.00 15.00 15.00 10.00 10.00 10.00 10.00 5.00 5.00 5.00 5.00 .00 .00 .00 .00 -5.00 -5.00 -5.00 -5.00 Nativ e thiol/T otal thiol BMI SDS 95.00 92.50 92.00 87.50 85.00 rho=-0.205 P=0.015 15.00 10.00 5.00 .00 -5.00
Figure 3. Scatter plot figures for correlations analyses of Native Thiol; Total Thiol; and Di-sulphide/Native Thiol, Disulphide/Total Thiol, and Native Thiol/Total Thiol ratios with BMI SDS in study group. Spearman correlation co-efficient was calculated
as that an easy, inexpensive, practical, fully automated, and optionally manual spectrophotometric assay can be utilized to determine plasma dynamic thiol/disulphide homeostasis, which consists of thiol–disulphide exchanges. This method can be eas-ily performed using lower quantities of serum samples, which is a substantial advantage for studies conducted in children (29). Furthermore, its usefulness as a novel and sensitive oxidative stress mediator has been investigated in various diseases (16, 17, 21–24). However, the relationship between thiol/disulphide homeostasis and inflammatory and cardiovascular markers in obese children has not been reported in the literature.
Until now, many studies have evaluated oxidant–antioxidant status, and diverse results have been reported in obese chil-dren. Vehapoğlu et al. (32) found significantly lower total anti-oxidant status and total thiol levels in obese children aged 2–11 years. Karamouzis et al. (33) demonstrated that the loss of the normal homeostatic balance between the oxidant–antioxidant state leads to enhanced oxidative stress combined with a re-duced antioxidant capacity in obese prepubescent and adoles-cent girls. Molnár et al. (34) showed that TAS levels in plasma and α-tocopherol levels were reduced in obese children with metabolic syndrome. Özler et al. (35) reported an impaired thiol/ disulphide homeostasis in obese adolescents with polycystic ovary syndrome. However, some studies have reported that high antioxidant status and increased antioxidant capacity are com-mon in obese children compared with those in normal children, different from our study results. Sfar et al. (36) showed that the activity of antioxidant enzymes was markedly higher in obese children than in normal-weight ones. Different from these re-sults, Brown et al. (37) found that there were no significant dif-ferences in TAS and glutathione levels between normal weight,
overweight, and obese adults. In our study, the thiol/disulphide homeostasis antioxidant parameter levels were low in the obese children, whereas the oxidant parameter levels were higher in these subjects. BMI SDS was positively correlated with thiol/ disulphide oxidant parameters and negatively correlated with antioxidant parameters. This result showed that thiol/disul-phide homeostasis was impaired in obese children, triggering oxidative stress. It also showed that impaired thiol/disulphide homeostasis in obese children was associated with BMI SDS. Specificities of disulphide/native thiol and disulphide/total thiol ratios were high, while sensitivities of these ratios were low in obese group. Sensitivities and specificities of native and total thiol, disulphide levels, and native thiol/total thiol ratio were low. The results of our study were consistent with those reported by studies on obesity and excessive oxidative stress. We believe that thiol/disulphide homeostasis may be a reliable indicator of oxidant–antioxidant status in obese children.
Many studies have reported that oxidative stress was trig-gered by an increase in ROS production due to an increase in the lymphocyte count (5, 38, 39). Positive correlations were observed between lymphocyte count and thiol/disulphide oxidant para- meters in our study, whereas negative correlations were ob-served between lymphocyte count and antioxidant parameters. These results showed an increase in inflammatory markers as-sociated with thiol/disulphide homeostasis in obese children. The presence of low MCV and high WBC, L, and PLT counts and high hs-CRP levels also support the presence of chronic inflam-mation in obese children.
In our study, values of cardiovascular markers such as SBP, EATT, and LVMI were higher in obese group than in control group. There was a positive correlation between cardiovascular mar-
Figure 5. ROC curve for values of Disulphide/Native Thiol and Disulphide/Total Thiol ratios of study groups
AUC - area under curve; CI - confidence interval
Sensitivity Sensitivity
ROC curve ROC curve
1 - Specificity 1 - Specificity
Optimum AUC 95% CI P Sensitivity Specificity
cut-off Lower Upper value (%) (%)
Disulphide native thiol (%) 4.973 0.641 0.550 0.732 0.004 42 83
Disulphide total thiol (%) 4.582 0.641 0.550 0.732 0.004 39 85
1.0 1.0 0.8 0.8 0.6 0.6 0.4 0.4 0.2 0.2 0.0 0.0 1.0 1.0 0.8 0.8 0.6 0.6 0.4 0.4 0.2 0.2 0.0 0.0
tion of thiol/disulphide homeostasis antioxidant parameters with BMI SDS and LVMI. Our results suggest that as BMI SDS values increase, the cardiovascular markers deteriorate, and this may be related to impairment of thiol/disulphide homeostasis. Even-tually, the thiol/disulphide homeostasis may be a new biomarker that mediates the cardiovascular effects of chronic inflamma-tion in obese children.
Study limitations
The major limitation of this case-control study was the rela-tively small number of participants. Another limitation of our study was the lack of evaluation of other inflammatory markers and cardiovascular risk factors. Furthermore, thiol/disulphide parameters were not compared with other enzymatic and non-enzymatic oxidative stress parameters.
Conclusion
In this study, we demonstrated that thiol/disulphide homeo-stasis, which is one of the important parameters of oxidative stress, was impaired in obese children. This impairment was strongly associated with increased inflammation in obesity. In addition, cardiovascular involvement may have contributed to the impairment of this homeostasis. Our study provided insight into these issues, but further in-depth studies are still required.
Conflict of interest: None declared. Peer-review: Externally peer-reviewed.
Authorship contributions: Concept – B.E., M.Kösecik., P.D., M.K., P.İ., C.B.; Design – B.E., M.Kösecik, P.D., M.K., P.İ., C.B.; Supervision – B.E., M.Kösecik, P.D., M.K., P.İ., C.B.; Materials – B. E.; P. D., M.Kösecik., C.B.; Data collection &/or processing – B.E., P.D., P.i.; Analysis and/or inter-pretation – B.E., C.B., P.D., M.K.; Literature review – B.E., M.K.; Writer – B.E., M.Kösecik; Critical review – B.E., M.Kösecik, P.İ.
References
1. Vos MB, Welsh J. Childhood obesity: update on predisposing fac-tors and prevention strategies. Curr Gastroenterol Rep 2010; 12: 280-7. [CrossRef]
2. Boisvert JA, Harrell WA. Integrative treatment of pediatric obesity: psychological and spiritual considerations. Integr Med (Encinitas) 2015; 14: 40-7.
3. Llewellyn A, Simmonds M, Owen CG, Woolacott N. Childhood obe-sity as a predictor of morbidity in adulthood: a systematic review and meta-analysis. Obes Rev 2016; 17: 56-67. [CrossRef]
4. Bahadır A, Baltacı D, Türker Y, Türker Y, Iliev D, Öztürk S, et al. Is the neutrophil-to-lymphocyte ratio indicative of inflammatory state in patients with obesity and metabolic syndrome? Anatol J Cardiol 2015; 15: 816-22. [CrossRef]
5. Inzaugarat ME, Billordo LA, Vodánovich F, Cervini GM, Casavalle PL, Vedire C, et al. Alterations in innate and adaptive immune
leuko-90. [CrossRef]
6. Rabkin SW. Epicardial fat: Properties, function and relationship to obesity. Obes Rev 2007; 8: 253-61. [CrossRef]
7. Chinali M, de Simone G, Roman MJ, Lee ET, Best LG, Howard BV, et al. Impact of obesity on cardiac geometry and function in a popula-tion of adolescents: The Strong Heart Study. J Am Coll Cardiol 2006; 47: 2267-73. [CrossRef]
8. Mehta SK, Holliday C, Hayduk L, Wiersma L, Richards N, Younoszai A. Comparison of myocardial function in children with body mass indexes >/=25 versus those <25 kg/m2. Am J Cardiol 2004; 93:
1567-9. [CrossRef]
9. Gidding SS, Nehgme R, Heise C, Muscar C, Linton A, Hassink S. Severe obesity associated with cardiovascular deconditioning, high prevalence of cardiovascular risk factors, diabetes mellitus/ hyperinsulinemia, and respiratory compromise. J Pediatr 2004; 144: 766-9. [CrossRef]
10. Zoair AM, Muhammada KT, Abu-Ammob DE, Motaweaa MM. Lipid profile and some cardiac functions in children with obesity. Egyp-tian Pediatric Association Gazette 2013; 61: 15-22. [CrossRef]
11. Daniels SR, Kimball TR, Morrison JA, Khoury P, Meyer RA. Index-ing left ventricular mass to account for differences in body size in children and adolescents without cardiovascular disease. Am J Cardiol 1995; 76: 699-701. [CrossRef]
12. Wildman RP, McGinn AP, Lin J, Wang D, Muntner P, Cohen HW, et al. Cardiovascular disease risk of abdominal obesity vs. metabolic abnormalities. Obesity (Silver Spring) 2011; 19: 853-60. [CrossRef]
13. Burke V. Obesity in childhood and cardiovascular risk. Clin Exp Pharmacol Physiol 2006; 33: 831-7. [CrossRef]
14. Codoñer-Franch P, Valls-Bellés V, Arilla-Codoñer A, Alonso-Iglesias E. Oxidant mechanisms in childhood obesity: the link between in-flammation and oxidative stress. Transl Res 2011; 158: 369-84. 15. O'Rourke RW, White AE, Metcalf MD, Olivas AS, Mitra P, Larison
WG, et al. Hypoxia-induced inflammatory cytokine secretion in hu-man adipose tissue stromovascular cells. Diabetologia 2011; 54: 1480-90. [CrossRef]
16. Altıparmak IH, Erkuş ME, Sezen H, Demirbağ R, Günebakmaz O, Kaya Z, et al. The relation of serum thiol levels and thiol/disulphide homeostasis with the severity of coronary artery disease. Kardiol Pol 2016; 74: 1346-53. [CrossRef]
17. Kundi H, Ateş I, Kızıltunç E, Çetin M, Çiçekçioğlu H, Neşelioğlu S, et al. A novel oxidative stress marker in acute myocardial infarction; thiol/disulphide homeostasis. Am J Emerg Med 2015; 33: 1567-71. 18. Kızıltunç E, Gök M, Kundi H, Çetin M, Topçuoğlu C, Gülkan B, et
al. Plasma thiols and thiol-disulfide homeostasis in patients with isolated coronary artery ectasia. Atherosclerosis 2016; 253: 209-13. 19. Kundi H, Gök M, Çetin M, Kızıltunç E, Topçuoğlu C, Neşelioğlu S, et al. Association of thiol disulfide homeostasis with slow coronary flow. Scand Cardiovasc J 2016; 50: 213-7. [CrossRef]
20. Ateş I, Kaplan M, İnan B, Alışık M, Erel O, Yılmaz N, et al. How does thiol/disulfide homeostasis change in prediabetic patients? Diabe-tes Res Clin Pract 2015; 110: 166-71. [CrossRef]
21. Ateş I, Kaplan M, Yüksel M, Meşe D, Alışık M, Erel Ö, et al. Deter-mination of thiol/disulphide homeostasis in type 1 diabetes mellitus and the factors associated with thiol oxidation. Endocrine 2016; 51: 47-51. [CrossRef]
22. Babaoğlu E, Kılıç H, Hezer H, Dağ O, Parlak E, Şentürk A, et al. Com-parison of thiol/disulphide homeostasis parameters in patients with COPD, asthma and ACOS. Eur Rev Med Pharmacol Sci 2016; 20: 1537-43.
23. Gümüşyayla S, Vural G, Bektaş H, Deniz O, Neşelioğlu S, Erel O. A novel oxidative stress marker in patients with Alzheimer's disease: dynamic thiol-disulphide homeostasis. Acta Neuropsychiatr 2016; 28: 315-20. [CrossRef]
24. Özler S, Erel O, Öztaş E, Ersoy AO, Ergin M, Sucak A, et al. Serum thi-ol/disulphide homeostasis in preeclampsia. Hypertens Pregnancy 2015; 34: 474-85. [CrossRef]
25. Bundak R, Furman A, Günoz H, Darendeliler F, Bas F, Neyzi O. Body mass index references for Turkish children. Acta Paediatr 2006; 95: 194-8. [CrossRef]
26. Cole TJ, Bellizzi MC, Flegal KM, Dietz WH. Establishing a standard definition for child overweight and obesity worldwide: international survey. BMJ 2000; 320: 1240-3. [CrossRef]
27. Lang RM, Bierig M, Devereux RB, Flachskampf FA, Foster E, Pellik-ka PA, et al. Chamber Quantification Writing Group.; American So-ciety of Echocardiography's Guidelines and Standards Committee.; European Association of Echocardiography. Recommendations for chamber quantification: a report from the American Society of Echocardiography's Guidelines and Standards Committee and the Chamber Quantification Writing Group, developed in conjunction with the European Association of Echocardiography, a branch of the European Society of Cardiology. J Am Soc Echocardiogr 2005; 18: 1440-63. [CrossRef]
28. Iacobellis G, Ribaudo MC, Zappaterreno A, Iannucci CV, Leonetti F. Relation between epicardial adipose tissue and left ventricular mass. Am J Cardiol 2004; 94: 1084-7. [CrossRef]
29. Erel O, Neşelioğlu S. A novel and automated assay for thiol/disul-phide homeostasis. Clin Biochem 2014; 47: 326-32. [CrossRef]
30. Marseglia L, Manti S, D'Angelo G, Nicotera A, Parisi E, Di Rosa G, et al. Oxidative stress in obesity: a critical component in human diseases. Int J Mol Sci 2014; 16: 378-400. [CrossRef]
31. Tavakoli S, Asmis R. Reactive oxygen species and thiol redox sig-naling in the macrophage biology of atherosclerosis. Antioxid Re-dox Signal 2012; 17: 1785-95. [CrossRef]
32. Vehapoğlu A, Türkmen S, Göknar N, Özer ÖF. Reduced antioxidant capacity and increased subclinical inflammation markers in pre-pubescent obese children and their relationship with nutritional markers and metabolic parameters. Redox Rep 2016; 21: 271-80. 33. Karamouzis I, Pervanidou P, Berardelli R, Iliadis S, Papassotiriou I,
Karamouzis M, et al. Enhanced oxidative stress and platelet activa-tion combined with reduced antioxidant capacity in obese prepu-bertal and adolescent girls with full or partial metabolic syndrome. Horm Metab Res 2011; 43: 607-13. [CrossRef]
34. Molnár D, Decsi T, Koletzko B. Reduced antioxidant status in obese children with multimetabolic syndrome. Int J Obes Relat Metab Disord 2004; 28: 1197-202. [CrossRef]
35. Özler S, Öztaş E, Tokmak A, Ergin M, İşçi E, Eren F, et al. The as-sociation of thiol/disulphide homeostasis and lipid accumulation index with cardiovascular risk factors in overweight adolescents with polycystic ovary syndrome. Clin Endocrinol (Oxf) 2016; 84: 516-23. [CrossRef]
36. Sfar S, Boussoffara R, Sfar MT, Kerkeni A. Antioxidant enzymes ac-tivities in obese Tunisian children. Nutr J 2013; 12: 18. [CrossRef]
37. Brown LA, Kerr CJ, Whiting P, Finer N, McEneny J, Ashton T. Oxi-dant stress in healthy normal-weight, overweight, and obese indi-viduals. Obesity (Silver Spring) 2009; 17: 460-6. [CrossRef]
38. Harrison DG, Gongora MC. Oxidative stress and hypertension. Med Clin North Am 2009; 93: 621-35. [CrossRef]
39. De Ciuceis C, Agabiti-Rosei C, Rossini C, Airò P, Scarsi M, Tincani A, et al. Relationship between different subpopulations of circula- ting CD4+ T lymphocytes and microvascular or systemic oxidative stress in humans. Blood Press 2017: 1-9.