Social Sciences
Volume 14 Issue 5, 2019, p. 2411-2430 DOI: 10.29228/TurkishStudies.37024
ISSN: 2667-5617 Skopje/MACEDONIA-Ankara/TURKEY
Research Article / Araştırma Makalesi A r t i c l e I n f o / M a k a l e B i l g i s i
Received/Geliş: 13.09.2019 Accepted/Kabul: 15.10.2019 Report Dates/Rapor Tarihleri: Referee 1 (10.10.2019)-Referee 2 (10.10.2019)- Referee 3 (10.10.2019)- Referee 4 (11.10.2019)
This article was checked by iThenticate.
KAMU SAĞLIK PERSONELİNİN FARKLILIKLARIN YÖNETİMİNE İLİŞKİN ALGILARININ DEMOGRAFİK
ÖZELLİKLER AÇISINDAN İNCELENMESİ
Nurten POLAT DEDE*
ÖZ
Sağlık kuruluşlarında bilhassa hastanelerde, istihdam edilen işgücünün sahip olduğu bireysel ve kültürel özelliklerinin toplumdaki farklılıkları yansıtması gerekmektedir. Farklı özelliklere sahip sağlık çalışanlarının, hastaların farklı ihtiyaç taleplerini daha iyi anlayacağı ve daha fazla hasta memnuniyeti sağlayacağı düşünülmektedir. Ancak Farklılıkların etkin yönetimi, farklı özelliklere sahip kişileri yönetebilmek için üst yönetim taahhüdü ve bir takım organizasyonel sistemlerin planlanması ve yaşama geçirilmesini gerektirmektedir.
Bu araştırma; kamuya bağlı sağlık kurumlarında çalışanların, farklılıkların yönetimi hakkındaki algılamalarını, demografik özelliklerine göre belirlemeyi amaçlamaktadır. Bu amaçla kamuya bağlı sağlık kurumlarında yönetici ve çalışan pozisyonundaki personele, farklılıkların yönetimi hakkındaki algılamalarını tespit etmek için anket uygulanmıştır. Araştırmanın verileri Balay ve Sağlam (2004) tarafından geliştirilen Farklılıkların Yönetimi Ölçeği’nin tek faktörlü hali kullanılarak elde edilmiştir. Veriler SPSS 25 istatistik paket programı kullanılarak analiz edilmiştir. Bu araştırma sonucunda; kurumdaki pozisyonu yönetici statüsünde olan personelin, çalışan statüsündeki personele göre farklılık yönetimi hakkındaki algılamalarında daha olumlu oldukları tespit edilmiştir. Diğer demografik değişkenler olan kurumdaki görev, cinsiyet, yaş, öğrenim durumu ve meslekteki toplam hizmet süresi değişkenlerinin farklı grupları için farklılık yönetimi hakkındaki algılamada gruplar arasında anlamlı bir fark tespit edilememiştir. Kamu sağlık personelinin farklılık yönetimi hakkındaki algılamalarını artırmaya yönelik; farklılık, farklılık yönetimi gibi
konularda personele eğitim verilmesi, seminer ve kurslarla konu hakkındaki bilgilerinin artırılmasıyla, personelin iş doyumu ve motivasyon seviyelerinin yükselmesi sağlanabilir.
Anahtar Kelimeler: Farklılık, İnsan Kaynakları Yönetimi, Farklılık
Yönetimi, Farklılık Yönetimi Algılamaları.
INVESTIGATION OF THE PERCEPTIONS OF PUBLIC HEALTH STAFF ON THE DIVERSITY MANAGEMENT IN TERMS OF
DEMOGRAPHIC CHARACTERISTICS ABSTRACT
The individual and cultural characteristics of the workforce employed in health institutions, especially in hospitals, should reflect differences in society. It is thought that health professionals with different characteristics will better understand different needs of patients and provide more patient satisfaction. However, effective diversity management requires the commitment of senior management and the planning and implementation of a number of organizational systems to manage people with different characteristics all together.
This research aims to determine the perceptions of employees in public health institutions about the diversity management according to their demographic characteristics. For this purpose, a questionnaire was applied to the managers and employees in public health institutions to determine their perceptions about the diversity management. The data of the study were obtained by using the single factor version of the Diversity Management Scale developed by Balay and Sağlam (2004). Data were analyzed using SPSS 25 statistical package program. As a result of this research, it has been found that the personnel who have administrative status in the institution are more sensitive in their perceptions about the diversity management than the personnel in the status of employees. There was no significant difference between the groups in terms of perception of diversity management for different groups of variables such as task, gender, age, educational status and total tenure of employment in the profession. In order to increase the perception of public health personnel about diversity management, by providing training to the personnel on issues such as diversity, diversity management, and increasing the knowledge about the subject through seminars and courses, it is possible to increase the job satisfaction and motivation levels of the personnel.
STRUCTURED ABSTRACT
The spread of multinational business understanding with globalization made it inevitable for companies to do business with individuals from different societies. Diversity, multiculturalism and demographic differences resulting from globalization and changes in the way doing business have turned into issues that societies are sensitive to at the international level. Similarly, the issue has become important for enterprises to be dealt with in senior management decisions. Diversity
management is a set of policies, strategies and activities designed to strengthen intra-organizational communication, focusing on positive actions for the future of the organization, where the differences and similarities of the organization are accepted together.
The aim of this research is to find out the perceptions of employees in public health institutions about the diversity management according to their demographic characteristics. For this purpose, a questionnaire was carried out to the managers and employees who serve in public health institutions to define their perceptions about the diversity management.
Doctors, nurses (midwives), health officers and emergency medical technicians/laborers working in public hospitals and private hospitals are the main population in the study. Doctors, nurses (midwife), health officers and emergency medical technicians / laboratory assistants working in public hospitals in Dinar district of Afyonkarahisar, Gölhisar district of Burdur and Burhaniye district of Balıkesir are the samples in question. In the scope of the research, 323 people were interviewed, 244 of the questionnaires were collected, 227 completed totally of the collected ones were put into analysis. 13 people were in the administration position, 214 people were workers. 26 of the participants were doctor, 129 of them were nurse (midwife), 42 of them were health officer and 30 of them were laboratory assistants/emergency medical technicians.
The importance of the research will stand out more and more as diversity management of the employees who work in health sector which includes a lot of diversity in the demographic sense are defined. Diversity management can influence many factors such as job productivity, job loyalty and ability to do business together among workers and managers who work in this sector.
The data of the study were obtained by using the single factor version of the Diversity Management Scale developed by Balay and Sağlam (2004). The research includes a questionnaire which consists of two parts. In the first part, six questions are included to determine the demographic characteristics, and in the second part, twenty-eight questions appear with a 5-point Likert scale to measure the perceptions of employees about the diversity management. (1) completely disagree, (2) disagree, (3) neither agree nor disagree, (4) agree, (5) completely agree are the scales.
Whether the perceptions of employees in public health institutions about the diversity management according to their demographic characteristics is the research hypotheses. On the base of the purpose of the study and the aforementioned explanations, following hypotheses have been established.
HGender(1): Perceptions of participants about diversity management differ according to their gender.
HAdministrative status in the organization(2): Perceptions of participants about diversity management differ according to their status in the organization.
HTask in the organization(3): Perceptions of participants about diversity management differ according to their tasks in the organization.
HAge(4): Perceptions of participants about diversity management differ according to their age.
HEducation level(5): Perceptions of participants about diversity management differ according to their education level.
HEmployement tenure(6): Perceptions of participants about diversity management differ according to employment tenure.
Data were analyzed using SPSS 25 statistical package program. As a result of the analysis, there was a significant difference between the perceptions about the diversity management between the personnel in the administrative position and the personnel in the employee position. In this respect, the H2 hypothesis is supported. The perceptions of the
personnel in the administrative position about the diversity management are more positive than the ones in the employee position. While managers think that differences are well managed and differences between employees are not a problem in the organization, other employees disagree. For other different groups of demographic variables, perceptions of diversity management do not differ. Regardless of all their demographic characteristics such as education level, gender, task, age and employment tenure, they did not think different about the diversity management. According to these results, H1, H3, H4, H5, H6 hypotheses is
not supported in our study. The results obtained in this study are similar to those of Fettahlıoğlu and Tatlı (2015), Memduhoğlu (2007) and Öncer (2004).
It has been determined that there is a statistically significant difference between the perceptions on diversity management of the personnel who have administrative duties and those who do not have in public health institutions. The scores of the participants' perceptions on diversity management show a significant difference between employees with and without management duties in their organizations (t (2-225) = 5.158, p<.001). When the t-test results related to the scores obtained from the diversity management scale (DMS) according to the position in the institution were taken into consideration, the mean scores of the perceptions of managers about the diversity management () 4.05 were found to be higher than the average scores of the perceptions of the employees about the diversity management() 2.91. The more positive opinions of managers about the diversity management practices of their organizations may arise from the instinct of self-protection of these individuals because of their administrative duties. Managers may want to show that policies, practices and attitudes regarding differences in their organizations are better. However, they may perceive their practices and attitudes towards differences in their organizations as more positive. It is intriguing that descriptive statistical mean values in the diversity management scale in the study are moderate in all employees except managers. From an optimistic point of view, the fact that employees have relatively lower averages to managers in the health care institutions where the research is conducted may be due to the lack of knowledge about the diversity management policies and practices of employees' organizations. Therefore, it should not be overlooked by managers that providing awareness-based diversity management
trainings to staff may have positive effects on the perception of personnel about the diversity management.
The fact that managers are consulting on all kinds of issues, especially health issues with the personnel working in the institution will remind them that they are always important. An organizational culture that supports differences within the organization should be created to strengthen the feelings of friendship of the staff with each other. All kinds of training programs of the personnel of the institution should be supported with scientific data. The personnel should be directed to the educational activities by the management for development in addition to the personal training requests. It should be ensured that the employees are turned into experts in the fields of diversity management with vocational training programs.
Keywords: Diversity, Human Resources Management, Diversity
Management, Diversity Management Perceptions.
1. Introduction
The issue of diversity management began to gain importance after the demarcation of the borders between the countries with the effect of globalization (Ozgener, 2008; Wentling, 2004). Diversity management, which at first seemed to be the countries own internal policies, has become a subject of concern for all countries with the effect of globalization including components such as communication, technology and trade. In the business world, companies operating in international markets have had to develop organizational policies and systems in relation to employees from different cultures in different countries (Shen, Chanda, D'Netto and Monga, 2009).
Today the issue of diversity management is being discussed in terms of sustainability (Byrd, 2018; Esen and Esen 2018; Lee, 2019; Özgül and Gürol, 2019), diversity and inclusion (Goswami and Goswami 2018; Jordan, Ferris and Lamont, 2019) and their economic consequences (Ottaviano and Peri 2006). Diversity management is one of the indispensable human resources strategies of all types of businesses globally and locally (Shen et al., 2009). The diversity occurring in organizations with globalization succeeds to keep these diversities in the workforce together and concerns about the continuity of the organization is reflected in the literature (Edwards and Kelan, 2011).
Turkey met the concept of diversity management through multinational companies similarly to other developing countries (Ozgener, 2008). The concept maintains its importance in terms of increasing the diversity of labor force in public institutions and creating inclusive organization culture and diversity management (Rice and Arekere, 2005). One of these public institutions is the health sector that needs diversity of labor and inclusive organizational systems most to improve the quality of service (Glazer, Tobias and Mentzel, 2018; West at al., 2018; Winkfield and Gabeau, 2013).
2. Literature Research
2. 1. Definitions about Diversity and Diversity Management
While the definitions made in the preliminary studies on the concept of diversity emphasize the sociological dimension in general, human resources dimension has come to the forefront in the definitions in the field of business administration (Shen et al., 2009). Many definitions of diversities have been made by reconciling the concept of diversity with the understanding of human resources.
Cox (1994) described the representation of people belonging to a culturally diverse group as a diversity in any system. Williams and O'Reilly III., (1998) on the other hand, considered the scope of
diversity quite broadly by describing the concept as “...any feature that can be used to express individual differences of a person…”. Similarly, according to Barutçugil (2004: 227), the differences are identified in a broad manner that includes many elements from personality, religion, nationality, gender and socio-economic characteristics to physical characteristics, working styles and personal gains such as experience and education.
The definition of the diversity, which is an important phenomenon for companies and employees, in the Turkish Language Institution dictionary is: “It is a feature that distinguishes every natural and socially based event and phenomenon from all others” (Türk Dil Kurumu, 2019).
Düren (1999 cited Ünalp 2007: 68) described the diversity management as “People coming from different nations and cultures create a common culture where they can work together comfortably”. In the definition of Düren’s diversity management, it can be seen that an emphasis on the difference stemmed from person’s nation and culture.
The diversity management can be defined as the whole of the activities designed in a conscious and systematic way to strengthen intra-organizational communication, focused on positive actions towards the future of the organization, where the differences and similarities of the organization are accepted together.
Effective diversity management requires the commitment of senior management and the planning and implementation of a number of organizational systems to manage people with different characteristics all together (D’Netto, Shen, Chelliah and Monga, 2014). Efficient installation of systems and support by senior management (Agars and Kottke, 2004) is important in terms of minimizing the problems while maximizing the benefits that the differences between employees can bring. Furthermore, an inclusive organizational culture that recognizes and accepts the differences between individuals should be established within the company (Cox, 1994; McKay, Avery, Tonidandel, Morris, Hernandez and Hebl, 2007). Effective management of diversities in companies can help employees communicate and develop cooperation more easily and improve employee’s organizational commitment (Barutçugil, 2004). In fact, in a study, it was found that employees' perception of diversity management had a positive effect on organizational commitment and a negative effect on intention to quit. (Bulşu, 2017)
In the definition of diversity management, the researchers state that the differences are a matter of management and that the organization is successful or unsuccessful based on senior executive commitments (Barutçugil, 2004; Sürgevil, 2010).
2. 2. Understanding the Diversities
In recent years, the diversity management in the struggles of companies to improve and protect their image in the public eye is expressed as one of the most powerful human resources strategies used by firms (Kochan et al., 2003). In addition, it is stated by some authors that the integration of diversity and inclusion into business strategies will strengthen the employer brand of firms and increase their performance (Point and Singh, 2003; Yagi, 2017). Some researchers argue that the concepts of diversity and employer branding have inherent contradictions because of their nature (Edwards and Kelan, 2011). Today, companies need to design effective management systems that can transform the differences in labor force into competitive advantage due to sectoral and organizational factors, business strategies, innovative practices of competitors, legal regulations, social responsibility activities and meeting customer needs (D’Netto et al., 2014; Point and Singh, 2003).
In the past, the issue of diversity management for many companies was about meeting legal requirements. They assumed the responsibility to involve women, minorities, the disabled and the elderly in the labor force in order not to contradict existing laws (Keil et al., 2007). In case of problems, it was in the form of reactive solutions after the problem. Recent studies reveal positive findings between
creativity and differences (Polat Dede, 2019). According to Keil et al. (2007), differentiation of the labor force can increase the effectiveness of the company in achieving its goals and objectives. In this way, employee morale and motivation can be increased. New markets can be reached more quickly. All of these impacts can increase productivity and profit. These potential benefits of differences for companies, if not well managed and ignored, can lead to major losses within the company and irreversible losses. For this reason, the issue of diversity management should be carefully considered and understood.
Today, with the development of fundamental rights and freedoms, it is thought and defended that human life is a whole, that it cannot be democrat in social life and anti-democrat in business life. However, the inhabitants of the European Union complain that their differences in ethnicity, religion, disability, etc., even though their merits are equal, are an obstacle to them (Akın and Yavaşi, 2007). In order to break this prejudice, every organization needs a diversity management that operates very well. Organizations that best explain the effectiveness and accuracy of diversity management programs to their potential employees will always be the preferred places of the most popular personnel of the workforce and will achieve this success more quickly and easily.
“…The unique qualities of human resources in enterprises also make it difficult to manage human resources. Therefore, the main factor that will determine the effectiveness of leaders will be to understand and direct the effectiveness of human resources.” (Yazıcı, 2001). Especially in high power distance and collectivist societies such as Turkey, because of the high-level commitment of employees to the managers, administrators have a decisive impact on employee behavior (Ece and Gültekin, 2018). According to these expressions, the challenges that the leader and the managers might encounter in diversity management have been emphasized.
Managing people with similar cultures, personality, beliefs, values and judgments has a number of advantages. However, it is important for the effectiveness of enterprises to manage the employees who have differences despite all their difficulties, to gather them around a common purpose and to manage the possible conflicts effectively. Ignoring the differences in the labor force and trying to standardize all employees will create a problematic organization and labor force for the managers and will disturb the peace of the organization. Organizations that offer equal opportunities to their employees will see differences as a value and can benefit from these differences to gain competitive advantage (Tozkoparan and Vatansever, 2009). Ignoring differences can negatively affect the ability of organizations to work or cause the organization to disappear completely. Because dealing with conflicts will partially or completely prevent the organization from reaching its main goal (Jehn and Mannix, 2001). Diversity management, which is the way to prevent conflicts, will bring organizations to their goals and ensure that other organizations are one step ahead.
2. 3. Dimensions of Diversity
There are two main approaches in the literature regarding the grouping of diversity dimensions. One of them is the “factor approach”, which deals with the definition and measurement of different types of diversities and takes into account “factors”. The second approach is the “proportions approach”, which aims to determine the proportion of minorities within the majority members. This approach assumes that diversities in dimensions may vary and therefore focuses on proportions (Mannix and Neale, 2005).
2. 3. 1. Factor approaches
Differences are classified under two dimensions in the literature by some researchers. According to the researchers' point of view and research aims, these two dimensions seem to have different names. For example (Gümüş, 2009; Hubbard, 2004; Mannix and Neale 2005; Milliken and Martins, 1996):
Superficial difference - profound difference
Work-related diversity-non-work-related diversity
Task-related diversity-relationship-oriented diversity
Role-related difference-hereditary diversity
As categorized above, there are researchers who use “two-factor diversity dimension” as well as those who adopt “multi-factor approaches by developing more inclusive dimensions. However, in the literature, it is seen that the two-factor diversity dimensions are commonly classified on the basis of non-changeable differences (primary dimension) and changeable differences (secondary dimension). It is classified under two dimensions as primary and secondary (Hubbard, 2004):
The primary dimension is an innate, unchangeable basic characteristic that manifests itself in
every stage of human life. They are the basic qualities that determine the way of perceiving the person and the social life between him and the people around him. These diversities are basically; age, ethnicity, physical characteristics, sexual orientation, gender, race.
The secondary dimension includes the characteristics of the person's preference, which people
can modify. These characteristics are diversities that cannot be easily noticed by the environment, which may occur over time and directly affect one's self-confidence. For example, characteristics related to status such as education level, geographical region, income level, marital status.
2. 3. 2. Proportional approaches
In this approach, the groups are classified by considering the minority-majority ratio within the group. The approach has several deficiencies since it focuses on a single feature that differentiates people such as gender, race and religion (Mannix and Neale 2005).
2. 4. Demographic Variables and Diversity Management Perception
In previous studies, it was found that having different demographic characteristics changed employees' perception of diversity management.
Öncer (2004) found that employees' perceptions of diversity management did not change according to demographic characteristics such as age, gender and education level. Memduhoğlu (2007) found that there are no statistically significant differences in the perception of diversity management according to the demographic characteristics of high school principals, assistant principals and teachers. Diversity management perceptions in the study consist of three dimensions. These three sub-dimensions are; (i) perceptions of managers and teachers about differences on individual attitudes and behaviors of employees, (ii) perceptions of managers and teachers about organizational values and norms related to differences, (iii) perceptions of managers and teachers about managerial practices and policies towards differences. According to the results of the study, the perceptions of managers and teachers about differences in terms of individual attitudes and behaviors did not change according to gender, age, education level, branch, professional seniority (total term of service) and seniority. As a similar result, there was no difference in the perceptions of managers and teachers about organizational values and norms related to differences according to demographic variables. Finally, in terms of perceptions of managerial practices and policies, perceptions of administrators and teachers about differences did not change according to gender, age, education level, branch, professional seniority (total service period) and seniority of management. However, differences have been identified in the perception of diversity management of principals, deputy principals and non-administrative teachers.
Fettahlıoğlu and Tatlı (2015) found that employees' belonging to different genders did not change their perception of diversity management in their studies. According to the results of the
research, no difference was found between marital status differences and perceptions of diversity management. Similarly, there were no differences in employees' perception of diversity management even if they have different education levels, belong to different age groups, and have different experience periods. Moreover, in the study conducted by Meteroğlu (2015) in educational institutions, no difference was detected in teachers' perception of diversity management according to age and gender. On the other hand, some researchers have reached discordant results with the findings of Öncer (2004), Memduhoğlu (2007), Fettahlıoğlu and Tatlı (2015) and Meteroğlu (2015). For example, Balyer and Gündüz (2010) found significant differences in the managerial practices and policies sub-dimension of teachers' perceptions of diversity management according to gender variable. Şahin (2015) concluded that in terms of their perceptions of managerial practices and policies, male teachers' perceptions of diversity management were more positive than female teachers. Şahin (2015) also found differences among teachers' perceptions of diversity management according to age groups. According to the results of this study, it is stated that teachers' perceptions about the diversity management increase with age. Karademir, Çoban, Devecioğlu, Karakaya and Yücel (2012) found differences between age groups and diversity management perceptions.
Şahin (2015) found that teachers' perceptions about the diversity management increased according to seniority, but this difference was not statistically significant. Balyer and Gündüz (2010) found that there is a statistical difference in the level of managerial practices and policies sub-dimension of teachers' perception levels related to the diversity management.
3. Research Objective and Significance
Organizations are increasingly attaching importance to developing policies to use individual differences as a competitive advantage (Balay and Sağlam, 2004). This research aims to determine whether diversity management perceptions of public sector health workers have changed according to demographic characteristics such as position in the institution (having management duties), current duty (doctors, nurses, health officers and emergency medical technicians / laboratory technicians), gender, age, educational status and total service time.
The importance of the study will become more evident with the determination of the perceptions of employees regarding diversity management in health sector which is demographically diverse; as their perceptions may affect many factors such as job productivity, organizational commitment, creative thinking, innovative business behaviors and increasing their ability to do business together.
4. The Population and Sample of the Research
The main population of the study consists of doctors, nurses, health officers and emergency medical technicians / laborers working in public hospitals and private hospitals. The sample of the study consists of doctors, nurses, health officers and emergency medical technicians / laborants working in public hospitals in Dinar, district of Afyonkarahisar, Gölhisar, district of Burdur and Burhaniye, district of Balıkesir. In the scope of the research, 323 people were interviewed, 244 of the questionnaires were collected and 227 of them were filled in completely and subjected to statistical analysis as the sample of the research. 13 people from the management position and 214 people from the employee position participated in the study. 26 of the participants were doctor, 129 of them were nurse (midwife), 42 of them were health officer and 30 of them were laborants / emergency medical technicians.
5. Data Collection Tool
The data to be used in the study were obtained through a questionnaire study using the diversity management scale developed by Balay and Sağlam (2004). The questionnaire, which was developed primarily to measure the perceptions of education employees about the diversity management, was re-adapted to measure the perceptions of health sector employees about same subject.
The questionnaire used in the research consists of two parts. In the first part, there are six questions to determine the demographic characteristics, and in the second part, there are twenty-eight questions with a 5-point Likert scale to measure the perceptions of employees about the diversity management. The scale consisted of (1) completely disagree, (2) disagree, (3) neither agree nor disagree, (4) agree, (5) completely agree.
6. Introducing the Diversity Management Scale
The Diversity Management Scale (DMS) was developed by Balay and Sağlam (2004: 39-44) as a questionnaire to create a valid and reliable measurement tool that can be used to measure employees' perceptions of diversity management in educational organizations. The authors tried to determine the applicability of the three-factor DMS scale (individual behaviors and attitudes, organizational values and norms, managerial practices and policies) as single-factor, hence the variance values of the items of the scale were examined. It was determined that the single-factor variance value of the scale was 41.7% and it was stated that the scale could be used as a single factor as well by emphasizing that the variance value of the single-factor scales as 30% and more was sufficient. In this study, the DMS scale was used as a single factor because of its ease of use as it was stated by the authors.
7. Research Model
In our study, it was tested whether the perceptions of health workers about diversity management differed for different groups of demographic variables such as position in the organization, task in the organization, gender, age, education level and total employment tenure in the profession. In this case, the research model can be shown as follows:
8. Hypothesis of the Research
On the base of the purpose of the study and the aforementioned studies, following hypotheses have been established:
HGender(1): Perceptions of participants about diversity management differ according to their
gender.
HAdministrative position in the organization(2): Perceptions of participants about diversity management differ
according to their positions in the organization.
HTask in the organization(3): Perceptions of participants about diversity management differ according
to their tasks in the organization.
HAge(4): Perceptions of participants about diversity management differ according to their age.
Position
Education level
Age
Task
Gender
Employment
tenure
Perception about the
diversity
HEducation level(5): Perceptions of participants about diversity management differ according to their
education levels.
HTenure(6): Perceptions of participants about diversity management differ according to their
employment tenure.
9. Findings
The data obtained from the research were analyzed using SPSS 25 package program. The questionnaire used in the analysis consists of twenty-eight questions asked with a 5-point Likert scale. Six demographic questions were asked, as well. In this section, the results tables related to the conducted analyses were obtained and those results were interpreted.
9.1. Statistics on Demographic Variables
Frequency values related to demographic information of the participants were given in Table 1 below.
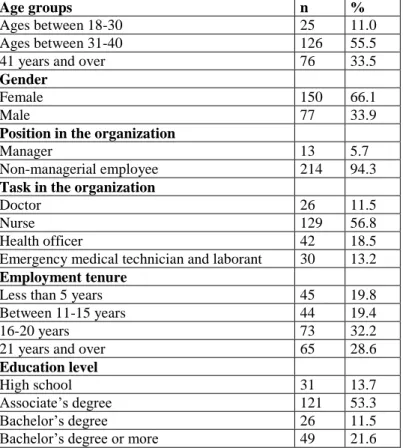
Table 1: Number and Frequency Values of Demographic Variable Groups of Participants
Age groups n %
Ages between 18-30 25 11.0
Ages between 31-40 126 55.5
41 years and over 76 33.5
Gender
Female 150 66.1
Male 77 33.9
Position in the organization
Manager 13 5.7
Non-managerial employee 214 94.3
Task in the organization
Doctor 26 11.5
Nurse 129 56.8
Health officer 42 18.5
Emergency medical technician and laborant 30 13.2
Employment tenure
Less than 5 years 45 19.8
Between 11-15 years 44 19.4
16-20 years 73 32.2
21 years and over 65 28.6
Education level
High school 31 13.7
Associate’s degree 121 53.3
Bachelor’s degree 26 11.5
Bachelor’s degree or more 49 21.6
As a result of the research conducted with 227 people, the values related to the demographic variable groups are as shown in the table above. 150 of the participants (66.1%) and 77 (33.9%) were male. In addition, of all participants involved in the research, 13 individuals (5.7%) were employed in the managerial position and 214 (94.3%) were in the position of non-managerial employee. When we look at the occupational groups of the participants, there are 26 doctors (11.5%), 129 nurses (56.8%), 42 health officers (18.5%), and 30 emergency medical technicians and labs (13.2%). For the different age groups of the participants, 25 are between the ages of 18-30 (11.0%), 126 are between the ages of 31-40 (55.5%) and 76 are 41 and over (33.5%). When the educational level is examined, 31 of the participants are high school graduates (13.7%), 121 are associate’s degree graduates (53.3%), 26 are
bachelor’s degree graduates (11.5%) and 49 are master and higher graduates (21.6%). In terms of employment tenure, 45 people have been in service for less than 5 years (19.8%), 44 people have been in service for 11-15 years (19.4%), 73 people have been in service for 16-20 years (32.2%), and 65 people have been in service for 21 years and over (28.6%).
9.2. Factor Analysis
Table 1 below shows the results of factor analysis for the scale we use. In the factor analysis PCA-Principal Component Analysis was used and varimax rotation was used as the rotation. First of all, KMO and Bartlett’s test values must be taken into consideration. If the value of the KMO Test is less than 0.5, it is not acceptable. A result higher than 0.8 is an excellent result (Durmuş,Yurtkoru and Çinko, 2011). The following table shows that the KMO value is greater than 0.5. Therefore, we can say that the variable set to be used in PCA is homogeneous. The assumption that we have a homogeneous set of variables is met this way. The Bartlett's Test tests the significance of the correlation matrix used as an input data for PCA. The p value of Bartlett’s test was found to be significant as p = 0.000. Thus, the correlation matrix can be used as an input data for the PCA.
Factor loadings will be checked after KMO and Bartlett’s test results. Factor loadings for all variables are over 0.5. Thus, there is no need to remove any variable from the factor. The explained variance was sufficient with 51.33%. Cronbach's Alpha value, which measures internal consistency, was calculated to measure the reliability of the factor.
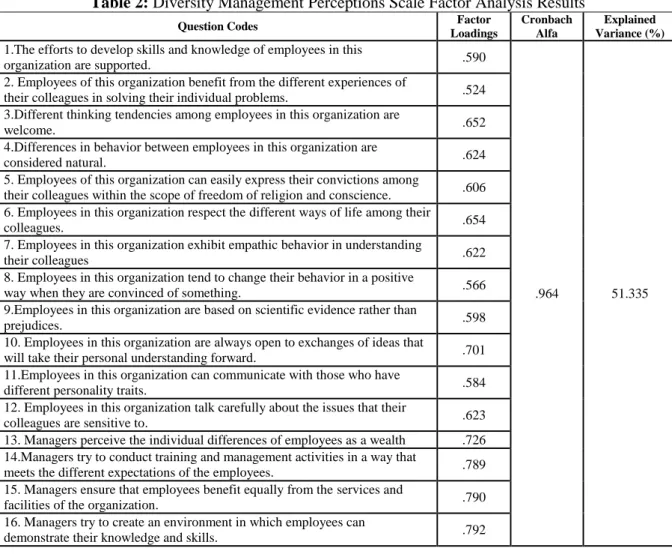
Table 2: Diversity Management Perceptions Scale Factor Analysis Results
Question Codes Factor
Loadings
Cronbach Alfa
Explained Variance (%)
1.The efforts to develop skills and knowledge of employees in this
organization are supported. .590
.964 51.335 2. Employees of this organization benefit from the different experiences of
their colleagues in solving their individual problems. .524 3.Different thinking tendencies among employees in this organization are
welcome. .652
4.Differences in behavior between employees in this organization are
considered natural. .624
5. Employees of this organization can easily express their convictions among
their colleagues within the scope of freedom of religion and conscience. .606 6. Employees in this organization respect the different ways of life among their
colleagues. .654
7. Employees in this organization exhibit empathic behavior in understanding
their colleagues .622
8. Employees in this organization tend to change their behavior in a positive
way when they are convinced of something. .566 9.Employees in this organization are based on scientific evidence rather than
prejudices. .598
10. Employees in this organization are always open to exchanges of ideas that
will take their personal understanding forward. .701 11.Employees in this organization can communicate with those who have
different personality traits. .584
12. Employees in this organization talk carefully about the issues that their
colleagues are sensitive to. .623
13. Managers perceive the individual differences of employees as a wealth .726 14.Managers try to conduct training and management activities in a way that
meets the different expectations of the employees. .789 15. Managers ensure that employees benefit equally from the services and
facilities of the organization. .790
16. Managers try to create an environment in which employees can
17. Managers do not discriminate due to status differences between employees. .825 18. Managers are committed to resolving conflicts between different cultural
values. .801
19. Managers take care not to make gender discrimination between employees. .733 20. Managers are sensitive to the equal application of the reward and
punishment system to all employees. .737
21. Managers do not privilege anyone because of their political views or
tendencies. .783
22. When evaluating employees, managers look at their usefulness and success
rather than their political views. .826
23. Managers take into consideration the different solutions offered by the employees in important decisions regarding various problems concerning the organization.
.720 24. Managers shall treat all employees fairly in assignments concerning the
health field. .787
25. Managers are positive about the different approach of employees on any
subject. .776
26. Managers make effective efforts to resolve conflicts arising from personal
differences. .813
27. Managers look positively to the willingness of employees to make changes
in jobs related to the health sector. .812 28. Managers act with a sense of responsibility in their attitude and behavior
towards employees with different personal characteristics. .834
Total 51.335 Kaiser-Meyer-Olkin Measure of Sampling Adequacy. 0.964
Bartlett's Test of Sphericity Approx. Chi-Square 2891.640
Sig. 0.000
The Cronbach Alpha value is above 0.7 with a high value of 0.964. Diversity Management Scale developed by Balay and Sağlam (2004: 39-44), was previously stated that it can be used as a single factor even in their own studies. In the sample we used, it was determined as a result of factor analysis that the Diversity Management Scale could be used as a single factor.
9. 3. Analysis about Demographic Variables
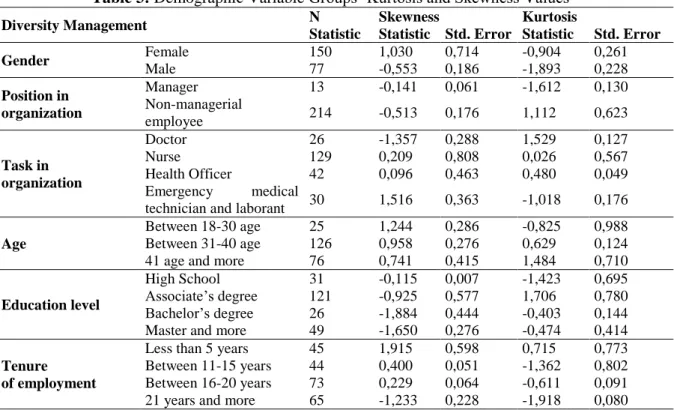
It has been tested whether the perceptions of health workers about diversity management differ for the different groups of demographic variables such as position in the organization, current task, gender, age, educational status and total tenure of employment in the profession. SPSS 25.0 package program was used to analyse the normal distribution of the data in terms of kurtosis and skewness. The skewness and kurtosis values between -2 and +2 are acceptable values for the normal distribution (George and Mallery, 2010). As can be seen from Table.3, the data showed normal distribution within group. Accordingly, parametric difference tests, called T-test and ANOVA (F) tests were used to measure the relationship between the research variable and demographic variables. T-test was used for demographic variables with 2 groups, while ANOVA (F) test was used for variables with more than 2 groups. Statistical significance was accepted as p <0.05.
Table 3: Demographic Variable Groups’ Kurtosis and Skewness Values
Diversity Management N Skewness Kurtosis
Statistic Statistic Std. Error Statistic Std. Error
Gender Female 150 1,030 0,714 -0,904 0,261 Male 77 -0,553 0,186 -1,893 0,228 Position in organization Manager 13 -0,141 0,061 -1,612 0,130 Non-managerial employee 214 -0,513 0,176 1,112 0,623 Task in organization Doctor 26 -1,357 0,288 1,529 0,127 Nurse 129 0,209 0,808 0,026 0,567 Health Officer 42 0,096 0,463 0,480 0,049 Emergency medical
technician and laborant 30 1,516 0,363 -1,018 0,176
Age
Between 18-30 age 25 1,244 0,286 -0,825 0,988 Between 31-40 age 126 0,958 0,276 0,629 0,124 41 age and more 76 0,741 0,415 1,484 0,710
Education level
High School 31 -0,115 0,007 -1,423 0,695 Associate’s degree 121 -0,925 0,577 1,706 0,780 Bachelor’s degree 26 -1,884 0,444 -0,403 0,144 Master and more 49 -1,650 0,276 -0,474 0,414
Tenure of employment
Less than 5 years 45 1,915 0,598 0,715 0,773 Between 11-15 years 44 0,400 0,051 -1,362 0,802 Between 16-20 years 73 0,229 0,064 -0,611 0,091 21 years and more 65 -1,233 0,228 -1,918 0,080
9. 3. 1. Analysis of gender and perceptions of diversity management
In the table below, genders are compared according to the mean values of the perception variable about diversity management. The hypothesis related to the test;
H1: Perceptions of participants about diversity management differ according to their gender.
Table 4: Findings Related to Gender Variable
Gender Statistic Values T-test
N Mean Std. Deviation t P
Diversity Management Female 150 2.9050 .82095 -1.848 0,066 Male 77 3.1146 .78485
It can be said that the variables with p values of t statistics less than 0.05 differed according to gender and the values higher than 0.05 do not differ according to gender. In this case, according to Table 4, as the p value of t statistic is higher than 0.05 (p = 0.066> 0.05), it is observed that diversity management perception variable does not differ according to gender. According to this result, H1
hypothesis is not supported.
9. 3. 2. Analysis of position in the organization and perceptions of diversity management
In the table below, positions in the organization are compared according to the mean values of the perception variable about diversity management. The hypothesis related to the test;
H2: Perceptions of participants about diversity management differ according to their positions
Table 5: Findings Related to Position Variable
Position in organization Statistical values T-test
N Mean Std. Deviation t P
Diversity Management Manager 13 4.0467 .83023 5.158 .000 Employee 214 2.9110 .76727
It can be said that the variables with p values less than 0.05 differ according to the position in the organization, and values greater than 0.05 do not differ according to the position in the organization. In this case, according to Table 5, as the p value of t statistic is less than 0.05 (p = 0.000 <0.05), it is observed that diversity management perception variable differs according to the position of employees in the organization. According to this result, H2 hypothesis is supported. When the mean score is
considered, it can be said that employees in the managerial position have higher perception of diversity management than other employees. Managers' perception of diversity management is more positive than other employees.
9. 3. 3. Analysis of task and perceptions of diversity management
Task groups in the organization are compared according to the mean values of the perception variable about diversity management. The hypothesis related to the test;
H3: Perceptions of participants about diversity management differ according to their task in the
organization.
As a result, it can be said that there are differences according to the task groups in the organization for the variables in F tests whose p values are less than 0.05, and there is no difference in those whose p values are bigger than 0.05. As can be seen in Table 6 below, employees in different task groups in the organization do not differ in terms of perception of diversity management. According to this result, H3 hypothesis is not supported.
Table 6: Findings Related to Task Variable
Task in Organization N Mean Std.
Deviation F Sig. Diversity Management Doctor 26 3.267 .751 1.719 0.164 Nurse 129 2.889 .833 Health officer 42 3.037 .745 Emergency medical technician
and laborant 30 3.014 .838
9. 3. 4. Analysis of age groups and perceptions of diversity management
The age groups are compared according to the mean values of the perception variable about diversity management. The hypothesis related to the test;
H4: Perceptions of participants about diversity management differ according to their age groups.
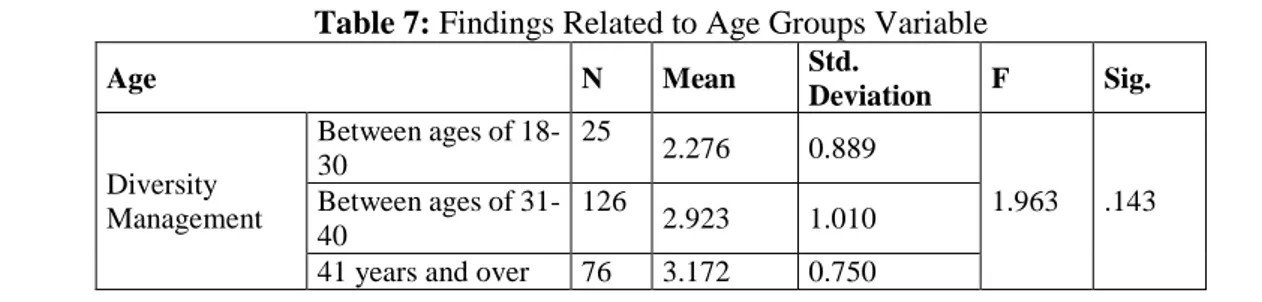
As a result, it can be said that there is a difference according to age groups for variables in F tests whose p values are less than 0.05 and there is no difference in those whose p values are bigger than 0.05. As can be seen in Table 7 below, different age groups do not differ in terms of perception of diversity management. According to this result, H4 hypothesis is not supported.
Table 7: Findings Related to Age Groups Variable Age N Mean Std. Deviation F Sig. Diversity Management Between ages of 18-30 25 2.276 0.889 1.963 .143 Between ages of 31-40 126 2.923 1.010 41 years and over 76 3.172 0.750
9. 3. 5. Analysis of education level and perceptions of diversity management
Education level groups are compared according to the mean values of the perception variable about diversity management. The hypothesis related to the test;
H5: Perceptions of participants about diversity management differ according to their education
level.
As a result, it can be said that there is a difference according to the education level groups for the variables in F tests whose p values are less than 0.05 and there is no difference in those whose p values are bigger than 0.05. As can be seen from Table 8 below, those at different educational levels do not differ in terms of perception of diversity management. According to this result, H5 hypothesis is not
supported.
Table 8: Findings Related to Education Level Variable
Education Level N Mean Std.
Deviation F Sig. Diversity Management High school 31 3.187 .795 2.266 .082 Associate’s degree 121 2.875 .841 Bachelor’s degree 26 2.867 .655 Master and More 49 3.151 .796
9. 3. 6. Analysis of employment tenure and perceptions of diversity management
Employment tenure groups are compared according to the mean values of the perception variable about diversity management. The hypothesis related to the test;
H6: Perceptions of participants about diversity management differ according to employment
tenure.
As a result, it can be said that there is a difference according to the service time groups for the variables in F tests whose p values are less than 0.05 and there is no difference in those whose p values are bigger than 0.05. As can be seen from Table 9 below, employment tenure groups do not differ in terms of perception of diversity management. According to this result, H6 hypothesis is not supported.
Table 9: Findings Related to Employment Tenure Variable
Employment Tenure N Mean Std.
Deviation F Sig.
Diversity Management
Less than 5 years 45 2.910 .674
621 .602 Between 11-15 Years 44 3.020 .672
Between 16-20 Years 73 2.906 .870 21 Years and more 65 3.071 .922 10. Conclusion
Previous studies in the literature have determined that perceptions of employees about diversity management may differ according to demographic characteristics. However, in our study, it is determined that differences in gender, task groups, age groups, education levels and employment tenure
do not change their perception of diversity management significantly. According to these results, H1, H3,
H4, H5, H6 hypotheses are not supported.
The findings of our study are consistent with the results of the previous research conducted by Öncer (2004), Memduhoğlu (2007), Fettahlıoğlu and Tatlı (2015) and Meteroğlu (2015). In our study, it is also investigated whether managerial tasks of participants changed their perceptions of diversity management. As a result of the analysis, there is a significant difference between the perceptions about the diversity management between the personnel in the managerial position and the personnel in the non-managerial position. According to this result, H2 hypothesis is supported. The perceptions of the
personnel in the managerial position about the diversity management are more positive than the ones in the non-managerial position. While managers think that differences are well managed and differences between employees are not a problem in the organization, other employees disagree. This result is similar to Memduhoğlu's (2007) study.
Starting from this idea and based on the findings of the research, the following suggestions were made.
It has been found that there is a statistical difference between the perceptions of diversity management between the personnel of the public health sector in the status of managers and employees. As a reason for this difference, it can be said that the employees do not have information about the diversity management. Moreover, the manager might have been reluctant to express their failures and problems regarding diversities of the organization where they manage. Another reason is, they might not have seen the failures and problems in their management practices as well as those working in other positions
It is very challenging that the descriptive statistical mean values of the diversity management scale in the research are moderate in all employees except managers
Furthermore, it should not be overlooked by managers that providing awareness-based diversity trainings to these personnel can have a positive effect on the perception of personnel about the diversity management.
The fact that the managers consult to the staff, who work in the organization, about all kinds of issues, especially the health issues will remind these staff that they are always important.
An organizational culture that supports differences within the organization should be strengthened to enable the feelings of friendship of the staff with each other. All kinds of training programs of the personnel in the organization should be supported with scientific data. For the development of the personnel of organization, it should be ensured that the personnel are directed to the activities by the administrations in addition to the personal training requests. It should be ensured that the personnel in the status of employees are turned into experts in their fields with vocational training programs and the personnel having vocational courses should be employed in the department where they take courses.
REFERENCES
Agars, M. D. & Kottke, J. L. (2004). Models and practice of diversity management: A historical review and presentation of a new integration theory. The Psychology and Management of Workplace
Diversity, 5577.
Akın, A. & Yavaşi, M. (2007). Çalışma yaşamında insan hakları ve insan kaynakları. 15. Ulusal Yönetim
Balay, R. & Sağlam, M. (2004). Eğitimde farklılıkların yönetimi ölçeğinin uygulanabilirliği. Süleyman
Demirel Üniversitesi Burdur Eğitim Fakültesi Dergisi, 5(8), 31-46.
Balyer, A. & Gündüz, Y. (2010). Yönetici ve öğretmenlerin okullarında farklılıkların yönetimine ilişkin algılarının incelenmesi. Marmara Üniversitesi Atatürk Eğitim Fakültesi Eğitim Bilimleri
Dergisi, 32(32), 25-43.
Barutçugil, İ. (2004). Stratejik insan kaynakları yönetimi (1. Basım). İstanbul: Kariyer Yayınları. Bulşu, Ç. (2017). Farklılıkların yönetiminin örgütsel bağlılık ve işten ayrılma niyetine etkisi:
İstanbul'daki 4 ve 5 yıldızlı otel işletmesi çalışanlarına yönelik bir araştırma (Unpublished master's thesis). Batman University, Institute of Social Sciences, Batman.
Byrd, M. Y. (2018). Does HRD have a moral duty to respond to matters of social injustice?. Human
Resource Development International, 21(1), 3-11.
Cox, T. (1994). Cultural diversity in organizations: Theory, research and practice. Berrett-Koehler Publishers.
D'Netto, B., Shen, J., Chelliah, J. & Monga, M. (2014). Human resource diversity management practices in the Australian manufacturing sector. The International Journal of Human Resource
Management, 25(9), 1243-1266.
Durmuş, B., Yurtkoru, E. S. & Çinko, M. (2011). Sosyal bilimlerde SPSS ile veri analizi. İstanbul: Beta Yayıncılık.
Ece, S., & Gültekin, S. (2018). Yönetici desteği ve örgütsel bağlılık: kamu sektöründe bir uygulama.
Akademik Bakış Uluslararası Hakemli Sosyal Bilimler Dergisi, 66, 82-93.
Edwards, M. R. & Kelan, E. K. (2011). Employer branding and diversity: foes or friends. (Eds.) Brannan, M. J., Parsons, E., & Priola, V. (2011). Branded lives: The Production and
Consumption of Meaning at Work. Edward Elgar Publishing.
Esen, M. & Esen, D. (2018). Türkiye’de yayınlanan sürdürülebilirlik raporlarının sürdürülebilir insan kaynakları yönetimi bağlamında incelenmesi: Nitel bir araştırma. Uluslararası İktisadi ve İdari
İncelemeler Dergisi, (17. UİK Özel Sayısı), 827-844.
Fettahlıoğlu, Ö. O. & Tatlı, H. S. (2015). Örgütsel bağlılık ve farklılıkların yönetimi algılamaları arası ilişkilerin saptanmasında demografik farklılıklara yönelik inceleme. KSÜ Sosyal Bilimler
Dergisi, 12(2), 119-140.
George, D. & Mallery, M. (2010). SPSS for windows step by step: a simple guide and reference, 17.0
Update (10 ed.). Boston, Pearson.
Glazer, G., Tobias, B. & Mentzel, T. (2018). Increasing healthcare workforce diversity: Urban universities as catalysts for change. Journal of Professional Nursing, 34(4), 239-244.
Goswami, S. & Goswami, B. K. (2018). Exploring the relationship between workforce diversity, inclusion and employee engagement. Drishtikon: A Management Journal, 9(1), 65-89.
Gümüş, M. (2009). İşletmelerde farklılıkların yönetimi (1. Baskı). Bursa: Marmara Kitap Merkezi Yayınları.
Hubbard, E. (2004). The manager's pocket guide to diversity management. Human Resource Development. Amherst, Massachusets: HRD Press, Inc.
Jehn, K. A. & Mannix, E. A. (2001). The dynamic nature of conflict: A longitudinal study of intragroup conflict and group performance. Academy of Management Journal, 44(2), 238-251.
Jordan, S. L., Ferris, G. R. & Lamont, B. T. (2019). A framework for understanding the effects of past experiences on justice expectations and perceptions of human resource inclusion practices.
Human Resource Management Review, 29(3), 386-399.
Karademir, T., Çoban, B., Devecioğlu, S., Karakaya, Y. E. & Yücel, A. S. (2012). Views of the teachers and administrators of the high school of fine arts and sports on diversity management. Niğde
Üniversitesi Beden Eğitimi ve Spor Bilimleri Dergisi, 6(1), 62-75.
Keil, M., Amershi, B., Holmes, S., Jablonski, H., Lüthi, E., Matoba, K., Plett, A. & Von Unruh, K. (2007). Farklılıkların yönetimi için eğitim elkitabı. Uluslararası Farklılıkların Yönetimi
Derneği. https://www.idm-diversity.org/files/EU0708-TrainingManual-tr.pdf (22 Ağustos 2019).
Kochan, T., Bezrukova, K., Ely, R., Jackson, S., Joshi, A., Jehn, K., Leonard, J. Levine, D. & Thomas, D. (2003). The effects of diversity on business performance: Report of the diversity research network. Human Resource Management, 42(1), 3-21.
Lee, H. W. (2019). How does sustainability-oriented human resource management work? Examining mediators on organizational performance. International Journal of Public Administration,
42(11), 974-984.
Mannix, E., & Neale, M. A. (2005). What differences make a difference? The promise and reality of diverse teams in organizations. Psychological Science in the Public Interest, 6(2), 31-55. McKay, P. F., Avery, D. R., Tonidandel, S., Morris, M. A., Hernandez, M. & Hebl, M. R. (2007). Racial
differences in employee retention: Are diversity climate perceptions the key?. Personnel
Psychology, 60(1), 35-62.
Memduhoğlu, H. B. (2007). Yönetici ve öğretmen görüşlerine göre Türkiye’de kamu liselerinde
farklılıkların yönetimi. (Unpublished doctoral dissertation), Ankara University, Institute of
Educational Sciences, Ankara.
Meteroğlu, B. (2015). Ortaokullarda görev yapan öğretmenlerin okullarda farklılıkların yönetimine
ilişkin algıları: Diyarbakır il örneği. (Unpublished master's thesis). Zirve University, Institute
of Social Sciences, Gaziantep.
Milliken, F. & Martins, L. (1996). Searching for common threads: Understanding the multiple effects of diversity in organizational groups. Academy of Management Review, 21, 402-433.
Ottaviano, G. I. & Peri, G. (2006). The economic value of cultural diversity: evidence from US cities.
Journal of Economic Geography, 6(1), 9-44.
Ozgener, S. (2008). Diversity management and demographic differences-based discrimination: the case of Turkish manufacturing industry. Journal of Business Ethics, 82(3), 621-631.
Öncer, A. Z. (2004). Individual, organizational, managerial diversity resources and diversification
strategies in companies: A research on Unilever Unity Project, [İşletmelerde bireysel, örgütsel,
yönetsel farklılık kaynakları ve farklılaşma stratejileri: Unilever Unity Projesi kapsamında bir araştırma]. (Unpublished doctoral dissertation), Marmara University, Institute of Social Sciences, İstanbul.
Özgül, B. & Gürol, Y. (2019). Kurumsal sürdürülebilirlikte sürdürülebilir insan kaynakları yönetiminin rolü üzerine bir içerik analizi. Doğuş University Journal, 20(1), 107-126.
Point, S. & Singh, V. (2003). Defining and dimensionalising diversity: Evidence from corporate websites across Europe. European Management Journal. 21(6), 750-761.
Polat Dede, N. (2019). Enhancing employee innovative work behavior through human resource
management practices. In Handbook of Research on Managerial Thinking in Global Business
Economics, 1-21, IGI Global.
Rice, M. & Arekere, D. (2005). Workforce diversity initiatives and best practices in business and governmental organizations-Developments, approaches, and issues. Diversity and Public
Administration-Theory, Issues and Perspectives, 22-44.
Shen, J., Chanda, A., D'netto, B. & Monga, M. (2009). Managing diversity through human resource management: An international perspective and conceptual framework. The International
Journal of Human Resource Management, 20(2), 235-251, DOI: 10.1080/09585190802670516
Sürgevil, O. (2010). Çalışma yaşamında farklılıkların yönetimi. Ankara: Nobel Yayın Dağıtım. Şahin, E. K. (2015). İlköğretim kurumlarında farklılıkların yönetimine ilişkin öğretmen görüşlerinin
incelenmesi (Unpublished master's thesis). Gazi University Institute of Social Sciences, Ankara.
Tozkoparan, G. & Vatansever, Ç. (2009). Farklılıkların yönetimi: İnsan kaynakları yöneticilerinin farklılık algısı üzerine bir odak grup çalışması. 17. Ulusal Yönetim ve Organizasyon Kongresi
Bildiriler Kitabı. Eskişehir: Eskişehir Osmangazi Üniversitesi, 742-748.
Türk Dil Kurumu (2019). Sözlükler. http://sozluk.gov.tr/ (22 Ağustos 2019).
Ünalp, A. T. (2007). Global companies and the importance of cultural diversity management in diversity
management in the global companies, [Küresel işletmeler ve küresel işletmelerde farklılıkların yönetiminde kültürel farklılıkların önemi]. (Unpublished master's thesis), Dokuz Eylül
University, Institute of Social Sciences. İzmir.
Wentling, R. M. (2004). Factors that assist and barriers that hinder the success of diversity initiatives in multinational corporations. Human Resource Development International, 7(2), 165-180. West, M. A., Hwang, S., Maier, R. V., Ahuja, N., Angelos, P., Bass, B. L., ... & Fong, Y. (2018).
Ensuring equity, diversity, and inclusion in academic surgery: An American surgical association white paper. Annals of Surgery, 268(3), 403-407
Williams, K. Y. & O'Reilly III., C. A. (1998). Demography and diversity in organizations: A review of 40 years of research. Research in Organizational Behavior, 20(20), 77-140.
Winkfield, K. M. & Gabeau, D. (2013). Why workforce diversity in oncology matters. International
Journal of Radiation Oncology• Biology• Physics, 85(4), 900-901.
Yagi, N. (2017). Variability of boundary and meaning of diversity attributes: Studies from diversity management at a Japanese SME. International Journal of Business Anthropology, 7(2), 23-38. Yazıcı, S. (2001). Öğrenen organizasyonlar. İstanbul: Alfa Yayınevi.