Turkish Consumers’ Understanding and Use of Nutrition Labels on Packaged Food
Products
F. Gul Aygen
Faculty of Economics and Administrative Sciences
Department of Business Administration
Dogus University
Istanbul, Turkey
Abstract
The purpose of this study is to examine Turkish consumers’ understanding and use of nutrition labels found on packaged food products. Data was collected from a total of 500 consumers living in Istanbul through the use of a structured and undisguised questionnaire. Apart from the descriptive statistics, analyses were conducted with respect to the demographic variables of “gender”, “age”, “education”, and “districts of the city respondents lived in”. Significant differences were found to exist particularly among those living in the different districts of
the city.“Follow-up of nutrition related news in the media” has also been analyzed. Implications of the study for
consumers, producers, retailers, and the state together with further research are presented in the last part of the paper. Although the findings of the study pertain to the Turkish market, its implications may be applicable in other countries, as well, where nutrition labeling is not mandatory for the time being.
Keywords:
Food Safety, Nutrition Labeling, Healthy Diet, Nutritious Eating, Turkish Consumer1. Introduction
“An unhealthy diet is one of the major risk factors for a range of chronic diseases, including cardiovascular diseases, cancer, diabetes and other conditions linked to obesity” (WHO, 2011a). Obesity, today, is a major threat for almost every nation on the entire planet. “Worldwide obesity has more than doubled since 1980. In 2008, 1.5 billion adults, 20 and older, were overweight. Of these, over 200 million men and nearly 300 million women were obese… The fundamental cause of obesity and overweight is an energy imbalance between calories consumed and calories expended. Globally, there has been an increased intake of energy-dense foods that are high in fat, salt and sugars but low in vitamins, minerals and other micronutrients and a decrease in physical activity due to the increasingly sedentary nature of many forms of work, changing modes of transportation, and increasing urbanization” (WHO, 2011b). However, as the World Health Organization (WHO) points out, obesity is preventable, provided that people can make healthier choice of foods and engage in regular physical activity throughout their lives (WHO, 2011b). Specific WHO recommendations for a healthy diet include eating more fruits, vegetables, legumes, nuts and grains; cutting down on salt, sugar and fats; choosing unsaturated fats, instead of saturated fats and eliminating trans-fatty acids (WHO, 2011a).
Various aspects of poor diet, physical inactivity and consequences of diet-related health problems have been recognized by many researchers and nutrition labeling has been mentioned as one of the major instruments in helping people make better food purchase decisions and adopt healthier eating patterns (Nayga, 1996; Drichoutis et al., 2006; Grunert & Wills, 2007; Mhurchu & Gorton, 2007; Feunekes et al., 2008; Nørgaard & Brunsø, 2009). “Nutrition labeling is an attempt to provide consumers, at the point of purchase, with information about the nutrition content of individual food products, in order to enable them to choose nutritionally appropriate food. It is an attractive instrument for a variety of reasons: it supports the goal of healthy eating while retaining consumer freedom of choice, and it reduces information search costs for consumers, which should make it more likely that the information provided is actually being used” (Grunert & Wills, 2007: 385). Nevertheless, modifying individual dietary habits is no trivial task, as it involves trade-offs between nutrition on the one hand and factors such as taste, price, convenience, and cost, on the other (Barreiro et al., 2010). Hence, it is quite important to realize that there is a need to educate and motivate consumers, in the first place, so as to enable an effective and helpful use of such information.
___________
* Sponsoring information: This research has been funded by the Dogus University Scientific Research Projects Support Fund (project number: BAP-2010-11-D1-B01).
2. Literature Review
When asked about their use of nutrition labels on food products, most consumers claim looking at nutrition labels “usually”, “often”, or “at least sometimes”, when making food purchases (Govindasamy & Italia, 1999; Neuhouser et al., 1999; Byrd-Bredbenner et al., 2000; Cowburn & Stockley, 2005; Satia et al., 2005; Mhurchu & Gorton, 2007). In some studies, one fifth to one third of respondents have replied as “always” checking nutrition labels (Byrd-Bredbenner et al., 2000; Nielsen Malaysia, 2005), whereas in a Turkish study, about 46% of males and 40% of females were found not to read nutrition labels, at all (Bozkır, 2009). Nevertheless, the results of such surveys are known to vary considerably with country, time, categories of consumers and the pattern of questions asked (Cheftel, 2005). Another point to mention is that even though reported use of nutrition labels may be high, actual use may be much lower (Cowburn & Stockley, 2005; Mhurchu & Gorton, 2007; Nørgaard & Brunsø, 2009; Vyth et al., 2009; Grunert et al., 2010a) as there always is a possibility of social desirability bias in self-reported retrospective behavior (Neuhouser et al., 1999; Grunert & Wills, 2007; Vyth et al., 2009; Grunert et al., 2010a). Nutrition label use is influenced by various factors. Label users seem to exhibit a greater concern about their diet and health (Govindasamy & Italia, 1999; Cowburn & Stockley, 2005; Drichoutis et al., 2006; Svederberg et al., 2008), have a positive attitude and greater nutrition knowledge of diet-disease relationship (Marietta et al., 1999; Drichoutis et al., 2006; Misra, 2007), place more importance on following the dietary guidelines and agree that what one eats can affect the risk of getting a disease such as cancer or heart disease (Neuhouser et al., 1999; Nayga, 2000; Satia et al., 2005), have diets that are lower in fat (Neuhouser et al., 1999; Misra, 2007) and cholesterol and higher in fruits and vegetables (Neuhouser et al., 1999; Misra, 2007) compared to non-users. Those who are not allowed to eat certain foods or ingredients or who try to avoid certain production methods are more likely to read nutrition labels compared to those less concerned by such factors (FSA, 2010).
Consumers with a health problem that necessitate dietary restrictions are also more likely to use nutrition labels while shopping (Govindasamy & Italia, 1999; Drichoutis et al., 2006; Svederberg et al., 2008). In some cases, the desire to maintain good health is of prime concern and consumers read labels to obtain information about ingredients and nutrition (Wills et al., 2009). Likewise, those who wish to avoid the negative nutrients in food products are affected by nutrition labels in their purchases, too (Cowburn & Stockley, 2005; Drichoutis et al., 2006). Demographic characteristics are also quite influential in nutrition label use and affect consumers‟ label usage in varying magnitudes, either positively or negatively (Nayga et al., 1998; Govindasamy& Italia, 1999; Marietta et al., 1999; Obayashi et al., 2003; Cowburn& Stockley, 2005; Satia et al., 2005; Drichoutis et al., 2006; Grunert & Wills, 2007; Feunekes et al., 2008; Viswanathan et al., 2009; FSA 2010; Grunert et al., 2010a).
A product‟s first-time purchase increases likelihood of reading nutrition labels (Marietta et al., 1999; Nielsen Malaysia, 2005; Peters-Texeira & Badrie, 2005; Grunert & Wills, 2007; Mhurchu & Gorton, 2007; Misra, 2007; Wills et al., 2009) whereas time pressure decreases it (Grunert & Wills, 2007).
There are also differences according to product category (Grunert & Wills, 2007; Mhurchu & Gorton, 2007), consumers tend to read nutrition labels more when buying certain kinds of food (Grunert & Wills, 2007; Mhurchu & Gorton, 2007). Besides, interests in good taste, traditional eating, and indulgence also seem to affect nutritional label use (Grunert & Wills, 2007). Likewise, economic constraints are one of the other factors influencing label use (Barreiro-Hurle et al., 2010). Items requested by another adult with a health concern or by children also increase nutrition information reading behavior (IFIC, 2009). On the other hand, people tend to read less nutrition information on routine items, single ingredient products such as milk or eggs, items requested by other healthy adults, and discount items (IFIC, 2009). Country-specific differences (Grunert et al., 2010b) and local culture (Nielsen Malaysia, 2005) may also strongly influence whether consumers check food labels or not. Consumers‟ use of nutrition information increases in case of comparing two products with similar prices (Misra, 2007; Kelly et al., 2009; Wills et al., 2009) or front-of-package claims (Misra, 2007; Wills et al., 2009).
With respect to information consumers look for on a nutrition label, the most frequently mentioned information across various studies were “calories” (Marietta et al, 1999; Neuhouser et al., 1999; Nielsen Malaysia, 2005; Grunert & Wills, 2007; Misra, 2007; IFIC, 2009; Grunert et al., 2010a, 2010b; IFIC, 2010), “fat” (Marietta et al, 1999; Neuhouser et al., 1999; Nielsen Malaysia, 2005; Grunert & Wills, 2007; Misra, 2007; IFIC, 2009; Grunert et al., 2010a, 2010b ), sugar (Nielsen Malaysia, 2005; Grunert & Wills, 2007; IFIC, 2009; Grunert et al., 2010a, 2010b), and salt (IFIC, 2009; Grunert et al., 2010a., IFIC, 2010). The least used elements seem to be iron (Marietta et al., 1999; Misra, 2007), dietary fiber (Marietta et al., 1999; Misra, 2007; Grunert et al., 2010b), and vitamin A (Marietta et al., 1999; Misra, 2007).
Even if they read labels, consumers do not understand what they read, in many instances (Nielsen Malaysia, 2005; Mhurchu & Gorton, 2007). Many studies found that, in general, consumers were confused with nutrition label information, especially with the use of some technical and numerical information (Unusan, 2004; Cowburn & Stockley, 2005; Peters-Texeira & Badrie, 2005; Grunert & Wills, 2007; Mhurchu & Gorton, 2007; Feunekes et al., 2008; Kelly et al., 2009; Nørgaard & Brunso, 2009). Besides, ability to use nutritional information is reduced when consumers perceive an overflow of information (Drichoutis et al., 2006; Kelly et al., 2009; Nørgaard & Brunso, 2009). Information overload results when people are presented with more information than they can process which leads to confusion, misunderstanding, and uncertainty; in turn, leading to skepticism and mistrust of food labels (FSA, 2010).
Apart from the confusion issue, reasons for not reading nutrition labels include aspects such as lack of time (Unusan, 2004; Cowburn & Stockley, 2005; Grunert & Wills; 2007; Mhurchu & Gorton, 2007), size of print on packages (Cowburn & Stockley, 2005), shopping habits (Mhurchu & Gorton, 2007), perceived high cost of healthy foods (Mhurchu & Gorton, 2007), concerns about the accuracy of the information (Unusan, 2004; Cowburn & Stockley, 2005), and also lack of motivation (Grunert et al, 2010b). Existing nutrition information on food packages was also criticized for having poor legibility, for being hard to find and/or read, for being concealed by stick-on labels, and for lacking color contrast letters/background, for lacking standardization, and for using obscure wording (Grunert & Wills, 2007).
3. Research Design and Methodology
3.1. Research Purpose and Design
The purpose of this study is to examine Turkish consumers‟ understanding and use of nutrition labels found on packaged food products and the research questions for which answers are sought can be stated as follows:
1) How often do people read the nutrition labels found on packaged food items? 2) What is the extent to which nutrition labels can be understood?
3) What are the most frequently used label elements?
4) What are the circumstances that increase usage of nutrition labels? 5) How much do people trust in nutrition labels?
6) What, if any, sort of dissatisfaction do people have with respect to nutrition labels? 7) What are the reasons for “using” and “not using” nutrition labels?
8) With respect to the above stated research questions, is there any significant difference between „male and female‟ respondents as well as „those who follow nutrition-related news in the media vs. those who do not‟?
9) With respect to the above stated research questions, are there significant variations across different „age categories‟, „education levels‟, and „respondents living in the different districts of the city‟?
This research is descriptive in nature, as it attempts to describe the prevailing opinions, perceptions, attitudes, and self-reported practices of Turkish consumers regarding the topic of nutrition labeling.
3.2. Data Collection Procedure and Instrument
Data was collected through a structured and undisguised questionnaire distributed among consumers. Questions were developed upon a thorough analysis of relevant literature. A pilot study was carried out among 20 consumers to see if the questions were readily understood. Necessary changes were made in the wording of some questions before distributing the questionnaires for the actual study. The internal reliability of the questionnaire using the Cronbach‟s alpha coefficient was 0.92, which indicated a high internal correlation among the items. The content validity in meeting the objectives of the study was established on consultation with food engineers and the literature. The questionnaire was composed of different sections and took an average of 15 to 20 minutes to administer.
3.3. The Sampling Design
This cross-sectional field study took place during the two months of July and August, 2011. The sample consisted of 500 individuals and was recruited by a local market research company. All of the participants gave their informed consent prior to their inclusion in the study. These individuals were over 18 years of age, lived in the socio-economically different districts of Istanbul, and did food shopping for themselves and/or their families.
Within this frame, high, middle, and low income districts on the Asian and European sides of the city were chosen and the questionnaires were administered face to face with the respondents at their homes, by qualified interviewers. Random sampling was used in recruiting the respondents and the sample size was determined taking into consideration population densities of the districts representative of Istanbul as a whole. To enable maximum reach during the data collection process, no more than ten interviews were conducted in each neighborhood and a maximum of three contacts were established on each street in apartments that were not next to each other. The field process was first controlled by supervisors in the region and later more than 50% of respondents were rechecked to see if they had really been surveyed.
3.4. Analysis of Data
The analysis on the 500 questionnaires, inclusive of the descriptive statistics and the relevant tests to investigate the various relationships and differences sought among the variables included in the study, was completed by using the computer program SPSS (Statistical Package for the Social Sciences). Since all of the variables used in the study were found to be non-normally distributed, non-parametric tests were used (Mann-Whitney, Kruskal-Wallis). The Mann-Whitney U Test was used to test for significant differences in case of “gender”, “health-related condition ownership”, and “follow-up of nutrition related news in the media” and the Kruskal-Wallis Test was used in case of “age”, “education”, and the “districts of the city respondents lived in”.
4. Findings
With respect to nutrition facts label readership, self-reported replies revealed the following: On the average, 18% of the respondents “always”, 25% “usually”, 32% “sometimes” and 14% “seldom” read nutrition facts labels. Percentage of those who indicated that they “never” read nutrition facts labels was 10 while less than 1% (0.6%) of the respondents had “no idea” with respect to this question.
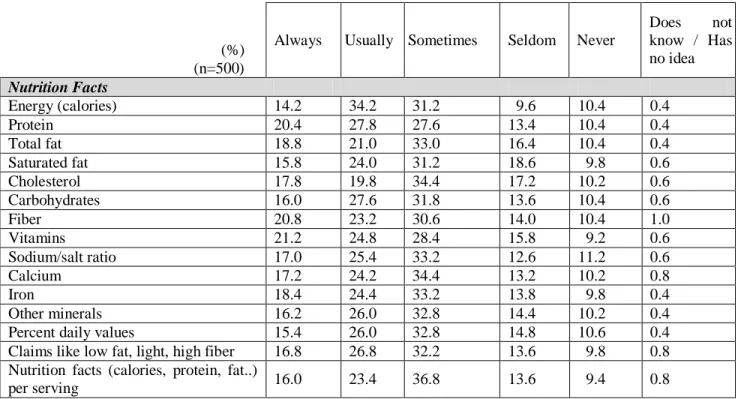
Frequency of “nutrition facts label” readership is detailed in the following table, with respect to the individual elements of the label:
Table 1 Frequency of “Nutrition Facts Label” Readership
(%) (n=500)
Always Usually Sometimes Seldom Never
Does not know / Has no idea Nutrition Facts Energy (calories) 14.2 34.2 31.2 9.6 10.4 0.4 Protein 20.4 27.8 27.6 13.4 10.4 0.4 Total fat 18.8 21.0 33.0 16.4 10.4 0.4 Saturated fat 15.8 24.0 31.2 18.6 9.8 0.6 Cholesterol 17.8 19.8 34.4 17.2 10.2 0.6 Carbohydrates 16.0 27.6 31.8 13.6 10.4 0.6 Fiber 20.8 23.2 30.6 14.0 10.4 1.0 Vitamins 21.2 24.8 28.4 15.8 9.2 0.6 Sodium/salt ratio 17.0 25.4 33.2 12.6 11.2 0.6 Calcium 17.2 24.2 34.4 13.2 10.2 0.8 Iron 18.4 24.4 33.2 13.8 9.8 0.4 Other minerals 16.2 26.0 32.8 14.4 10.2 0.4
Percent daily values 15.4 26.0 32.8 14.8 10.6 0.4
Claims like low fat, light, high fiber 16.8 26.8 32.2 13.6 9.8 0.8 Nutrition facts (calories, protein, fat..)
per serving 16.0 23.4 36.8 13.6 9.4 0.8
The most frequently read nutrition facts are “energy (calories)”, “protein”, “vitamins”, “fiber”, “claims like low fat, light, high fiber”, and “carbohydrates”. Percentage of those respondents who “always” or “usually” read “energy (calories)” and “protein” is 48, for both elements; these values are 46% in case of “vitamins”, and 44% for “fiber”, for “claims like low fat, light, high fiber”, and for “carbohydrates”. Nevertheless, with respect to each element of the nutrition facts label, inclusive of the most frequently read ones stated above, 20% or more of the respondents have indicated either reading them “seldom” or “not reading them at all".
Besides, more than 25% have indicated “seldom” or “no” readership of “saturated fats” (28%), “cholesterol” (27%), and “total fat” (27%).
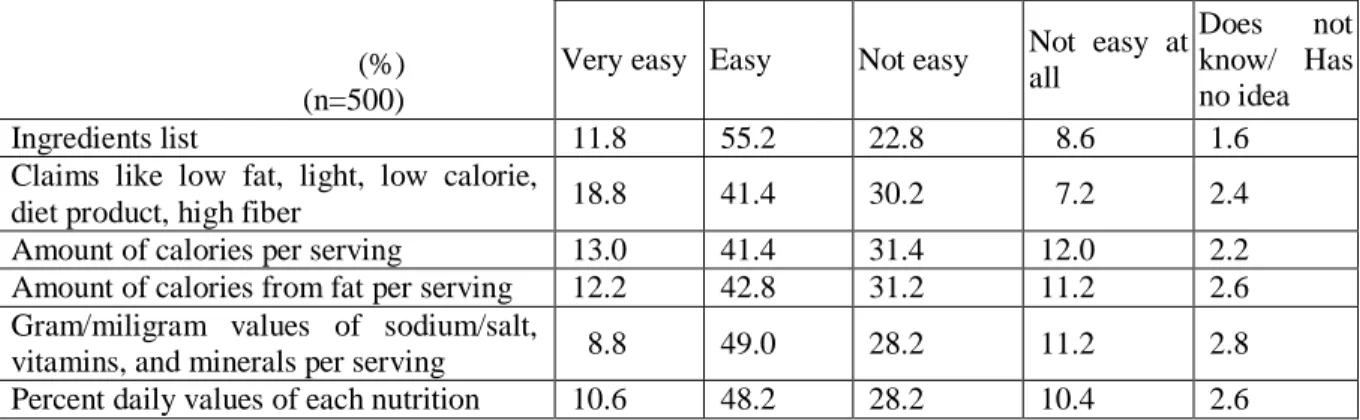
When asked about the understandability of nutrition labels, the following results were obtained: Table 2 The Extent to Which the Nutrition Labels Can Be Understood
(%) (n=500)
Very easy Easy Not easy Not easy at all
Does not know/ Has no idea
Ingredients list 11.8 55.2 22.8 8.6 1.6
Claims like low fat, light, low calorie,
diet product, high fiber 18.8 41.4 30.2 7.2 2.4
Amount of calories per serving 13.0 41.4 31.4 12.0 2.2
Amount of calories from fat per serving 12.2 42.8 31.2 11.2 2.6 Gram/miligram values of sodium/salt,
vitamins, and minerals per serving 8.8 49.0 28.2 11.2 2.8
Percent daily values of each nutrition 10.6 48.2 28.2 10.4 2.6
Relatively speaking, the “ingredients list” (67% “very easy/easy”) and “claims like low fat, light, low calorie, diet product, high fiber” (60% “very easy/easy”) seem to be easier to understand while the “amount of calories per serving” (43% “not easy/not easy at all”) and the “amount of calories from fat per serving” (42%“not easy/not easy at all”) seem to be more difficult to understand.
With respect to the perceived trustworthiness of various claims on food labels, 50 to 60 % of the respondents perceived all of the listed claims to be either “trustworthy or very trustworthy” while the distrust dimension weighed more for about 40 to 46%. (Table 3)
Table 3 Perceived Trustworthiness of Various Claims on Food Labels (%) (n=500) Very trustworthy Trustworthy Not trustworhty Not trustworthy at all Does not know / Has no idea Low fat 13.0 46.2 31.0 7.0 2.8 Low cholesterol 16.6 38.0 34.2 8.4 2.8 High fiber 10.0 43.6 33.8 8.4 4.2 Light 14.8 38.4 33.8 10.0 3.0 Healthy 8.6 45.6 31.4 11.6 2.8 Extra skimmed 13.0 40.4 33.0 11.0 2.6 100% natural 11.0 40.2 33.8 11.8 3.2
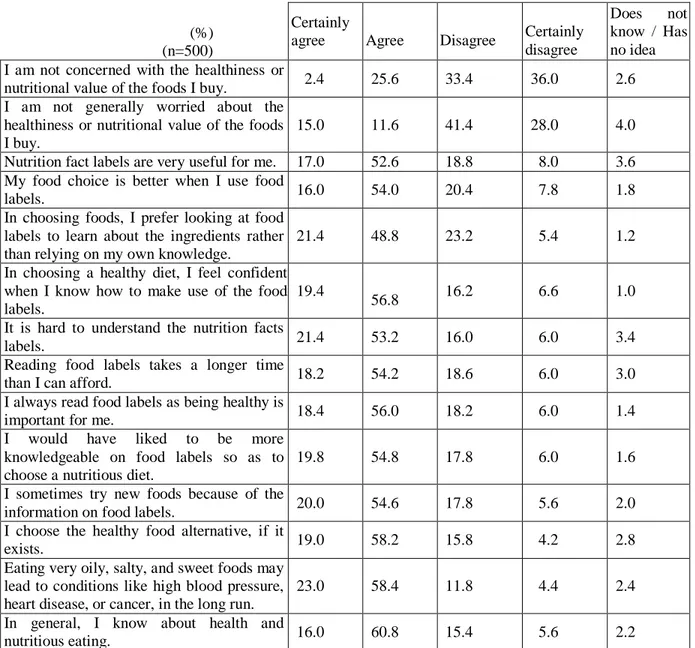
Attitudes of respondents toward a healthy diet, nutritious eating, and food labels are given in the next table. (Table 4)
Table 4 Attitudes toward a Healthy Diet, Nutritious Eating, and Food Labels
(%) (n=500)
Certainly
agree Agree Disagree Certainly disagree
Does not know / Has no idea I am not concerned with the healthiness or
nutritional value of the foods I buy. 2.4 25.6 33.4 36.0 2.6
I am not generally worried about the healthiness or nutritional value of the foods I buy.
15.0 11.6 41.4 28.0 4.0
Nutrition fact labels are very useful for me. 17.0 52.6 18.8 8.0 3.6 My food choice is better when I use food
labels. 16.0 54.0 20.4 7.8 1.8
In choosing foods, I prefer looking at food labels to learn about the ingredients rather than relying on my own knowledge.
21.4 48.8 23.2 5.4 1.2
In choosing a healthy diet, I feel confident when I know how to make use of the food labels.
19.4
56.8 16.2 6.6 1.0
It is hard to understand the nutrition facts
labels. 21.4 53.2 16.0 6.0 3.4
Reading food labels takes a longer time
than I can afford. 18.2 54.2 18.6 6.0 3.0
I always read food labels as being healthy is
important for me. 18.4 56.0 18.2 6.0 1.4
I would have liked to be more knowledgeable on food labels so as to choose a nutritious diet.
19.8 54.8 17.8 6.0 1.6
I sometimes try new foods because of the
information on food labels. 20.0 54.6 17.8 5.6 2.0
I choose the healthy food alternative, if it
exists. 19.0 58.2 15.8 4.2 2.8
Eating very oily, salty, and sweet foods may lead to conditions like high blood pressure, heart disease, or cancer, in the long run.
23.0 58.4 11.8 4.4 2.4
In general, I know about health and
nutritious eating. 16.0 60.8 15.4 5.6 2.2
81% of the respondents “agree” or “strongly agree” that “eating very oily, salty, and sweet foods may lead to conditions like high blood pressure, heart disease, or cancer, in the long run. On the other hand, percentage of those respondents who “disagree” or “strongly disagree” with this statement is 16. More than three fourths of the respondents “agree” or “strongly agree” that they choose the healthy food alternative, if it exists (77%), that, in general, they know about health and nutritious eating (77%), and that, in choosing a healthy diet, they feel confident when they know how to make use of the food labels (76%). 75% “agreement” was obtained for the following statements: “It is hard to understand the nutrition facts labels”, “I sometimes try new foods because of the information on food labels”, “I would have liked to know more how to use food labels to choose a nutritious diet”, and “I always read food labels as being healthy is important for me”. For 72% of the respondents, “reading food labels takes a longer time than they can afford”. In choosing foods, 70% prefer looking at food labels to learn about the ingredients, rather than relying on their own knowledge and another 70% agree that their food choice is better when they use food labels. “I am not concerned with the healthiness or nutritional value of the foods I buy” (69% disagreement rate) and “I am not generally worried about the healthiness or nutritional value of the foods I buy” (69% disagreement rate) are the two statements with which the respondents seem to “disagree” or “certainly disagree”, the most.
Table 5 Reasons for Not Using Labels
(%) (n=500)
Those who have signed the statement
Those who have not signed the statement I always purchase the same brands, based on my
habits and past positive experiences; there is no need to read labels.
39.0 61.0
I think my choice is healthy, therefore I do not
have to read labels. 26.0 74.0
I am too busy to read labels. 23.8 76.2
I do not have any health related problem; it will do
if I do not read labels. 19.2 80.8
There is too much information on labels; my mind
gets mixed up if I read them. 18.0 82.0
I am not worried; it does not concern me, I do not
have to read labels. 16.8 83.2
The only thing that affects my purchase decision is
the price of a product. 16.4 83.6
I am not interested; I cannot bother myself with
this. 15.8 84.2
I know that the product I purchased is unhealthy,
this is why I do not have to read its label. 15.8 84.2 I do not think that it is worth reading; there is no
use in reading it. 13.4 86.6
The relatively more frequently cited reasons for not reading food labels are the following: As the individual always purchases the same brands, based on his/her habits and past positive experiences he/she thinks that there is no need to read labels (%39); since he/she thinks that his/her choice is healthy, he/she does not have to read labels (26%); and the person is too busy to read labels (24%). With respect to price, 16% of the respondents have indicated price to be the only factor that affects their purchase decision. Percentage of those whose minds get mixed up if they read labels, as there is too much information on labels, is 18 and percentage of those who think that labels are not worth reading, and that there is no use in reading them, is 13. (Table 5)
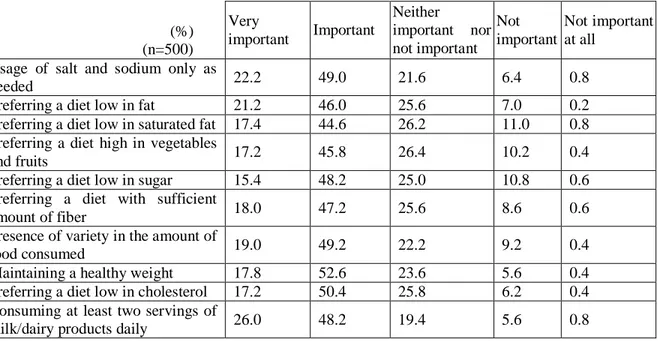
Table 6 Importance Given to Various “Healthy Diet” Suggestions (%) (n=500) Very important Important Neither important nor not important Not important Not important at all
Usage of salt and sodium only as
needed 22.2 49.0 21.6 6.4 0.8
Preferring a diet low in fat 21.2 46.0 25.6 7.0 0.2
Preferring a diet low in saturated fat 17.4 44.6 26.2 11.0 0.8 Preferring a diet high in vegetables
and fruits 17.2 45.8 26.4 10.2 0.4
Preferring a diet low in sugar 15.4 48.2 25.0 10.8 0.6
Preferring a diet with sufficient
amount of fiber 18.0 47.2 25.6 8.6 0.6
Presence of variety in the amount of
food consumed 19.0 49.2 22.2 9.2 0.4
Maintaining a healthy weight 17.8 52.6 23.6 5.6 0.4
Preferring a diet low in cholesterol 17.2 50.4 25.8 6.2 0.4
Consuming at least two servings of
milk/dairy products daily 26.0 48.2 19.4 5.6 0.8
Table 6 reveals that more than 60% of the respondents think that all of the stated “healthy diet” suggestions are either “important” or “very important”.
This percentage climbs up to 70‟s and above in case of “maintenance of a healthy weight” (70%), “usage of salt and sodium only as needed” (71%), and “consumption of at least two servings of milk/dairy products daily” (74%). Those suggestions that were found to be relatively “unimportant” (above 10% unimportance rate) seem to be “a diet low in saturated fat” (12%), “a diet high in vegetables and fruits” (11%), and “a diet low in sugar” (11%).
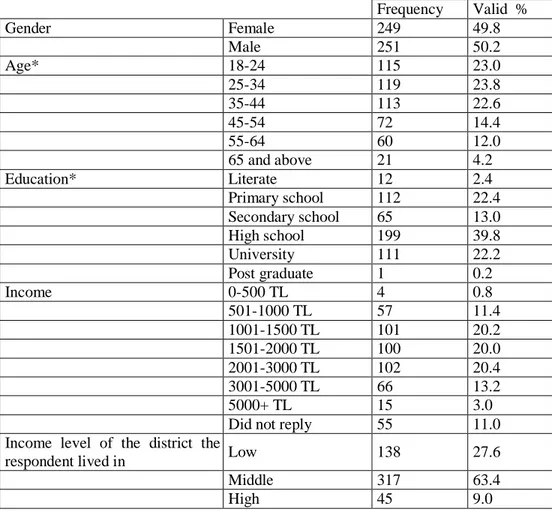
Table 7 Sample Characteristics
Frequency Valid % Gender Female 249 49.8 Male 251 50.2 Age* 18-24 115 23.0 25-34 119 23.8 35-44 113 22.6 45-54 72 14.4 55-64 60 12.0 65 and above 21 4.2 Education* Literate 12 2.4 Primary school 112 22.4 Secondary school 65 13.0 High school 199 39.8 University 111 22.2 Post graduate 1 0.2 Income 0-500 TL 4 0.8 501-1000 TL 57 11.4 1001-1500 TL 101 20.2 1501-2000 TL 100 20.0 2001-3000 TL 102 20.4 3001-5000 TL 66 13.2 5000+ TL 15 3.0
Did not reply 55 11.0
Income level of the district the
respondent lived in Low 138 27.6
Middle 317 63.4
High 45 9.0
*: “Age” variable was recoded into the following three categories:1:18-34, 2: 35-54, 3: 55 and above.
“Education” variable was recoded into the following three categories: 1: Literate, primary school, secondary school graduates, 2: high school graduates, 3: university and post- graduates.
Demographic characteristics of the respondents are presented in Table 7. Approximately, half of the respondents were female and the other half, male. About one fourth of the respondents were 18-24 years of age, one fourth were 25-34, another one fourth were 35-44, and the rest were over 44. With respect to education, literates made 2% of the sample; elementary school graduates were 22%, secondary school graduates were 13%, high school graduates were 40%, university graduates 22%, and post graduates were less than 1.Concerning income levels, one fifth of the respondents earned 1001-1500 TL, another one fifth, 1501-2000 TL, and still another one fifth, 2001-3000 TL, monthly. 28% of the respondents lived at a low income district while 63% lived at a middle income, and 9% at a high income district of the city. There were a few other questions on the questionnaire asking for information regarding the respondents perceived health status, eating habits, and health-related conditions, in general: When asked about the possible health-related condition(s) (such as high blood pressure/ cholesterol, asthma, diabetes, general health problems, food allergy, heart disease, weight problem, pregnancy, migraine, and/ or digestive problems) experienced either by the respondent or a member of his/her family, 14% replied affirmatively, 86% replied negatively. Percentage of those respondents who followed nutrition related news through written and visual media was 72.
These media sources were cited to be television (71%), newspapers (44%), radio (37%), internet (6%), books (5%), scientific journals (3%), and magazines (2%). 28% of the respondents indicated that they did not follow such news.
Analyses of research questions with respect to “gender”, “age”, “education”, “districts of the city respondents lived in”, and “follow-up of nutrition related news in the media” revealed the following results:
There is no statistically significant difference between males and females with respect to their frequency of “nutrition facts labels” readership (p>.05), their perceived “understandability” of nutrition fact labels (p>.05), and their follow-up of nutrition-related news in the media (p> .05). As for the differences, males seem to trust “light” (p=.014), “healthy” (p=.005), “extra skimmed” (p=.002); and “100% natural” (p=.032) claims more compared to females; females think to a greater extent than males that, in general, they are more knowledgeable on health and nutrition-related topics compared to males (p=.035) and they tend to give more importance to “presence of variety in the amount of food consumed” (p=.005); “maintenance of a healthy weight” (p=.018); “a diet low in cholesterol” (p=.014); and “consumption of at least two servings of milk/dairy products daily” (p=.008). With respect to reasons given for not reading labels, again females think to a greater extent than males that as “they always purchase the same brands, based on their habits and past positive experiences; there is no need to read labels” (p=.018).
Only a few statistically significant differences were revealed upon analyses conducted in case of the “age” and “education” variables:There is no statistically significant difference between the different age groups with respect to their perceived “understandability” of nutrition facts labels, the perceived trustworthiness of nutrition facts, and their follow-up of nutrition-related news in the media.Those who were above 55 years of age (given as 3 below) stated to a greater extent than the younger groups (given as 1=18-34; 2=35-54) that „they were not concerned with the healthiness or nutritional value of the food they bought‟ (λ²=24.133; df=2; p=.000) (p=.000 in case of 1&3; p=.000 in case of 2&3 upon pair-wise comparisons among the relevant groups, completed using the Mann-Whitney U Test), „they did not generally worry about these issues‟ (λ²=17.211; df=2; p=.000) (p=.001 in case of 1&3; p=.000 in case of 2&3), „they were not interested; they could not bother themselves with this‟ (λ²=42.247; df=2; p=.000) (p=.000 in case of 1&3; p=.000 in case of 2&3), „they were too busy to read labels‟ (λ²=16.130; df=2; p=.000) (p=.000 in case of 1&3; p=.003 in case of 2&3), „there was too much information on labels; their minds got mixed up if they read them‟ (λ²=24.491; df=2; p=.000) (p=.000 in case of 1&3; p=.000 in case of 2&3), „they knew that the product they purchased was unhealthy, this was why they did not have to read its label‟ (λ²=16.225; df=2; p=.000) (p=.000 in case of 1&3; p=.013 in case of 2&3), and gave importance to a diet low in fat more, compared to younger respondents. (λ²=15.531; df=2; p=.000) ) (p=.000 in case of 1&3; p=.000 in case of 2&3).On the other hand, those younger than 55 gave importance to consumption of many fruits and vegetables more, compared to those above 55. (λ²=9.493; df=2; p=.009) (p=.006 in case of 1&3; p=.003 in case of 2&3). With respect to the “education” variable, there is no statistically significant difference between respondents with different education levels with respect to their perceived “understandability” of nutrition facts labels, the perceived trustworthiness of nutrition facts, importance given to various “good-health” related suggestions, and follow-up of nutrition-related news in the media. Literates, primary and secondary school graduates (given as 1 below) stated to a greater extent than the other groups (high school graduates = 2 and university & post graduates = 3) that they always read food labels as being healthy was important for them (λ²=7.119; df=2; p=.028) (p=.033 in case of 1&2; p=.019 in case of 1&3 upon pair-wise comparisons among the relevant groups, completed using the Mann-Whitney U Test). On the other hand, university and post graduates thought to a greater extent than the other groups that they did not have any health related problem so it would do if they did not read labels. (λ²=17.005; df=2; p=.000) (p=.022 in case of 1&3, p=.000 in case of 2&3). University and post graduates stated to a greater extent than high school graduates that “they were not interested; they could not bother themselves with this issue” (λ²=8.198; df=2; p=.017) (p=.018 in case of 2&3) and that “they were too busy to read labels” (λ²=7.256; df=2; p=.027) (p=.008 in case of 2&3).
In case of the “districts the respondents lived in”, those living in high income districts of the city seem to read the following nutrition facts labels less compared to those living in both middle income and low income districts:
Cholesterol (λ²=6.965; df=2; p=.020) (p=.016 in case of low & high; p=.010 in case of middle and high income respondents upon pair-wise comparisons among the relevant groups, completed using the Mann-Whitney U Test), fiber(λ²=9.461; df=2; p=.009) (p=.022 in case of low & high; p=.006 in case of middle and high income respondents, vitamins, (λ²=7.456; df=2; p=.024) (p=.006 in case of low & high; p=.018 in case of middle and high income respondents, sodium/salt (λ²=9.148; df=2; p=.010) (p=.005 in case of low & high; p=.004 in case of middle & high income respondents , calcium (λ²=8.172; df=2; p=.017) (p=.008 in case of low & high; p=.006 in case of middle & high income respondents, iron(λ²=7.719; df=2; p=.021) (p=.013 in case of low & high; p=.006 in case of middle & high income respondents, other minerals (λ²=8.049; df=2; p=.018) (p=.005 in case of low & high; p=.009 in case of middle & high income respondents, percentage daily values (λ²=8.825; df=2; p=.012) (p=.003 in case of low & high; p=.020 in case of middle & high income respondents, claims like light, low fat, good source of fiber (λ²=6.325; df=2; p=.042) (p=.009 in case of low & high; p=.027 in case of middle & high income respondents, and nutrition facts per serving(λ²=7.708; df=2; p=.021) (p=.006 in case of low & high; p=.031 in case of middle & high income respondents. Those in high income districts seem to be concerned less with the healthiness or nutritional value of the foods they buy compared to respondents living in middle and low income districts. (λ²=22.036; df=2; p=.000) (p=.000 in case of low & high; p=.029 in case of middle & high income respondents). On the other hand, respondents living in middle income and low income districts seem to agree with the following statements more compared to respondents living in high income districts: “It is hard to understand the nutrition facts labels” (λ²=10.253; df=2; p=.006) (p=.004 in case of low & high; p=.002 in case of middle & high income respondents); “Reading food labels takes a longer time than I can afford” (λ²=13.589; df=2; p=.001) (p=.001 in case of low & high; p=.008 in case of middle & high income respondents) ; “I always read food labels since being healthy is important for me” (λ²=8.122; df=2; p=.017) (p=.008 in case of low & high; p=.035 in case of middle & high income respondents); “I sometimes try new foods because of the information on food labels” (λ²=11.419; df=2; p=.003) (p=.003 in case of low & high; p=.001 in case of middle & high income respondents).
Frequency of nutrition facts label readership in each and every one of the label elements is higher among those who follow nutrition-related news through media compared to those who do not follow such news: Energy (calories) (p=.000); Protein (p=.000); Total fat (p=.002); Saturated fat (p=.003); Cholesterol (p=.000); Carbohydrates (p=.001); Fiber (p=.000); Vitamins (p=.001); Sodium/salt ratio (p=.001); Calcium (p=.004); Iron (p=.000);Other minerals (p=.000); Percent daily values (p=.000); Claims like low fat, light, high fiber (p=.000); Nutrition facts (calories, protein, fat..) per serving (p=.002). Those who follow nutrition-related news seem to think to a greater extent that their “food choice is better when they use food labels (p=.008); “in choosing foods, they prefer looking at food labels to learn about the ingredients rather than relying on their own knowledge” (p=.008); “in choosing a healthy diet, they feel confident when they know how to make use of the food label (p=.007); “they always read food labels since being healthy is important for them (p=.022); “they would like to be more knowledgeable on food labels so they could choose a nutritious diet (p=.006); “they choose the healthy food alternative, if it exists” (p=.049); compared to those who do not. Besides, those who follow nutrition-related news believe the following suggestions to be more important compared to those who do not: “Usage of salt and sodium only as needed” (p=.000); “preferring a diet low in fat” (p=.000); “preferring a diet low in saturated fat” (p=.003); “preferring a diet high in vegetables and fruits” (p=.000); “preferring a diet low in sugar” (p=.001); “preferring a diet with sufficient amount of fiber” (p=.000); “presence of variety in the amount of food consumed” (p=.000); “maintaining a healthy weight” (p=.000); “preferring a diet low in cholesterol” (p=.000); “consuming at least two servings of milk/dairy products daily” (p=.000).
5. Conclusions and Implications
Turkish consumers‟ prevailing opinions, perceptions, attitudes, and self-reported practices regarding the topic of nutrition labeling are assessed in this study. The findings reveal that an approximate 20% of the respondents „always‟, 25% „usually‟, and 30% „sometimes‟ read nutrition labels; on the other hand, the remaining 25% either read nutrition labels very rarely or do not read them at all. Findings with respect to each one of the individual elements of the nutrition facts label, attitudes toward a healthy diet, nutritious eating, food labels, and follow-up of nutrition related news in the media all point out to the same conclusion, as well: About 25 to 30% of the respondents do not care about or are not even aware of, interested in, worried about, concerned with or willing to know more about these issues. Yet, given the worldwide increase in diet-related diseases, nutrition labeling, being one of the potential remedies for this problem, seems to be a public health necessity.
If consumers are not knowledgeable enough about nutritious eating and if they do not care about it, it is highly probable that they will be faced with health-related diseases at some point in their lives. So, there is a need for consumers, in the first place, to be aware of the importance of nutrition label use and its benefits together with their responsibilities in maintaining a healthy life. As such, consumers, as well as both the state and the industry, inclusive of food manufacturers and retailers, all have significant roles to play with regard to this vital topic of consideration. How to educate and motivate people to be enthusiastic enough to learn more about the life-time benefits of a healthy diet and nutritious eating needs to be studied carefully and necessary actions should be taken by both governmental bodies and food manufacturers. Nutrition information needs to be given in a way that is both meaningful and useful to the average consumer and the government should conduct research so as to decide on the information to be disclosed. The nutrition label is an important vehicle that food manufacturers can use to communicate essential information about the nutritional value and composition of their product so that consumers can make informed decisions about their diet and lifestyle. (Wills et al., 2009) Food manufacturers may be encouraged to use nutrition labels to a greater extent. Since time spent on shopping is quite limited for many people in today‟s world, nutrition labels should be designed so as to enable consumers understand the relevant information quickly and easily. Educational information about the benefits and use of nutrition labels should be offered to the general public at point of purchase displays in grocery stores, supermarkets, and other food retailers. One of the findings of the study reflects that the percentage of those whose minds got mixed up if they read labels, as there is too much information on labels, is 18. To deal with this confusion, terminology used on labels should be meaningful and understandable to the general public. Percentage of those who state that they are too busy to read labels is 24. Hence, the use of a standardized and simple format that is easy and quick to comprehend would assist time-lacking consumers in using food labels and in comparing foods. (Wem, 2002) Besides the Ministry of Food, Agriculture and Livestock and the Ministry of Health, food manufacturers should also be involved in public education activities, through employing knowledgeable and helpful sales personnel, providing consultancy services to consumers in stores. (Karabiber & Hazer, 2010)
At the same time, labeling regulations might be revised at the governmental level. Incentives may be provided to food manufacturers to develop products that promote public health (Wem, 2002) by “reducing the fat, sugar, and salt content of processed foods, ensuring that healthy and nutritious choices are available to all consumers, practicing responsible marketing, ensuring the availability of healthy food choices and supporting regular physical activity practice in the workplace” (WHO, 2011b) and hence assisting consumers in following dietary recommendations.With respect to the perceived trustworthiness of various claims on food labels, 50 to 60 % of the respondents perceived all of the listed claims to be either “trustworthy or very trustworthy” while the distrust dimension weighed more for about 40 to 46%. As Vyth et al. (2009) point out, the literature shows that consumers‟ trust in information on food labels would increase if there is a clear trustworthy sender. Hence, it might be a good idea to deliver such information through scientists and health professionals, in the first place, as industry is usually perceived to be less trustworthy. Given the results of analyses regarding follow-up of nutrition related news in the media, it can be concluded that follow-up of news creates a significant awareness of, interest in, and knowledge about health-related considerations, inclusive of nutrition label use. Introduction of related courses in school curricula, taking into consideration today‟s children, who will become tomorrow‟s parents is of course one of the major steps to take for the well-being of future generations.
Nevertheless, building upon the above finding, for today‟s consumers, media should be used to the greatest possible extent and through conferences, seminars, television programs, etc., the learning process of, at least, the “interested/ concerned” individuals should be enhanced. However, for any consumer education campaign to be effective, it must be directed at individuals who are less likely to use food labels. As such, these individuals may be encouraged to get interested in and educated through by highlighting the ill health element of poor nutrition. Such messages may be more effective in convincing consumers to use food labels than strategies emphasizing specialized knowledge about the nutrient content of foods. (Nayga, 2000). Analyses regarding the basic demographic variables have not resulted in numerous statistically significant differences among the studied respondent groups; nevertheless, by looking at the results, it may be suggested that those respondents who are above 55 years of age, who are university/post graduates, and who live in high income districts of the city should be targeted in a sensitive manner and differing levels of effort should be directed at them, as they seem to be the least “interested/concerned” parties with respect to their attitudes, opinions, and self-reported practices on nutritious eating, healthy diet, and nutrition labels.
Awareness with respect to the benefits of nutrition label use may also be increased by researchers through further research in this area. Even the questionnaires used for the present study aroused awareness and considerable attention among the majority of respondents. Through regular research, public sensitivity on health-related considerations may be increased, at least to a higher extent, using both print and broadcast media as a means of communicating the results of such studies to the public.
Inclusion of some self-reported practices may be considered to be a limitation of this study as self-reported practices are blamed for possibly not reflecting actual behavior due to social desirability bias (Redmond & Griffith, 2003). Yet, it should not be forgotten that they provide valid information on awareness and also whether consumers have at least some knowledge about “correct” behaviors even if they may not exercise these behaviors all of the time. Nevertheless, future research should consider this potential shortcoming and observe individual behaviors, as well, besides asking for respondents‟ replies.
Although this study pertains to the prevailing situation in the Turkish market, implications of the study may be applicable in other countries as well, where nutrition labeling is not mandatory at least for the time being. As Wem (2002) puts, nutrition labeling by itself cannot solve nutrition problems. It should be seen as one of the elements of nutrition policy and should be evaluated in the larger perspective of consumer education, which in its turn is part of an overall development policy. Exchange of information at the regional and sub-regional level is also important, as each country can learn from the experience of others and regional coordination and cooperation can be developed. (Wem, 2002).
6. References
Barreiro-Hurlé, J., Gracia, A., & Magistris, T. (2010). Does nutrition information on food products lead to healthier food choices?. Food Policy, 35, 221-229.
Bozkir, E. (2009). Yetişkin tüketicilerin besin satın alma davranışı üzerine etiket bilgilerinin etkisi. Unpublished Master Thesis. Hacettepe University Health Sciences Institute , Nutritional Science Program.
Byrd-Bredbenner, C., Alfieri, L., & Kiefer, L. (2000). The nutrition label knowledge and usage behaviors of women in the US. Nutrition Bulletin, 25, 315-322.
Cheftel, J. C. (2005). Food and nutrition labeling in the European Union. Food Chemistry, 93, 531-550.
Cowburn, G., & Stockley, L. (2005). Consumer understanding and use of nutrition labeling: a systematic review. Public Health Nutrition, 8, (1), 21-28.
Drichoutis, A. C., Lazaridis, P., & Nayga, R.M. (2006). Consumers‟ use of nutritional labels: a review of research studies and issues. Academy of Marketing Science Review, 9, [Online] Available: http://www.amsreview.org/articles/drichoutis09-2006.pdf
Feunekes, G. I.J., Gortemaker, I.A., Willems, A.A., Lion, R., & Van Den Kommer, M. (2008). Front-of-pack nutrition labeling: testing effectiveness of different nutrition labeling formats front-of-pack in four European countries. Appetite, 50, 57-70.
Food Standards Agency. (2010). Public attitudes towards, and use of, general food labelling. Social Science Research Unit Oxford Evidentia, Unit Report 4..
Govindasamy, R., & Italia, J. (1999). The Influence of Consumer Demographic Characteristics on Nutritional Label Usage. Journal of Food Products Marketing, 5,(4),55-68.
Grunert, K. G., Wills, J.M., & Fernández-Celemín, L. (2010a). Nutrition knowledge, use and understanding of nutrition information on food labels among consumers in the UK. Appetite, doi:10.1016/j.appet.2010.05.045.
Grunert, K.G., Fernández-Celemín, L., Wills, J.M., Bonsmann, S.S.G., & Nureeva, L. (2010b). Use and understanding of nutrition information on food labels in six European countries. Journal of Public Health, DOI 10.1007/s10389-009-0307-0, published with open Access at Springerlink.com.
Grunert, K.G., & Wills, J.M. (2007). A review of European research on consumer response to nutrition information on food labels. Journal of Public Health, 15: 385-399.
International Food Information Council (IFIC) Foundation (2010), 2010 Food & health survey: consumer attitudes toward food safety, nutrition & health. [Online] Available: http://www.foodinsight.org /Resources/Detail.aspx?topic=2010_Food_Health_Survey_Consumer_Attitudes_Toward_Food_Safety_Nutriti on_Health (Dec. 17, 2010) International Food Information Council (IFIC) FOUNDATION. (2009). 2009 Food and health survey: Consumer attitudes toward food, nutrition, and health. [Online] Available: http://www.foodinsight.org/Content/6/IFIC%20Fndtn%20Info%20Sources%20Opinion%20Leader%20Web% 20Cast%20 Deck.07.29.09.pdf (Dec. 17, 2010)
Karabiber, C., & Hazer, O. (2010). Tüketicilerin bilgi kaynağı olarak gıda ürünlerindeki etiketi okuma ve anlamada karşılaştıkları sorunların incelenmesi. Hacettepe Üniversitesi Tüketici-Pazar-Araştırma-Danışma Test ve Eğitim Merkezi Tüketici Yazıları II, 253-270.
Kelly, B., Hughes, C., Chapman, K., Louie, C., Dixon, H., Crawford, J., King, L., Daube, M., & Slevin, T. (2009). Consumer testing of the acceptability and effectiveness of front-of-pack labeling systems for the Australian grocery market. Health Promotion International, 24, (2), 120-129.
Marietta, A.B., Welshimer, K. J., & Anderson, S.L. (1999). Knowledge, attitudes, and behaviors of college students regarding the 1990 nutrition labeling education act food labels. Journal of the American Dietetic Association, 99, 445-449.
Mhurchu, C.N., & Gorton, D. (2007). Nutrition labels and claims in New Zealand and Australia: a review of use and understanding. Australian and New Zealand Journal of Public Health, 31, (2), 105-112.
Misra, R. (2007). Knowledge, attitudes, and label use among college students. Journal of the American Dietetic Organization, 107, 2130-2134.
Nayga, R.M. (2000). Nutrition knowledge, gender, and food label use. The Journal of Consumer Affairs, 34, (1), 97-112. Nayga, R. M., Lipinski, D., & Savur, N. (1998). Consumers‟ use of nutritional labels while food shopping and at home.
The Journal of Consumer Affairs, 32, (1), 106-120.
Nayga, R.M. (1996). Determinants of consumers‟ use of nutritional information on food packages. Journal of Agricultural and Applied Economics, 28, (2), 303-312.
Neuhouser, M. L., Kristal, A.R., & Patterson, R.E. (1999). Use of food nutrition labels is associated with lower fat intake. Journal of the American Dietetic Association, 99, 45-50,53.
Nielsen Malaysia. (2005), The label-conscious global shopper – only partly understanding food labels, but selective
nonetheless. Aug. 15, [Online] Available: http://my.nielsen.com /news/20050815 (June 22, 2010) Nørgaard, M. K., & Brunsø, K. (2009). Families‟ use of nutritional information on food labels. Food Quality and
Preference, 20, 597-606.
Obayashi, S., Bianchi, L., & Song, W. (2003). Reliability and validity of nutrition knowledge, social-psychological factors, and food label use scales from the 1995 diet and health knowledge survey. Journal of Nutrition Education and Behavior, 35, (2), 83-92.
Peters-Texeira, A., & Badrie, N. (2005). Consumers‟ perception of food packaging in Trinidad, West Indies and its related impact on food choices. International Journal of Consumer Studies, 29, (6), 508-514.
Redmond, E. C. and Griffith, C.J. (2003). Consumer food handling in the home: a review of food safety studies. Journal of Food Protection, 66 (1):130-161.
Satia, J.A., Galanko, J.A., & Neuhouser, M.L. (2005). Food nutrition label use is associated with demographic, behavioral, and psychosocial factors and dietary intake among African Americans in North Carolina. Journal of the American Dietetic Association, 105,(3),392-402.
Svederberg, E., Gustaffson, J.E., Reuterswärd, A. L., & Svensson, L. (2008). Influence of previous experiences on consumers' reading and use of nutritional information on food packages. A questionnaire study involving structural equation modeling. Journal of Culinary Science & Technology, 6, (2), 192-205.
Unusan, N. (2004). Preschool teachers‟ attitudes towards nutritional information on food labels in Turkey and
recommendations for an educational programme. Early Child Development and Care, 174, (7), 629 – 638. Viswanathan, M., Hastak, M., & Gau, R. (2009). Understanding and facilitating the usage of nutritional labels by
low-literate consumers. Journal of Public Policy & Marketing, 28, (2), 135-145.
Vyth, E.L., Steenhuis, I.H.M., Mallant, S.F., Mol, Z.L., Brug, J., Temminghoff, M., Feunekes, G.I., Jansen, L., & Verhagen, H. (2009). A front-of-pack nutrition logo: a quantitative and qualitative process evaluation in the Netherlands. Journal of Health Communication, 14, 631-645.
Wem, A. van den Wijngaart (2002). Nutrition labeling: purpose, scientific issues and challenges. Asia Pacific Journal of Clinical Nutrition, 11, (2), S68-S71.
WHO (World Health Organization) (2011a), [Online] Available: http://www.who.int/ topics/ diet/en/ (July 11, 2011) WHO (World Health Organization) (2011b), [Online] Available: http://www.who.int/ mediacentre/factsheets
/fs311/en/index.html (July 11, 2011) Wills, J.M., Schmidt, D.B., Pillo-Blocka, F., & Cairns, G. (2009). Exploring global consumer attitudes toward nutrition
information on food labels. Nutrition Reviews, 67, (Suppl.1), S102-S106. Notes
The research instrument, Mann-Whitney U Test results with respect to “gender” and “follow-up of nutrition related news in the media” and Kruskal-Wallis Test results with respect to “age”, “education”, and the “districts of the city respondents live in” can be obtained from the author, upon request.