STRUCTURAL STUDIES OF NMDA RECEPTOR AND
XANTHINE OXIDASE ENZYME
MEL˙IS GENCEL
MASTER’S THESIS
Submitted to the Graduate School of Science and Engineering of
Kadir Has University in partial fulfillment of the requirements for the degree of Master of Science in Program of Computational Biology and Bioinformatics
TABLE OF CONTENTS
ABSTRACT . . . i ¨ OZET . . . iii ACKNOWLEDGEMENTS . . . v DEDICATION . . . viLIST OF TABLES . . . vii
LIST OF FIGURES . . . viii
LIST OF SYMBOLS/ABBREVIATIONS . . . x
I
CHAPTER I
xii
1. INTRODUCTION . . . 11.1 Glutamate Receptors . . . 1
1.2 N-Methyl-D-Aspartate (NMDA) Receptors . . . 2
1.3 Topology of NMDA . . . 3
1.4 Structural and Dynamics Studies of NMDA . . . 5
2. THEORY AND METHOD . . . 10
2.1 Molecular Dynamics Simulations of Membrane Protein and its Limitations . . . 10
2.1.1 Molecular Dynamics . . . 10
2.1.2 Limitations of Molecular Dynamics Simulation . . . 13
2.1.3 Limitations of Membrane Protein Simulations . . . 14
2.2 Principal Component Analysis (PCA) . . . 15
2.3 Structure Preparation and Simulation Parameters . . . . 17
3. RESULTS AND DISCUSSION . . . 21
3.1 ATD Conformational Rearrangement Upon Glutamate and Glycine Binding . . . 22
3.2 Inter/Intra-domain Motions of LBD Upon Glutamate and Glycine Binding . . . 24
3.3 Conformational Changes in TMD . . . 28
3.4 Principal Component Analysis (PCA) . . . 35
4. CONCLUSIONS . . . 47
II
CHAPTER II
50
5. INTRODUCTION . . . 515.1 Xanthine Oxidase . . . 51
6. THEORY AND METHODS . . . 53
6.1 Molecular Docking . . . 53
6.2 Docking . . . 54
7. RESULTS AND DISCUSSION . . . 56
7.1 Analysis Of Binding Free Energies And Binding Poses. . . 56
8. CONCLUSIONS . . . 60
STRUCTURAL STUDIES OF NMDA RECEPTOR AND XANTHINE OXIDASE ENZYME
ABSTRACT
The first part of the thesis deals with the structural studies of N-Methyl-D-Aspartate receptors (NMDARs). NMDARs are ionotropic ligand-gated receptors that have pivotal roles at the central neuronal system but, hyperactivity of NMDARs could contribute to neurodegenerative diseases. Therefore, understanding the activation mechanism of NMDARs is important as it may lead to the development of new treatments for neurodegenerative diseases.
In this thesis, human GluN1/GluN2A type NMDAR is modeled based on GluN1/GluN2B type NMDA structures that were resolved in 2014. To observe the dynamics of NMDA, 1.3 microseconds molecular dynamics simulations are performed for ligand-free and ligand-bound structures in the physiological environment. RMSD, RMSF, and PCA have been used to analyze the trajectory to understand the di↵erences in ligand-free and ligand-bound structures collective motions.
From these analyses, the di↵erences in between ligand-free and ligand-bound simulations can be summarized as the following: Ligand-binding domain closure is observed, and these rearrangements are reflected to the transmembrane linkers upon ligand binding. Correlation maps from PCA analysis display more correlated motions in ligand-bound simulations. As a summary, mainly ligands act like an adhesive for the binding-domain by bringing the bi-lobe structures together and consequently, this is reflected in the overall dynamics of the protein.
In the second part of this thesis, Xanthine Oxidase (XO) enzyme has been studied for the potency of bis-chalcones compounds. 8 bis-chalcones compounds that were
provided to us from Serdar Burmalıo˘glu’s research group, showed high inhibition behavior on XO. These 8 molecules are docked to XO catalytic unit and 1000 run is performed for each compound. All compounds show better results than its approved drug which is allopurinol, however, the best ones are fifth and seventh compounds. In addition, all these compounds have three similar binding modes but, the first pose has the lowest free binding energy.
Keywords: NMDA, Molecular Dynamics Simulations, PCA, XO,
NMDA RESEPT ¨OR ¨UN ¨UN VE KSANT˙IN OKS˙IDAZ ENZ˙IM˙IN˙IN YAPISAL C¸ ALIS¸MALARI
¨
OZET
Tezin ilk b¨ol¨um¨unde, N-Metil-D-Aspartat resept¨orlerinin yapısal ¸calı¸smalarından bahsedilmi¸stir. NMDAR, merkezi sinir sisteminde ¨onemli rollere sahip olan iyonotropik ligand kapılı resept¨orlerdir, ancak ancak NMDAR’ların hiperaktivitesi, n¨orodejeneratif hastalıklara neden olmaktadır.Bu y¨uzden NMDAR mekanizmasının anla¸sılması n¨orodejeneratif hastalıklar i¸cin yeni tedavilerin geli¸stirilmesinde ¨onemli bir rol oynamaktadır.
Bu tezde, insan GluN1/GluN2A tipi NMDAR, 2014 yılında ¸c¨oz¨ulm¨u¸s olan GluN1/GluN2B tipi NMDAR X-ray yapılarına g¨ore modellenmi¸stir. NMDAR dinamiklerini g¨ozlemlemek i¸cin ligand-olmayan ve ligand-ba˘glı yapılar, 1.3 mikro saniye molek¨uler dinamik sim¨ulasyonu kullanılarak ko¸sturulmu¸stur. Yapıların kolektif hareketlerinin farklılıklarını anlamak ve y¨or¨ungeyi analiz etmek i¸cin RMSD, RMSF ve temel bile¸sen analizleri kullanılmı¸stır.
Bu analizler sonucunda, ligant i¸cermeyen ve ligant ba˘glı sim¨ulasyonlar arasındaki farklar a¸sa˘gıdaki gibi ¨ozetlenebilir; ligant ba˘glandı˘gı b¨olgede kapanmaya sebep olurken de˘gi¸simlerin transmembrane ilmeklerine yansıdı˘gı g¨or¨ulm¨u¸st¨ur. Korelasyon grafiklerine g¨ore ligant ba˘glanması ile korelasyonların arttı˘gı g¨ozlemlenmi¸stir. Ligant, ba˘glandı˘gı b¨olgede bir yapı¸stırıcı g¨orevi g¨or¨ur ve ba˘glandı˘gı b¨olgenin loblarını birlikte tutarak di˘ger alanların hareketini artırmaktadır.
˙Ikinci b¨ol¨umde, bis-kalkon bile¸siklerinin ksantin oksidaz (XO) enzimi ¨uzerindeki inhibisyon etkisi dok ¸calı¸smaları ile g¨ozlemlenmi¸stir. Serdar Burmalıo˘glu ara¸stırma grubu tarafından sa˘glanan 8 bis-kalkon bile¸sikler, XO ¨uzerinde y¨uksek inhibisyon g¨ostermektedir. Bu ¸calı¸smada sentezlenen 8 molek¨ul XO katalitik birimine dok
edilmi¸stir. B¨ut¨un bile¸sikler FDA onaylı allopurinolden daha iyi sonu¸c g¨ostermi¸stir. En iyi sonu¸c be¸sinci ve yedinci bile¸siklerde g¨or¨ulm¨u¸st¨ur. Buna ek olarak b¨ut¨un bile¸siklerde 3 benzer dominant poz g¨ozlenmi¸stir. ˙Ilk poz en d¨u¸s¨uk ba˘glanma enerjisine sahiptir.
Anahtar S¨ozc¨ukler: NMDA, Molek¨uler Dinamik Sim¨ulasyonları, PCA, XO, AutoDock, bis-kalkonlar
ACKNOWLEDGEMENTS
I am greatly thankful to my advisor, Asst. Prof. S¸ebnem ES¸S˙IZ for helpful discussions, guidance, and support. She taught me how good research should be done, and she always encouraged me in this process. Besides my advisor, I would like to thank the rest of my thesis committee: Prof. Dr. Kemal YELEKC¸ ˙I and Assoc. Prof. Dr. Barı¸s B˙INAY for the time that they devote to read and their insightful comments.
I am really thankful to my friends for their whose encouragements and support helped me a lot during my Master. Especially I thank my colleagues Ayhan Demir, Muhammed Aktolun, Nuray S¨o˘g¨unmez, Burak Servili and Merve Ayyıldız for their support.
Last but not least, I would like to express my gratitude to my parents for their endless support and understanding for no matter what.
This work was supported by the Scientific and Technological Research Council of Turkey (T ¨UB˙ITAK) under the grant No: 114Z687.
LIST OF TABLES
Table 2.1 Time scale of motions . . . 14 Table 7.1 Estimated binding free energies of eight compounds . . . 57
LIST OF FIGURES
Figure 1.1 Subfamilies of the glutamate receptors. . . 2
Figure 1.2 Topology of NMDAR . . . 5
Figure 1.3 Electron microscope pictures of antagonist-bound NMDAR . . . 6
Figure 2.1 The representation of membrane and protein . . . 18
Figure 2.2 The representation of simulation box . . . 19
Figure 3.1 The RMSD plot of apo and halo simulations . . . 21
Figure 3.2 Conformational changes of ATD upon ligand binding. . . 22
Figure 3.3 Diagonal distance between pre-determined residues in LBD. . . . 24
Figure 3.4 Intra/Inter-domain motion analysis of LBD. . . 26
Figure 3.5 Distance change of TMD girdle after ligand binding. . . 28
Figure 3.6 Alignment of the narrowest (Halo-gray) and widest (Halo-colored) states of the bottom gate. . . 30
Figure 3.7 Alignment of the narrowest (Apo-gray) and widest (Halo-colored) states of the upper gate . . . 31
Figure 3.8 Distance change of M3/S2 linker between subunits. . . 32
Figure 3.9 Root-mean-square fluctuations (RMSF) graphs of separate subunits. . . 34
Figure 3.10 Principal component analysis . . . 36
Figure 3.11 First mode of GluN1 subunits of apo and halo simulation from PCA . . . 38
Figure 3.12 First mode of GluN2A subunits of apo and halo simulation from PCA . . . 39
Figure 3.13 The rotation between two extreme structures that is taken from PCA first mode. . . 41
Figure 3.14 Correlation maps of A)GluN11 and B)GluN2A1 subunits. . . 43
Figure 3.15 Correlation maps of A)GluN12 and B)GluN2A2 subunits. . . 44
Figure 7.1 X-ray (yellow) and docked (orange) positions A) Quercetin and B) Salicylic Acid . . . 56 Figure 7.2 Binding Free Energies for eight compounds . . . 58
LIST OF SYMBOLS/ABBREVIATIONS
˚ A Angstrom ↵ Alpha Beta Gamma Delta ✓ Theta p Pi S Sigma w Omega K Kelvin 3D Three DimensionalADT AutoDock Tools
ALA Alanine
AMPA -amino-3-hydroxyl-5-methyl-4-isoxazole-propionate
AMPAR -amino-3-hydroxyl-5-methyl-4-isoxazole-propionate Receptor
ARG Arginine
ASN Asparagine
ASP Aspartic Acid
ATD Amino Terminal Domain
C Carbon
C↵ Carbon Alpha
CNS Central Nervous System
CTD Carboxy Terminal Domain
CYS Cysteine
fs Femtosecond
iGluR Ionotropic Glutamate Receptor
LBD Ligand Binding Domain
LEU, L Leucine
LGA Lamarckian Genetic Algorithm
LYS, K Lysine
MD Molecular Dynamics
mGluR Metabotropic Glutamate Receptor
NMDA N-methyl-D-aspartate
NMDAR N-methyl-D-aspartate Receptor
NMR Nuclear Magnetic Resonance
ns Nanosecond
PCA Principal Component Analysis
PDB Protein Data Bank
PHE Phenylalanine
PME particle-mesh Ewald
POPC Palmitoyl-oleoyl phosphatidylcholine
ps Picosecond
RMSD Root Mean Square Deviation
RMSF Root Mean Square Fluctuation
SER Serine
THR Threonine
TMD Transmembrane Domain
VAL Valine
XO Xanthine Oxidase
XOI Xanthine Oxidase Inhibitor
PART I
1. INTRODUCTION
1.1 Glutamate Receptors
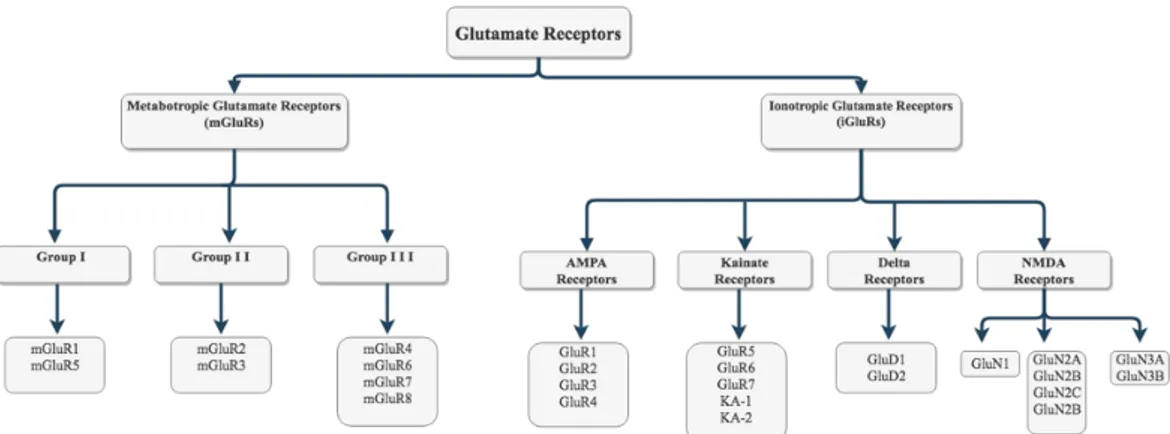
The cell membrane consists of phospholipid bilayers which form a semi-permeable barrier. This barrier encloses the interior of the cell from out. Ion channels are macromolecular protein complexes that occupy the lipid double layer of the cell membrane. Ion channels facilitate ion flux throughout this layer. The passage of the ions to the membrane is vital for all life forms and is preserved from bacteria to humans. Regulation of ion flux is important in membrane potential regulation, hormone secretion, regulation of cell volume, ion flow to the cell, and memory learning (Hille, 2001). Thus, ”channelopathies” which is the dysfunction of ion channels are the main reason for common diseases’ such as Alzheimer’s, Parkinson’s, Huntington’s, epilepsy, and schizophrenia (E Stafstrom, 2001). Therefore, developing therapeutic agents for central neuronal systems (CNS) disease by targeting ion channels has become one of the major research topics. Almost half of the neurons in the mammalian brain use glutamate as a neurotransmitter. Glutamate is present in high concentrations in the cerebrospinal fluid. It can pass through the blood-brain barrier at presynaptic neuron terminals. A type of ligand-gated ion channel, glutamate receptors need binding of glutamate to be activated. (M. Chen et al., 2008; Lisman et al., 2007). According to their molecular composition, electrophysiological and pharmacological properties, glutamate receptors are subdivided into two large groups: Ionotropic glutamate receptors (iGluRs) and metabotropic glutamate receptors (mGluRs) (Nakanishi, 1992; Niswender and Conn, 2010) (Figure 1.1).
Figure 1.1 Subfamilies of the glutamate receptors.
Metabotropic receptor family (mGluR1-8), regulates electrical stimulation through activation of various secondary messengers. mGluRs are divided into three groups; Group I (mGluR1 and mGluR5), Group II (mGluR2 and mGluR3) and Group III (mGluR4, mGluR6, mGluR7, and mGluR8) (Nakanishi, 1992; Niswender and Conn, 2010). Group I metabotropic glutamate receptors are located in the postsynaptic somatodentritic area. They cooperate with other postsynaptic glutamate receptors to accelerate ligand-dependent ion channels activation. Group II and III mGluR serve as auto-receptors that inhibit glutamate release (Dwivedi and Pandey, 2011). The ionotropic glutamate receptors (iGluRs), also named as ligand-gated ion channels work via Ca2+, consist of 4 sub-groups; a-amino-3-hydroxy-5-methyl-4
isoxazolepropionic acid (AMPA) receptors (GluR1-4), kainate receptors (GluR5-7, KA-1 and KA-2), N-methyl-D-aspartate (NMDA) receptors (GluN1, GluN2A-D and GluN3A-B) and receptors (GluD1 and GluD2) (Traynelis et al., 2010) (Figure 1.1). AMPA, kainate and NMDA receptors are found in synaptic regions. Combination of these receptors determines the amplitude and kinetics of postsynaptic currents (Lester et al., 1990).
ion channels, NMDARs have magnesium (Mg2+) binding site in the channel
vestibule (Kupper et al., 1996). Mg2+ is a channel blocker and released after
agonist binding. After Mg2+ removal, calcium ion can pass through to cell and
trigger di↵erent cellular processes. Ligand binding induces three di↵erent states in the receptor; open state, desensitization, and closed (Lester et al., 1990; Lester and Jahr, 1992). All these states occurrence probability is equal (Popescu et al., 2004). NMDARs are essential for CNS and have pivotal roles at neurotransmission and synaptic plasticity. However, overactivation of NMDARs could lead to neurodegenerative diseases like Alzheimer’s (Arundine and Tymianski, 2003). Therefore, NMDARs have become a hot topic to study for developing neuroprotective agents.
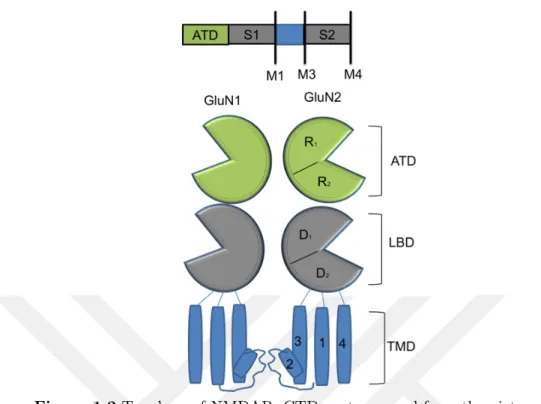
1.3 Topology of NMDA
Each subunit of NMDA has an amino-terminal domain (ATD), a ligand-binding domain (LBD), three transmembrane domains (TMD) (M1, M3, and M4), a re-entrant loop (M2) and a carboxyl-terminal domain (Ryan et al., 2008) (Figure 1.2). ATD adopts bi-lobed shaped and looks like a clamshell. These lobes named as R1 and R2 and they linked to each other with three well defined loops (Karakas et al., 2009) (Figure 1.2). ATD allosterically regulates the activation and inhibition of NMDA and has a binding site for modulators like Zn2+, phenylethanolamine, and
polyamine (Fayyazuddin et al., 2000; Gallagher et al., 1997; Gielen et al., 2009; Hatton and Paoletti, 2005; Mony et al., 2009; Perin-Dureau et al., 2002; Rachline et al., 2005; Traynelis et al., 1995). In contrary, ATD does not have a role in the activation of AMPA and kainate receptors. (Dutta et al., 2012). Hence, ATD plays a role not only in assembly and modulation but also trafficking of the receptor (Qiu et al., 2009).
LBD is formed from two extended sequences called S1 and S2 (Stern-Bach et al., 1994). The region between ATD and M1 called S1 and part between M3 and M4 named as S2. LBD structural shape is similar to the clamshell like domains and lies in the extracellular part of the cell. GluN1 and GLuN2 subtypes form an asymmetric unit for LBD and arranged themselves back-to-back fashion. Upon ligand-binding, LBD clamshell closes and leads to ion channel activation (Kleckner and Dingledine, 1988; Lerma et al., 1990). While glycine or endogenous D-serine (co-agonist) binds to GluN1, glutamate is the natural ligand of GluN2 (Shleper et al., 2005). Hence, it is suggested that LBD and ATD coupling is crucial in terms of ion channel modulation (Gielen et al., 2009; Krupp et al., 1998; Lester et al., 1990; Traynelis et al., 2010). The transmembrane domain is placed in the cell membrane and has 3 helixes as M1, M3, and M4 and a re-entrant loop M2. These helixes form the channel part of the receptor to a gateway for ions. M3 helixes organization causes a narrow region in the upper part of the channel. It is reported that M3 helixes are essential for gating. Also, SYTANLAAF (Lurcher Motif), a conserved amino acid sequence for all iGluR family is located in the M3 helix. This sequence plays a role in activation of NMDA (Chang and Kuo, 2008). Re-entrant loops M2 organized themselves inside the channel and form another small region. Mg2+ ions are the blocker for NMDA
receptors and bind to M2 helixes in the voltage-dependent manner (Kupper et al., 1996; Wollmuth et al., 1998). After depolarization, blockage of Mg2+is removed and
calcium ion can pass through the channel. CTD which locates after M4 helixes is the region that enables the interaction between intracellular proteins, so it is critical for the receptor since it governs the downstream signaling (M. J. Kim et al., 2005; Tu et al., 2010).
Figure 1.2 Topology of NMDAR. CTD part removed from the picture for clarity. An extracellular N-terminal domain (ATD), a ligand-binding domain (LBD) and a
transmembrane domain (TMD) with M1, M2, M3, and M4 helices involve in NMDAR construction. ATD and LBD clamshells are formed from two lobes. Upper lobes named as R1 and D1 and lower lobes named R1 and D2. A sequence
called S1 forms upper lobe of LBD and links the domain to M1 helices. S2 sequence forms lower lobe of LBD and connects to M3 helices to LBD.
1.4 Structural and Dynamics Studies of NMDA
The first potassium channel X-ray crystallography was resolved in 1998 by MacKinnon and colleagues (Doyle et al., 1998). Based on this research, they made a proposal on the gating mechanism of the ion channel. After 5 years, he won the Nobel Prize for this study. In addition, in 2002, W¨uthrich won Nobel prize by developing of NMR techniques for studying of biological macromolecules. These studies show us the importance of structural biology.
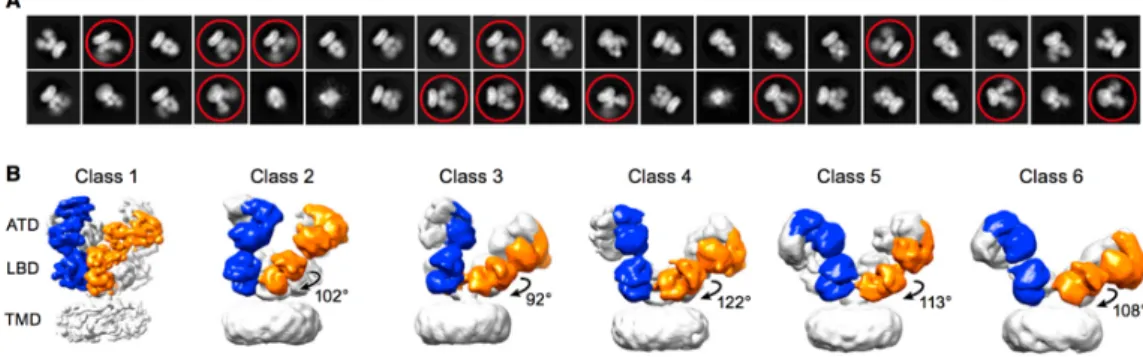
NMDA is a membrane protein that takes part in the di↵erent cellular process. Malfunctions in the regulation mechanism of NMDAR can cause common diseases such as Alzheimer’s and Parkinson’s. Therefore, more attention should be given to the structure of NMDAR to identify normal and abnormal functions. X-ray crystallography and NMR are two main methods for generating high-resolution structural models. Membrane proteins are difficult to crystallize with high-resolution compared to soluble proteins. For NMDA receptors, in addition to being embedded in the membrane, it has a large extracellular part which makes the receptor flexible. In an article, three-di↵erent agonist/antagonist bound states of NMDA receptor were published, They were visualized by Cryo-EM and electron resonance methods (Zhu et al., 2016). At least three or four di↵erent conformations were observed in each agonist/antagonist bound structure. As shown in Figure 1.3, the protein sampled six di↵erent conformations for the agonist-bound state (Zhu et al., 2016). In addition, during crystallization studies, membrane part removed with detergent which e↵ects the crystallization of TMD part. Even though agonists are bound, the receptor can be closed to ion flux. This state is called ”desensitized”. In the protein databank (PDB), most of the entries are found in ”desensitized state”. All these facts showed that the study of membrane proteins both experimentally and computationally requires developing original techniques.
Figure 1.3 Electron microscope pictures of antagonist-bound NMDAR (Reprinted from ”Mechanism of NMDA Receptor Inhibition and Activation” by S. Zhu)
Crystal structures of NMDA that published in 2003, 2005 (Furukawa and Gouaux, 2003; Furukawa et al., 2005) showed that the orientation of S1/S2 is similar to AMPA GluR2 structure (Armstrong et al., 1998). Through these studies, it was observed that distance between D1 and D2 lobes decreases due to ligand binding pocket closure after ligand binding. This rearrangement may put enough strain to pull the linkers of TMD resulting in the ion channel activation (Armstrong et al., 2006; Mayer, 2006). Hence this mechanism may be maintained in the iGluR protein family.
Ion channel activation not just depend on the conformational changes of LBD, but also ATD plays an important role in the activation. ATD contributes open probability, allosteric modulation, and desensitization of receptor (Gielen et al., 2009; Madry et al., 2007; Yuan et al., 2009). Karakas and colleagues showed that ATD organization is similar to LBD (Karakas et al., 2009). Structural studies of isolated ATD’s indicate that GluN2 ATD cleft opens by rearranging its lobes during activation (Tajima et al., 2016). In a recent study, the protein was crystallized by removing the ATD, and a structurally di↵erent symmetrical TMD/ LBD was obtained compared to intact protein. This indicates the influence of the ATD in stabilizing the structure (Song et al., 2018).
Two whole intact GluN1/2B NMDAR crystal was resolved in 2014 (Karakas and Furukawa, 2014; C. H. Lee et al., 2014). Before that, only iGluR full-length structure available was AMPA GluR2 (Sobolevsky et al., 2009). These structures showed that topology of the NMDAR is similar to AMPA which solved in 2009. Two NMDAR X-ray structures have a high resolution within the extracellular part of the protein, but the resolution in the TMD part was problematic. Also, these two structures are thought to be the desensitized state. However, before these two X-ray crystals, structures of an AMPA receptor (AMPAR) (Sobolevsky et al., 2009) and potassium (Shi et al., 2006) channel were used for computational studies to explain the mechanism of NMDA (AMPAR is homologous to NMDAR, unlike potassium channel are structurally similar to iGluRs TMDs).
Despite the lack of activated conformations of X-ray NMDAR, many computational studies have been carried out to explain the mechanism of NMDA. In 2013, how specific subunit compositions a↵ect the gating of NMDA was investigated by using homology modeling and targeted molecular dynamic studies (Dai and Zhou, 2013) which uses steering forces to drive the structure to the desired conformation (Schlitter et al., 1993). The receptor was modeled by using AMPA X-ray structure. As a summary this study showed that D2 lobes of GluN2 shifts to the interface of LBD, and GluN1 subunit has an e↵ect on Ca2+ ion
permeabilization (Dai and Zhou, 2013). Another study examined M3/S2 linker role on the receptor by introducing the residues to the linker. Results showed that mechanical pulling is needed for activation (Kazi et al., 2014).
There are computational studies to characterize LBD motions upon ligand binding. One such study investigates the semi-closed conformations of LBD and the residues that can stabilize the closed configuration (Dai and Zhou, 2016). Ligand selectivity for LBD (Lau and Roux, 2011), semi-active agonist activity (Postila et al., 2011) and agonist-induced LBD cleft closure (Dravid et al., 2010; Frydenvang et al., 2009) have been studied with molecular dynamics simulations. In addition, di↵erent degrees of closure upon ligand binding have been observed for di↵erent agonists and partial agonists (Armstrong and Gouaux, 2000). In 2017, with the whole GluN1/GluN2B NMDAR crystal, an open model of Xenopus laevis NMDA was obtained by using the repacking of TMD helixes via targeted simulation (Pang and Zhou, 2017). Also, a study conducted in 2017 helped us to understand the dynamics of the receptor during activation by using coarse grained molecular dynamics (Isralewitz et al., 2001) which treats a smaller atoms groups like one group to simplify the system. According to that study, activation occurs stepwise. ATD conducts its motions to TMD with the help of R2-D1 interface, S1 and finally M3/S2 linkers (Zheng et al., 2017). This model is similar to activation of acetylcholine receptor (Purohit et al., 2007).
At the present, a few heterotetrameric NMDA structures are resolved using X-ray and Cryo-electron microscopy methods (Karakas and Furukawa, 2014; C. H. Lee et al., 2014; Lu et al., 2017; Tajima et al., 2016; Zhu et al., 2016). All these structures have di↵erent functional states but the whole receptor structure that is open to ion permeation is not resolved. Therefore, NMDAR transition state during activation is still controversial. All-atom molecular dynamics simulation of membrane proteins is a powerful method to address this problem. This work focused on the use of computational methods to simulate and predict the dynamics of the homology model of human GluN1/GluN2A NMDAR. Comparison between ligand-free (apo) and ligand-bound (halo) simulations gave insight about to local and global conformational change in NMDA. Principal component analysis (PCA), root mean square fluctuations (RMSF), and root means square deviation (RMSD) were used for trajectory analysis. The results will help to develop new drug leads for the treatment of neuronal death-related diseases.
2. THEORY AND METHOD
2.1 Molecular Dynamics Simulations of Membrane Protein and its Limitations
2.1.1 Molecular Dynamics
X-ray, NMR, etc. methods provide information about structure and mechanism however they only supply one or a few confirmations. Nevertheless, in solution proteins are highly flexible entities. Molecular dynamics provides a computational microscope to study the dynamical behavior of proteins in their natural environments. Molecular dynamics (MD) is a computational method which simulates the motion of the molecular system according to Newtonian mechanics equations.MD calculates the potential energy of a given system by using force field and produces time propagation of all particles in the system under the force field. Coordinates of particles can be derived from either experimentally known structures (X-ray or NMR) or theoretical studies (homology modeling).At the atomic level, the protein and surrounding water and lipid molecules are assigned the random velocities corresponding to the Boltzmann distribution at that temperature. The interaction between atoms is typically defined in the form of the potential energy of two objects. The change in time of molecular positions is calculated by the integration of Newton’s equation of motion for systems of N particle (Equation 2.1).
F is the force and i is the atom that force acting at a time t and force is calculated from atoms mass and the position vectors (Equation 2.2). In nature, these forces related to the position of the systems atoms and atoms vibrate and moves all the time. So, the positions of particles change in time. Because of that, a continuous sequence of states updated with time from the current state of particles to the next state is required. For that, dynamic properties of the systems should be approximated using Taylor’s series expression as a finite di↵erence method. The basics of finite di↵erence methods are diving the integration of the Newton equation into small steps in a fixed time step. The total force on each particle in the configuration at a time t is calculated as the vector sum of its interactions with other particles. Using this calculate force, acceleration of systems particles can be found and can be used for determining of velocities and positions of atoms for the next step.
To integrate Newton’s equations of motion, every algorithm should take into consideration speed, accuracy (important for the calculation of large time step), energy conservation and reversibility criteria’s. One of the algorithms to solve Newton’s equations is the Verlet algorithm (Pande and Rokhsar, 1999). Verlet algorithm calculates the new positions of the particle at a time (t + t) by using positions (r ) and accelerations (a) from the previous step (Equation 2.3).Calculation of the coordinates at time t is needed to determine the velocity at a given time t. Because of that, estimation of velocities is required since the method is not self-starting. Velocity-Verlet algorithm stores the positions, velocities, and acceleration at the same time to overcome this drawback. The Velocity-Verlet algorithm is an altered version of the Verlet algorithm. It is stable and allows for a large time-step. The velocity-verlet algorithm first calculates the velocities at mid-step and then calculates the positions of the next step. After that using velocity and positions, it derives the accelerations from potential. In the last step, it updates the velocities.
r(t + t) = r(t) + v(t) t +1
2a(t)( t)
2 (2.3)
Molecular dynamics simulation uses the potential energy function, or force field to calculate the interactions energy between atoms. Force fields include two classes of interactions: bonded interactions and non-bonded interactions. There are several force fields like AMBER, GROMOS, OPLS, CHARMM, etc. In this thesis, the CHARMM force field was used. Charm is an empirical force field that can parametrize the proteins, lipids, and carbohydrates (Kukol, 2014). CHARMM force field contains 5 terms for interatomic interaction and 2 terms for non-interatomic interaction (Equation 2.4). CHARMM contain additional improper and Urey-Bradley terms compared to general force field equation (Leach, 2009). Angle bending, bond stretching, and torsion are interatomic interaction that results from covalent bonds between the molecular atoms. The bond stretching term is necessary energy to bend bond to. Angle bending represents three serially bonded atoms and the equation sums the all the angle between there atoms. Dihedral or the torsion angle term is used for four consecutively bonded atoms. The equation of dihedral determines the energy needed for bond rotation. Urey-Bradley term introduced to the system a virtual bond between 1,3 atoms which are nonbonded. Improper dihedral is the energy required for calculation of selecting the correct geometry when the four atoms are not bonded properly. These interatomic potentials are represented as a harmonic spring. While Coulomb’s law is used for electrostatic interactions, van der Waals interactions are calculated based on a Lennard-Jones potential (Equation 2.4 and 2.5).
Vpotential =PVbond+PVangle+PVdihedral+PVU rey Bradley
+PVimporeper+PVvdw+PVetec
V = P bondskb(b b0) 2+ P anglesk✓(✓ ✓0) 2+ P dihedrals Vn 2(1 + cos(n' )) + P U rey Bradleyku(u u0) + P improperk!(! !0) 2 +PN i=1 PN j=1+1(4"ij[(rijij)12 rijij)6] +4⇡"qiq0jrij) (2.5)
2.1.2 Limitations of Molecular Dynamics Simulation
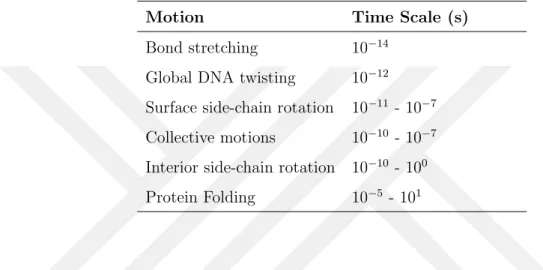
One of the drawbacks of the MD simulations is the time step limitation. Capturing the rapid motions is hard and needs a very small time step. Table 2.1 shows characteristic timescales of biomolecules which indicates, biological molecules exhibit a wide range of time scales for physiological processes. While local motions like atomic fluctuations and loop motions takes time to 10-15 - 10-1s, large scale
motions like folding and folding requires 10-7 - 10-5 s. To capture all the motion,
tens of nanoseconds (ns) are required for simulating realistic all-atomic systems. This makes MD simulations computationally demanding and challenging (Chun et al., 2000). Alternative strategies are developed to solve the time step issue. One of them is constraining the dynamics of systems. SHAKE RATTLE and LINCS have commonly used algorithms and have been developed for geometry constraint during MD (Andersen, 1983; Van Gunsteren and Karplus, 1982). The algorithm allows a predetermined constraint to impose on the selected bond length. The other alternative approach is applying an external force to the system to exclude the high vibrational motions. Targeted and steer MD simulations uses this method to guide the system into the ”target” conformation (Isralewitz et al., 2001; Schlitter et al., 1993). Another time-consuming step is the calculation of non-bonded interaction. To deal with that problem, various cut-o↵s can be introduced to the system. One way to do it is using particle mesh Ewald (PME) method (Darden et al., 1993). PME is a type Ewald summation that is used for calculation of electrostatic interaction during MD. It uses Fourier transformations to evaluate the summation of calculated charged energies by interpolating charge density on a grid system. Another issue to be considered is the environmental
not independent of its external, its interaction with water and lipid layers should be included. A straightforward plan is to add the water molecules to the simulation. However, solvent addition increases the system’s degree of freedom which extends the time of calculation. Usage of Langevin dynamics (LD) during MD simulation is a possible solution since LD just take consideration of water e↵ect on protein (Chandrasekhar, 1943).
Table 2.1 Time scale of motions
Motion Time Scale (s)
Bond stretching 10 14
Global DNA twisting 10 12
Surface side-chain rotation 10 11 - 10 7
Collective motions 10 10 - 10 7
Interior side-chain rotation 10 10 - 100
Protein Folding 10 5 - 101
2.1.3 Limitations of Membrane Protein Simulations
Interactions between protein and membrane are important in terms of protein activity (Michael S. Lee et al., 2004). The hydrophobic thickness or lipid composition of the membrane a↵ects the functionality of the protein (Hunte, 2005). During the simulation, these parameters should be considered. Lipid bilayers contain non-standard residues. These lipid blocks are not present in PDB files however they are required during simulation (Adamian et al., 2011; Opekarova and Tanner, 2003). Each protein is di↵erent so their cell membrane composition should be checked prior to MD simulation (Sanders and Mittendorf, 2011). Consequently, the decision of chosing appropriate lipid layer and building of membrane structures should be carefully addressed as this may a↵ect data from MD simulations. (S. Y. Lee et al., 2005; Soubias and Gawrisch, 2012). In addition,
directly a↵ects the orientation and thickness of the cell bilayer. Moreover, the protein and lipid bilayer should be in balanced so that the system can mimic the natural environment. This is one of the key points for membrane simulation (An´ezo et al., 2003). During preparation, some lipids and protein could be overlapped with each other. A simple way to overcome that problem is to use the cut-o↵ value for deleting the lipid molecules. Another problem is that there is not enough force field function that can be used for phospholipid simulation since phospholipids are hard to parametrized.
2.2 Principal Component Analysis (PCA)
Principal Component Analysis (PCA) used as an uncontrolled linear conversion technique to reduce dimensionality. PCA helps us to identify repeated patterns in data, based on the correlation between properties. PCA allows to find maximum variances in high-dimensional data and to project onto a new subspace with equal or less size than the original one.
Molecular dynamics simulations can produce a huge amount of data, so PCA can be applied to reduce the dimensionality of the system. Hence, significant conformations from big data can be selected to analyze. These significant conformations represent the major concerted and collective motions from MD data. PTRAJ is an AMBER package (Case et al., 2005) and has been used for PCA analysis. 50.000 frames (1000 ns) are taken from MD simulations. First, each conformation in trajectory is superimposed into a reference structure. The program then creates a variance-covariance matrix based on deviations from the positions of alpha carbon ( C↵ ) atoms in the mean structure (Equation 2.6).
Xi and xj are the coordinates of residues i and j, and the brackets mean the ensemble average. Then the C which is covariance matrix is diagonalized to orthonormal vectors which are called eigenvectors (Equation 2.7). These eigenvectors represent the maximum variation in the given systems (Berendsen et al., 1984; Darden et al., 1993).
C = T TT (2.7)
T are eigenvectors, also known as modes (PCs) and is the diagonal matrix that contains eigenvalues. Constructed matrix has 3Nx3N dimension for a system contains N number of particles. To collect the collective motions and its magnitudes, normalized correlations of the systems are calculated from the covariance matrix. Eigenvectors and eigenvalues were derived from the covariance matrix of systems. Cij = P10 l=1 UilUjl ⌦ll (P10 m=1 UimUjm ⌦mm ) 1 2(P10 n=1 UinUjn ⌦nn ) 1 2 (2.8)
⌦ refer as the diagonal matrix of eigenvalues and U term is the matrix of eigenvectors. The cross-correlations maps indicate the correlation of motion between di↵erent parts of the protein.
Although PCA is a robust method to analyze, it has some weakness. After generation of vectors equivalent to cartesian coordinates, dimensionality is reduced and we mostly focused on first vectors. This causes loss of information and some targeted features. Such as, there are correlated motions between the ligand and the residues of the binding pocket of protein. But global motions of protein can suppress these local motions during PCA. Despite this weakness, PCA is an important method that can detect the large motions related to protein function.
2.3 Structure Preparation and Simulation Parameters
Xenopus laevis GluN1-GluN2B NMDAR (PDB code: 4TLM) (C. H. Lee et al., 2014) used as a template for homology modeling to develop the human GluN1/GluN2A type NMDAR ion channel structure. These model study has been completed by former master students (Demir and Essiz, 2017). Two di↵erent models are created as ligand-free (apo) and ligand-bound (halo). Glycine and glutamate were docked to ligand binding domain of receptor to obtain halo model.
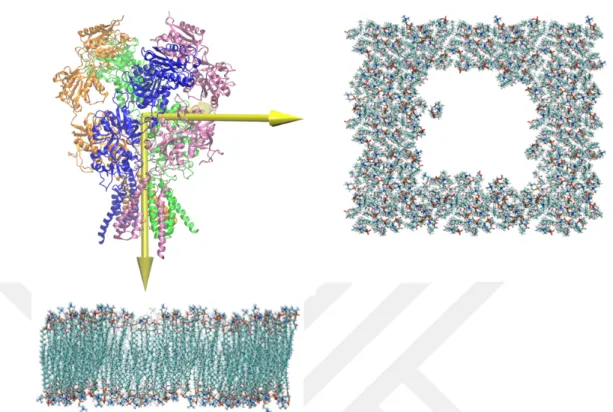
First, the protonation status of histidine (HIS) and the other charged residues (GLU, ASP, LYS, and ARG) were examined during the preparation of the system. PROPKA (Olsson et al., 2011) web server has been used to determine the states of acidic and basic residues at pH 7.4. In addition, the disulfide bridges between adjacent cysteine residues and all the disulfide bridges between the proposed residues in the X-ray structure were applied to the system (Humphrey et al., 1996). After that, a POPC membrane of 130 ˚A width and 110 ˚A length was created to accommodate the transmembrane part of the model and the membrane and protein were aligned with each other. Lipid molecules that were closer to the protein more than 0.6 ˚A, were removed from the systems to prevent overlapping of the residues (Figure 2.1).
Figure 2.1 The representation of membrane and protein. On the left side of the figure, front view of the membrane is shown. On the right side of the figure, the
upper view of the membrane is shown. The empty space in the membrane indicates the area where the channel will have placed.
In order to solvate the system with water molecules, the dimensions of the system consisting of protein and membrane were measured. Then, using the VMD solvate plugin, the system was coated with cubic water. Water molecules close to the protein and membrane were removed from the system. VMD Autoionize Plugin was used for ionizing and neutralizing the system. The systems were ionized at a concentration of 0.15 mol/L NaCl. Finally, a system which contains protein, 404 Na and 370 Cl ions with TIP3 water molecules in the non-equilibrium POPC membrane were obtained (Figure 2.2).
Figure 2.2 The representation of the simulation box. Protein and membrane placed in the water box. The white surface on the outside indicates water. Sodium
and chloride ions in the system are indicated by small balls.
These solvated systems (apo and halo) were subjected to energy minimization to equilibrate the POPC membrane. Systems were simulated for 2 ns with 1,000 steps (2ps) minimization at 300K and constant volume (NVT). All other molecules were kept fixed except lipid tails. After that, systems were minimized for 2 ps and sequential harmonic restraints (1, 0.75, 0.5 and 0.25 kcal/mol/˚A2, respectively) were applied on proteins leaving only the water and ions unrestrained for eight ns at 300 K. ”NAMD Tcl Forces” were used to preventing water flux into the ion channel and the hydrophobic region of the membrane. Next, the constraints were removed for both systems and the two systems were run 5 ns at 1 atm and 310 K. In production step, the lipid area was kept constant, and 260 simulations of 5 ns (1.3 microseconds in total) were performed in a Langevin piston set to 1 atm for pressure and a Langevin temperature piston set to 310 K for temperature. All molecular dynamics simulations were performed using the NAMD (Phillips et al., 2005) program with a non-bonded vdW cuto↵ 12 ˚A and CHARMM (Feller and
electrostatics settings were applied to both system, SHAKE algorithm was used for constraining the hydrogen atoms.
3. RESULTS AND DISCUSSION
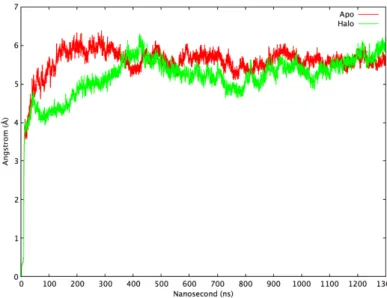
Structural stabilities of the two NMDA models were analyzed over the course of the MD simulation to determine whether the systems have reached an equilibrium state under the simulation conditions. Root means square displacement (RMSD), which is the root mean square distance of the snapshots from the initial reference structure, was calculated for both systems. In Figure 3.1, the red line shows apo and the green line represents the halo simulation. Apo simulation settles around a stable value after 120 ns while RMSD of halo structure fluctuates from 4 ˚A to 6 ˚A after 80 ns (Figure 3.1). Apo and halo simulation seems to reach to a plateau after 300 ns. Thus, the first 300 ns is discarded and remaining 1000 ns trajectory analyzed for significant conformations changes. Analyses parameters which were shown to be important on the mechanism of gating were collected from previous studies of the NMDA receptor (Karakas and Furukawa, 2014; C. H. Lee et al., 2014).
Figure 3.1 The RMSD plot of apo and halo simulations. Apo (ligand-free) is represented by the red line, halo (ligand-bound) is represented by the green line.
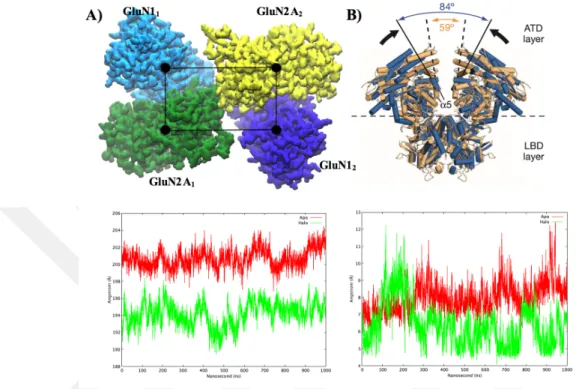
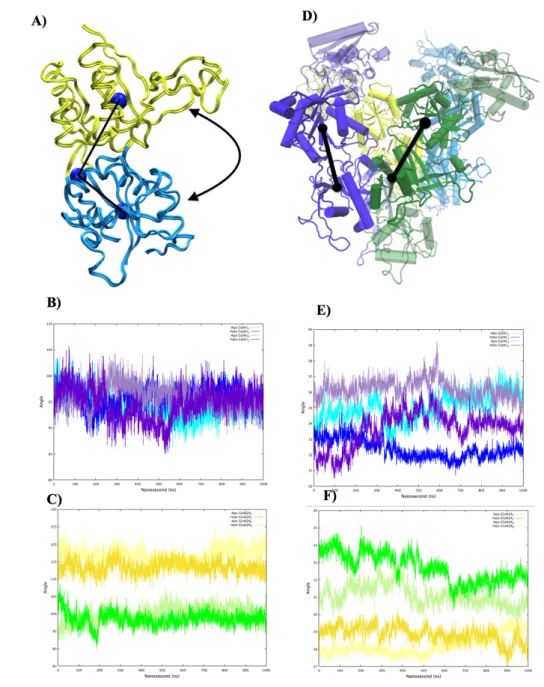
3.1 ATD Conformational Rearrangement Upon Glutamate and Glycine Binding
Figure 3.2 Conformational changes of ATD upon ligand binding. A) ATD is showed with quick surf representation (cyan for GluN11, green for GluN2A1,
purple for GluN12, and yellow for GluN2A2). Black spheres show the center of
mass of every subunit and black lines show the measured distance. The graphs represent the summation of the distance between each COM of ATD. Green color
represents halo and red color represents apo. B) K216 parameter. ATD was displayed with cartoon representation. Distance change between mutated lysine residues was plotted. The green line represents halo, the red line represents apo.
Displacements between the center of masses (COM) of ATD subunits were calculated and summed up to understand the structural changes of ATD after ligand binding (Figure 3.2A). Apo was shown with the red line and halo was shown with the green line. The distances increase from 200 ˚A to 203 ˚A around 120 ns but mostly remains constant for the apo simulation over the course of MD simulation (shown with the red line in Figure 3.2A). The distances start from 194 ˚A and end at 196 ˚A for halo simulation. But, between 400-500 ns, it reduces to 190 ˚A. During the simulation,
The distance between the two lysine residues (997 in GluN2A1and 2586 in GluN2A2)
were monitored (Figure 3.2B). These lysine residues were mutated into the cysteine and cross linked (K216C disulfide bridge) to each other in the X-ray structure used as a template for homology modeling (C. H. Lee et al., 2014). Only after this mutation crystallization was achieved. In Figure 3.2B, halo simulation samples⇠10 ˚
A distance between 100 ns-200n ns and decreases down to ⇠5 ˚A for the rest of the simulation.Larger distance (⇠9) is observed for apo simulation(see in Figure 3.2B). According to KC216 parameter, GluN2 ATDs are close to each other in halo simulation compared to apo.
3.2 Inter/Intra-domain Motions of LBD Upon Glutamate and Glycine Binding
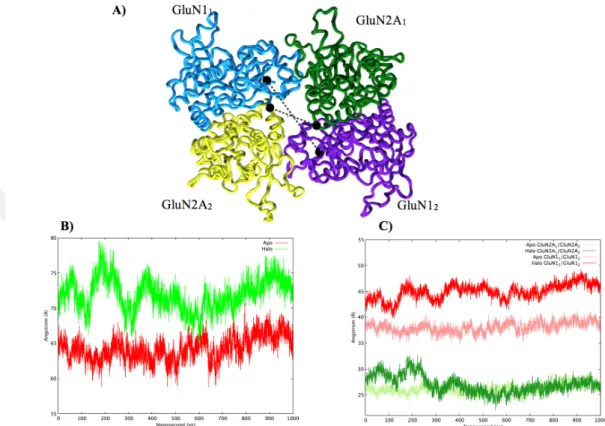
Figure 3.3 Diagonal distance between pre-determined residues in LBD. (A) Visual representation of LBD. (cyan for GluN11, green for GluN2A1, purple for
GluN12, and yellow for GluN2A2) Selected residues are represented with the black
ball and dashed line shows the distance monitored. (B) Summation of diagonal distances (Green line shows halo simulation and the red line shows apo simulation). (C) Diagonal distance between subunits. (Apo is represented with
lighter colors, halo were represented with darker colors.) Diagonal distance between GluN1 was shown with the red line and GluN2A was shown with red line
To quantify the changes in the LBD, the diagonal distances between R656 of the GluN11 and R2253 of the GluN12, between D1539 of the GluN2A1 and D3130 of
the GluN2A2 residues were calculated and graphs of them were plotted for both
larger distances during the simulation. The distance starts from 75 ˚A and raised up to 80 ˚A around 200 ns, and then decreases to 70 ˚A around 300 ns for halo simulation while the distances oscillate around 65 ˚A for apo simulation (Figure 3.3B). Apo simulation shows lower distances compared to halo means that LBD of apo has a more compact structure. In Figure 3.3C, diagonal distance between GluN1 and GluN2A subunits were plotted separately. For GluN1 subunits, this distance stays ⇠5 ˚A larger in halo simulation compared to apo simulation. However, for GluN2A subunits, this LBD distance remains the same for apo and halo.
Figure 3.4 Intra/Inter-domain motions analysis of LBD. (A) Visual representation of LBD clamshell of one subunit. Yellow color represents D1 lobe
and blue color represented D2 lobe of LBD. Blue balls are COM of D1, D2 and hinge point. Black lines are the vectors that connect to COMs. The angle change between two lobes of B) GluN1 and C) GluN2A subunits were monitored over the course of simulation and were plotted. Light colors represent apo and dark colors
represent halo simulation. (cyan for GluN11 , green for GluN2A1 , purple for
GluN12 , and yellow for GluN2A2 ,) D) Visual representation of ATD/LBD.R1 and
The LBD of each subunit contains two lobes connected via a hinge, D1, and D2, the hinge region forms the agonist-binding cleft. As mentioned in the introduction section, the degree of the closure of two lobes is related to the agonist binding. Thus, the angle between centroids of D1, D2 and hinge point was calculated and was monitored through the simulation time. In Figure 3.4A, centroids of lobes and hinge point were shown with blue balls and each black line shows the vector which connects the centroids. Only GluN2A subunits display smaller angle in halo simulation with respect to apo simulation (Figure 3.4C) while the angle stays same in both simulations for GluN1 subunits.
As shown in Figure 3.4D the distance between COM of R2 lobe of ATD and COM of D1 lobe of LBD were calculated. ATD/LBD linker binds the R2 lobe of ATD to D1 lobe of LBD. Each subunit was represented with a di↵erent color while R2 and D1 lobes were shown as opaque and the rest of the domains were shown as transparent. Black balls represent the COM of lobes and the distances in between them were monitored in Figure 3.4D and Figure 3.4F. The distance between ATD/LBD of the GluN1 subunits are shorter in halo simulation with respect apo. For GluN2A, a larger distance is observed in halo simulation relative to apo.
3.3 Conformational Changes in TMD
Figure 3.5 Distance change of TMD girdle after ligand binding. A) TMD upper gate. Purple spheres show the residues in the narrowest part of the upper gate. Black lines are the monitored distance between selected residues. B) TMD lower
gate. Orange spheres show the residues in the narrowest part of the upper gate. Black lines are the monitored distance between selected residues. The left side of the figure shows upper gate analysis and right side of the figure shows lower gate analyses C-D) Summation of distances were shown in plots. Apo simulation is
shown as red and halo simulation is showed as green in the plots.
TMD has two girdles which restrict (gate) the ion permeation. The top girdle is called upper gate while the bottom girdle region forms the lower gate. These girdles are two narrowest regions along the z-axis of the channel. The upper gate is formed by M3 helix bundles crossing and lower gate is formed by the loop regions which connects M2 and M3 helices. Previously, M3 helix of TMD was reported to be the main gate in the activation of the NMDA receptor (Jones et al., 2002). To monitor the conformational changes in the TMD upon ligand binding, upper gate and lower gate diameter changes were observed over the course of the simulation (Figure 3.5).
studies (C. H. Lee et al., 2014) were measured and summed up. The diameter changes were shown in Figure 3.5C and Figure 3.5D. There is no quite di↵erence between the apo and halo simulations for the upper part of the TMD. For halo, The distances are around 35 ˚A and for apo, they are around 32 ˚A (Figure 3.5C). For lower gate, the distance starts at 30 ˚A and jumps to 38 ˚A which indicates a brief opening of the lower girdle at around 220 ns in halo simulation (green line represents halo simulation in Figure 3.5D). The distances remain same for apo simulation (Figure 3.5D).
Figure 3.6 Alignment of the narrowest (Halo-gray) and widest (Halo-colored) states of the bottom gate. Ball color represent subunits; yellow for GluN11, blue
for GluN2A1, green for GluN12, and purple for GluN2A2. (A) Bottom view of the
channel. M3 and M2 helices displayed opaque, M4 and M1 helices are transparent. (B-C) Side view of the channel. (B) M4 helices materialized as opaque. (C) M2
helices are shown as opaque and M1/M4 helices are shown as transparent.
To understand the movements of the bottom gate during the brief opening (Figure 3.5D), 2 frames were chosen from the trajectory where the lower gate of the halo is the widest and narrowest. These two frames are structurally aligned with each other (Figure 3.6). M2 helix of GluN11 makes tilt movement to the left (Figure
3.6A) and this movement increases the channel width by pulling back the loop that is connected to M2. The M2 helix of GluN2A2 slides counterclockwise (Figure
3.6C). M2 and M3 of GluN12(green) and M2 of GluN2A1approach the center of the
channel (Figure 3.6A and Figure 3.6C). Overall, the movements slide to sideways in the counterclockwise direction and it is observed that the opening is caused by the GluN1 subunits.
Figure 3.7 Alignment of the narrowest (Apo-gray) and widest (Halo-colored) states of the upper gate and representation of M3 /M2 helices.Blue GluN11 red
GluN2A1, purple GluN12 and yellow GluN2A2 chains. (A) the bottom view of the
channel (B) the top view of the channel (C) and (D) the side views of the channel.
In Figure 3.7, 2 frames were taken from the trajectory, in which the upper gate was the widest in the halo structure and the narrowest in apo. These two frames were aligned according to their M3 helices. During the transition from apo structure to halo structure, the M3 helices of GluN1 subunits open outwards by moving away from the center of the channel (Figure 3.7D). This movement pushes the M2 helices outwards. Although the M3 helices of GluN2A subunits approach the center of the channel, the tilt movement of the M2 helices pulls down the loops that form the
narrow part of the channel (Figure 3.7C). Hence, the channel from the top view of the channel it seems that the channel position in halo is more symmetrical (Figure 3.7A and Figure 3.7B).
Figure 3.8 Distance change of M3/S2 linker between subunits. M3/S2 linker connects the M3 helix to D2 of LBD. A) The cartoon representation of linkers. B)
The linker distances between subunits were plotted. Light colors represent GluN1 subunit and dark color represent GluN2A subunits. Apo simulation is represented
with red, halo simulation represented with green.
There are 3 linkers that connect the LBD to TMD; S1/M1, M3/S2, and S2/M4. The M3/S2 linker connects the D2 of LBD to M3 helix of TMD. NMDA channel ion channel structure with M3 helix bundling looks like a potassium voltage-gated ion channel structure, however, it is upside down compared to K+ channel. While ligand binding activates the NMDARs, potassium channels activated with voltage change. In K+ channel, there is a pH sensor that contributes to pulling motion of TMD helices to open the helix bundling. It is suggested that in NMDAR, dynamics of LBD upon ligand binding leads this pulling motion through M3/S2 linkers (Cuello et al., 2010). Moreover, in 2017, open and closed cryo-EM structures of the AMPA receptors were obtained and the gating mechanism of
channel. The distances between M3/S2 linkers of the same subunits were tracked throughout the trajectory for apo and halo simulation in our study also (Figure 3.8). For NMDA, M3/S2 linker of GluN1 are vertical to the membrane and M3/S2 linker of GluN2A are parallel to the membrane (Figure 3.8A). According to plots, the distance between the M3/S2 linker of GluN2A in halo is 12 ˚A larger than apo linkers (Figure 3.8B). There is no significant di↵erence for M3/S2 linker of GluN1. Overall, in halo simulation, the diameter of the upper gate remains larger (Figure 3.5C) and lower gate briefly opens for 100 ns (Figure 3.5D). Alignment of the narrowest (apo-gray) and widest (halo-colored) states of the upper gate showed that the movements of the M3 helices of GluN1 subunits pull the M2 helices of TMD (Figure 3.7). Through the simulation, ATD is more compact while LBD is more relaxed in halo simulation relative to apo. (Figure 3.2A and Figure 3.3A). The distance between ATD and LBD increases for GluN2A subunits (Figure 3.5E and Figure 3.5F) upon ligand binding. Hence, ligand binding induces cleft closure of LBD for GluN2A subunits (Figure 3.5A). In addition, the distance of M3/S2 linker in the GluN2A is observed to be shorter in the apo simulation with respect to the halo simulation (Figure 3.8B).
Figure 3.9 Root-mean-square fluctuations (RMSF) graphs of separate subunits. A/B/C/D) Apo (red) and halo (green) simulations are plotted for di↵erent
subunits.
Root-mean-square fluctuation (RMSF) which is the method that calculates mean squared deviations of atomic positions, were plotted for each subunit (Figure 3.9). For GluN11, Region 1 is a loop in the R1 lobe of ATD while Region 2 is the linker
region that connects R2 lobe of ATD to LBD. These loops showed higher deviations over course of halo simulation (Figure 3.9A).
Region 3 which is the linker between R1 and R2 lobes of ATD shows higher fluctuation in halo simulation compared apo for GluN2A1. Also, S1 and S2
sequences in LBD display higher fluctuation(Region 4 and Region 6). Another major di↵erence is observed at the TMD for GluN2A1 (Region 5) (Figure 3.9B).
In GluN12, there are two regions that display higher fluctuations in halo simulation.
Region 7 is a loop which locates at D1 lobe of LBD. Region 8 is the linker that connects LBD to M4 helix and shows flexibility (Figure 3.9C). ATD of GluN2A2
demonstrate higher fluctuation in halo simulation for GluN2A2 (Figure 3.9D).
3.4 Principal Component Analysis (PCA)
Molecular dynamic simulations generate large amounts of data that need to be analyzed. For further analysis, PCA is used to reduce the dimensionality of the big data sets and select significant conformations. Namely, to analyze the concerted and collective motions of both apo and halo systems, PCA was performed. 1000 ns equilibrated trajectories from apo and halo simulations were used for PCA. PTRAJ suite of AMBER (Case et al., 2005) was used to diagonalization of the covariance matrix. The system contains 3189 residues and so, 9567 eigenvalues and eigenvectors were calculated (equation..) The eigenvectors of the covariance matrix are sorted according to their eigenvalues in descending order. Largest amplitude motion of the protein is captured by the first eigenvalue. Previous studies stated that most of the deviations in protein can be captured within ten eigenvalues (Issack et al., 2012). The projection of the first eigenvector is called the first principal component (PC 1) while the second eigenvector named second principal component (PC 2). PC1 capture the slowest motion of protein and these principal components are called ”modes”.
Figure 3.10 Principal component analysis. (A) The proportion of variance against its eigenvalue rank. (B) Projection of the trajectory that is formed by first
two modes (green halo, red halo). (C) Projection of the first two modes according to time
First ten eigenvalues from covariance matrix cover 65 % of total fluctuations in apo simulation and 77 % of total fluctuations in halo simulation (Figure 3.10A). The first mode observed in the halo simulation constitutes 48.1% of the total movement of the protein, while in the apo simulation it constitutes 28.8% of the same mode. The first mode of halo fluctuations is two times higher than apo. In both simulation first mode strongly dominates the overall movements. The second mode contributes 10% and the individual contributions afterward drop below 5% in both simulations (Figure 3.10A).
mobility of the protein in the subspace. Although most of the time apo and halo sampled the same area, there are noticeable di↵erences around between 200 ns to 700 ns. Thus, near the end, both simulation makes di↵erent samplings according to the first two modes (Figure 3.10 B and Figure 3.10C). Hence the first two principal components projection revealed U-shaped scattering. This occurrence explained as within simulation there are random di↵usions (Hess, 2000; Hess, 2002)
Figure 3.11 First mode of GluN1 subunits of apo and halo simulation from PCA. GluN11 were represented with a cyan color and GluN12 were represented with
purple. The right side of the figure is the first mode of halo and left the side of the figure is the first mode of apo. The upper figure rotated 90 degrees for the lower
Figure 3.12 First mode of GluN2A subunits of apo and halo simulation from PCA.GluN2A1 is represented with green color and GluN2A2 is represented with
yellow. The right side of the figure is the first mode of halo and left the side of the figure is the first mode of apo. The upper figure rotated 90 degrees for the lower
To further investigate the conformational change of protein, the first modes of PCA was analyzed visually also. In this mode, for GluN11 subunit (cyan colored subunit
is shown at Figure 3.11), the ATD of halo simulation rotates counterclockwise, while the R1 and R2 lobes of the ATD slide in opposite directions in the apo simulation. R1 moves towards the center of channel and R2 lobe move away from the center of the channel for halo simulation. Hence LBD domain slides to TMD and two lobes of LBD gets closer. In GluN12 subunit of apo, R1 of ATD slides to the inwards of
the channels and R2 of ATD rotates outward from the channel. In halo simulation, R1 rotates clockwise and R2 rotates counterclockwise to outwards of the channel which pulls out the ATD/LBD linker. Hence, LBD lobes slides to the R2 of ATD and bi-lobes of LBD got closer to each other in halo (purple colored subunit shown in Figure 3.11).
In Figure 3.12 first modes of GluN2A subunits were observed for apo and halo simulations. Like GluN1 subunits both ATD and LBD parts are mobile in halo with respect to apo. ATD of GluN2A1of halo slides to inwards to channel whereas ATD
of apo rotates and the clamshell of ATD closes. LBD of halo moves counterclockwise to TMD part and two lobes of LBD closes into each other. Overall deviations are higher in the halo for GluN2A1 chain (green colored subunit is shown in Figure
3.12). GluN2A2 of apo and halo make rigid body movements as whole and slides
to outwards of the channel.D2 lobe of GLUN2A2move away from TMD, D2 lobe of
GLUN2A1 rotate counterclockwise and gets closer to TMD in halo. These motions
in GLUN2A may be responsible for M3/S2 linker pulling. Overall both ATD and LBD parts are more mobile compared to TMD in both simulations. (Figure 3.11 and Figure 3.12). However, halo simulation fluctuates more than apo.
Figure 3.13 The rotation between two extreme structures that is taken from PCA first mode. A) The representation of ATD rotation between two conformations of the first PCA model. The black rods indicate the axis of rotation. The green color
represents halo simulation and red color represents apo simulation. B) ATD/LBD rotation. GluN2A2 subunits are used for representation) Angle changes were
displayed at the table.
According to the first modes of apo and halo simulations, extracellular domains have fluctuated more in halo simulation. Rotation angles were checked out for whole protein using hinge find the algorithm which can calculate the e↵ective rotation by superimposing the chosen parts of the domains. The algorithm calculates the e↵ective rotation angle from the rotation matrix. Extreme structures of the first mode from both simulations were used for rotation angle calculation. Extreme structures were superimposed according to LBD/TMD to find the rotation of ATD. ATD of full protein rotates 10 in halo while in apo it is 1 indicating agonist binding increase the flexibility of the protein. In addition, rotation of ATD and extracellular
domain, for each subunit were checked out for apo and halo from the first mode. Rotation angles displayed in Figure 3.13C. Upon ligand binding, the ATD rotation angle increases for each subunit. ATD of GluN2A subunits shows more mobility respect to GluN1 subunits. With respect to apo, GluN2A subunits of halo rotates ⇠10 more and GluN1 of halo rotates ⇠5 more. Hence ligand binding increases the rotation of the extracellular domain for all subunits (Figure 3.13C). These results indicate that upon ligand binding, receptor fluctuation and mobility increases. Covariance matrix values are normalized (Equation 2.8) and cross-correlation plots are retrieved to see how agonist binding e↵ect dynamics of the receptor. Each chain of the receptor is plotted separately (Figure 3.14 and Figure 3.15). In the correlation graphs, diagonal segments are for close segments of the protein while o↵-diagonal segments show the correlations between distant segments. Apo simulation plotted in the lower right of matrix whereas halo simulation results plotted upper left half-matrix in each graph. +1 in color bars on the right of the plots means the segments are moving in a fully correlated fashion while -1 means anti correlated movements. Figures are colored according to the degree of correlation where +1 is represented with red while -1 is represented with blue. 0 means there is no correlated movements. If the segments are correlated they are moving together and the distance between them is not changing. Generally, neighboring atoms are positively correlated and correlated motions are generally rigid body motions. However anti-correlated motions mean direction of motions of segments are opposite to each other and the distance between them either increase or decrease (Grosdidier et al., 2012)
Figure 3.14 Correlation maps of A)GluN11 and B)GluN2A1 subunits. Apo
simulation plotted in the lower right of matrix whereas halo simulation results plotted upper left half-matrix. Regions(R*) shows di↵erent correlation region
Figure 3.15 Correlation maps of A)GluN12 and B)GluN2A2 subunits. Apo
simulation plotted in the lower right of matrix whereas halo simulation results plotted upper left half-matrix. Regions(R*) shows di↵erent correlation region
According to the cross-correlation plots of GluN11(Figure 3.14A), S2 of LBD (Figure
3.14A shown with R2) and S1 of LBD (Figure 3.14A shown with R1) parts show higher correlated motion with R2 lobe of ATD in halo simulation. S1 is the sequence connecting LBD to M1 and S2 is the sequence connecting M3 to M4 helix in TMD. Also, these R1 and R2 part of map mean that R2 domain of ATD and D1 of LBD moves together. R1 lobe of ATD shows anti-correlated motion with S2 of LBD and S1 of LBD (blue parts in Figure 3.14A). Another significant change is that R1 of ATD displays correlated motion with TMD M1 and M3 helices upon ligand binding (Figure 3.14A shown with R3). Hence in halo, M4 and M3 helices of GluN11display
greater correlation in halo (Figure 3.13A shown with R4).
The correlation of GluN2A1chain is displayed in Figure 3.14B. Correlation between
S1 and S2 regions of LBD is increased after ligand(glutamate) binding (Figure 3.14B shown with R5). R2 lobe of ATD and S1 of LBD in the GluN2A1also more correlated
in halo simulation compared to apo (Figure 3.14B shown with R6). Correlated movement between M1/M3 helices of TMD and R1 of ATD is observed in halo (Figure 3.14B shown with R7). Also, there is anti-correlation motion between R1 and R2 lobe of ATD in halo. (blue parts of the map) While there is no correlation between LBD and R1 of ATD in apo, anti-correlated movements are observed in halo. Again, M4 helixes and M1-M3 helixes display a greater correlation with each other after ligand binding (Figure 3.14B shown with R8).
GluN12 and GluN2A2 correlation map were plotted in Figure 3.15. S1 and S2
regions of LBD showed a higher correlation in halo simulation compared to apo in both subunits like GluN2A1 chain (Figure 3.15 shown with R5). That can suggest
after ligand binding D1 and D2 lobes of LBD move together and show rigid body movements. Upon ligand binding, R1 of ATD and LBD domain shows anti-correlated motion in. GluN12 , while in GluN2A2 , same regions show
correlated motions (Figure 3.15A). There are correlated movements between M1-M3 and ATD for both GluN12 and GluN2A2 subunits (R4 region).
As a summary S1 and S2 regions of LBD showed a higher correlation in halo simulation indicating that LBD displays rigid body movement after ligand binding. One of the main observations is that the correlation between ATD and the M1-M3 helices of TMD upon ligand binding increases. Namely, the structural changes of ATD are reflected to TMD. In addition, R1 of ATD and LBD of subunits show anti-correlation with each other. Hence, increased correlations are noticed between M4 helix of TMD and M1/M3 of TMD for each subunit.
4. CONCLUSIONS
In this thesis, the dynamics of homology modeled GluN1/GluN2A type NMDA receptor is studied with molecular dynamics methods. The halo and apo structures of the protein were analyzed via di↵erent structural parameters which were suggested to be important by previous studies as well as the di↵erences of the trajectories obtained. It is observed that ATD becomes more compact after ligand binding. In addition, this indicates that R2-R2 lobes are getting closer when the receptor is activated (Tajima et al., 2016).
The first activation step of the NMDA receptor occurs in LBD upon ligand binding. The bi-lobed of LBD changes its conformation from open to closed. This conformational change is reflected to TMD to open the pore but the pathway of it is still unclear. To characterize the LBD motions, the angle between D1 -D2 lobes and the distance between ATD/LBD were monitored. The angle between the bi-lobed structure of LBD in GluN2A subunits over the course of halo simulation is higher with respect to apo while there was no significant change for GluN1 subunits. This result indicates that ligand binding brings the D1 and D2 of LBD together for specific subunit which is GluN2A. This change in LBD halo simulation is also reflected to the other regions of the protein such as the interface between ATD/LBD and the distance between M3/S2 linkers which is the loops that bind the LBD to M3 helix of TMD. For GluN2A subunit, linker distances between subunits and inter-domain distance between ATD and LBD increased in halo simulation. Referring to these observations, the channel is pulled from the linkers and might open the M3 helices of TMD. This result overlaps with the activation mechanism of AMPA receptor (Twomey et al., 2017). Moreover, this mechanism is
Again please note that TMD of NMDAR resembles the upside down of the K+ channel. While activation of the potassium channels depends on the voltage-sensitive helices, NMDAR needs ligand binding as a mechanical pulling to open the ion channel. Normally, opening and closing of such channels during simulation are often difficult to observe (due to difficulties in simulating such a voltage change in a realistic way). In our simulations, the full open structure of the channel could not be obtained. But a ’semi-open’ channel structures were observed.
Moreover, the correlated motions in M3/S2 linker, closure LBD bi-lobed conformation and distance change in ATD/LBD are observed in halo simulations only. All these can be interpreted as ligand binding induce LBD closure which D1 and R2 lobe move away from each other and it is reflected to TMD trough M3/S2 linker.
The first mode of apo and halo are similar in motion but the motion is more dominant in halo simulation. Namely, in halo simulation, the first eigenvector spans 48.1% of the total eigen space while in apo the same eigenvector spans only 28.8% of the total eigen space. According to first modes of apo and halo simulation, the rigid body rotation of the LBD region and the pulling motion of helices of TMD were observed in the GluN12and GluN2A2subunits. This motion is similar to the proposed AMPA
gating mechanism (Twomey et al., 2017) with LBD cleft closure, pulling the linkers to open the pore.
Correlation map analyses showed that there is an increase in correlation between ATD and TMD M1-M3 helices in subunits after ligand binding. This might be the reflection of ATD conformational changes to TMD. Also, R1 of ATD and LBD shows anti-correlation for every subunit except GluN2A2 chain. Correlations between M4
helix of TMD and M1-M3 of TMD for every subunit increase after ligand binding means all helices works with unity. Correlations between ATD and LBD are higher