European Journal of Educational Research
Volume 7, Issue 2, 159 - 167.
ISSN: 2165-8714 http://www.eu-jer.com/
Children’s Perceptions of Tests: A Content Analysis
Gokce Bulgan *MEF University, TURKEY
Received: August 30, 2017 ▪ Revised: January 31, 2018 ▪ Accepted: February 4, 2018
Abstract: Anxiety that students experience during test taking negatively influences their academic achievement. Understanding how
students perceive tests and how they feel during test taking could help in taking effective preventive measures. Hence, the current study focused on assessing children’s perceptions of tests using content analysis. The sample consisted of 1143 participants (566 females and 570 males) attending 3rd (n = 320), 4th (n = 420), 5th (n = 197), and 6th (n = 206) grade classes in three public schools in Istanbul, Turkey. The findings indicated that three main domains emerged from the data. The domains and the categories under each domain were as follows: evaluation (grades, success vs. failure, learning and development, and intelligence), emotions (excitement, fear and anxiety, happiness, curiosity, mixed feelings, and disappointment), and experiential process (answering questions, studying, difficulty, thinking, having fun, cheating vs. honesty, and silence). Understanding students’ experiences with testing early on in their education will give researchers and practitioners the chance to plan effective applications for treatment and prevention, which would influence students’ future achievement and experiences. The study findings could also help teachers and school counselors plan more effective teaching and counseling programs that take into account students’ anxiety levels during tests.
Keywords: Testing; test anxiety; children; school; educational psychology.
To cite this article: Bulgan, G. (2018). Children’s perceptions of tests: A content analysis. European Journal of Educational Research,
7(2), 159-167. doi: 10.12973/eu-jer.7.2.159
Introduction
Tests continue to have a large place in the educational system. Particularly considering the Turkish educational system, in which students have to take national exams that identify their subsequent schooling and future job opportunities, tests could be anxiety provoking. Test anxiety, which is often experienced by students during test taking, is highly associated with students’ academic achievement (Crisan & Copaci, 2015; McDonald, 2001; Owens, Stevenson, Hadwin, & Norgate, 2012). Taking into account that students are introduced to the concept of tests in elementary school and most likely experience test anxiety for the first time during their elementary school years, they would continue struggling with anxiety in their adolescence and adulthood if necessary precautions are not taken. Therefore, understanding how children perceive tests and how they feel during test taking could help prevent and better intervene with issues related to test anxiety.
Anxiety is an important issue among students, which requires careful considerations to be taken in order to prevent possible detrimental consequences. For instance, research findings indicated that language anxiety has harmful effects on grade and performance levels of students (Philipps, 1992). Similarly, Ashcraft (2002) examined consequences of math anxiety and shared that anxiety compromise on-going activity in working memory; therefore, hinders cognitive processing. Considering Yerkes and Dodson’s (1908) pioneering work on arousal and performance, which indicates that performance increases with physiological or mental arousal up to a point and then gradually drops as in an inverted U shape, children’s performance is expected to decrease when their anxiety levels are too high. Similarly, research demonstrated that test anxiety leads to motivational difficulties; thereby, has negative influence on performance (Hill & Eaton, 1977). In other words, individuals with test anxiety experience motivational problems; therefore, perform poorly on exams. Furthermore, Tobias (1985) argued that test anxiety reduces cognitive capacity available for solution of tasks by interfering with the retrieval of prior learning and thus leads to poor performance. Moreover, research findings support that children with test anxiety have low level of motivation to learn and tend to perform poorly in environments they perceived to be competitive (Hancock, 2001). That is, test anxiety makes children more sensitive to the environment. In addition, test anxiety predicted depression in a sample of 8th, 9th, 10th, and 11th
grade students (Yildirim, 2004). Therefore, students with test anxiety might be under the threat of depression in that
* Correspondence:
Gokce Bulgan, MEF University, Department of Psychological Counseling and Guidance, Turkey. Email: [email protected]
their anxiety in tests could spread out and negatively influence other areas of their life. Taking into account the findings indicating the damaging effects of anxiety students experience in tests (McDonald, 2001; Philipps, 1992; Yildirim, 2004), it is important to examine test anxiety in order to generate possible solutions and coping strategies.
Turkey is one of the countries in which test anxiety is a key barrier in student achievement and performance. Every year, student numbers increase in Turkey, which creates a huge gap between the demand and supply of the number of students and schools. In other words, the small number of schools relative to the great number of students makes placement tests essential in Turkey (Serdar-Kahveci, 2009). For example, according to the Ministry of National Education’s (2016) data, 2,126,670 students took the university entrance exam in 2015. However, only 417,714 students were placed in undergraduate programs, 367,236 students in associate degree programs, and 198,140 students in open education programs. In other words, more than 1 million students, who took the exam, were not placed in any of the available programs. Moreover, similar to the university entrance examination, students who finish 8th grade in Turkey also take an exam that identifies their educational opportunities for secondary school. Considering
that not all students could be placed in schools that they prefer, such exams can be very anxiety provoking. In line with this argument, Kirkaplan (2015) investigated test anxiety levels of 222 8th grade students who were preparing for the
secondary school placement exam and found that 52% of students scored high on delusion anxiety, which is a subdimension of test anxiety indicating negative self-talks and self-thoughts about failure.
Furthermore, research supports that students’ test anxiety levels could differ according to gender and grade level. Although some studies examining math anxiety did not find any gender differences (Dursun & Bindak, 2011; Peleg-Popko, 2002; Yenilmez & Ozbey, 2006), most of the studies confirmed that females tend to have more test anxiety than males. For instance, Kirkaplan (2015) found that females scored higher than males on delusional anxiety related to tests. Similarly, Bukulmez and Tutkun (2015) examined test anxiety regarding tension, somatic symptoms, worry, and thoughts unrelated to tests with 485 8th grade students and found that females had higher tension, showed more
somatic symptoms and higher levels of worry compared to males. Other researchers (e.g., Kaya & Savrun, 2015; Oksal, Durmaz, & Akin, 2013; Segool, Carlson, Goforth, Von Der Embse, & Barterian, 2013) have found similar results indicating females scoring higher in test and math anxiety compared to males.
Next, findings of a study conducted with 708 6th, 7th, and 8th grade students examining mathematics and test anxiety
demonstrated that students’ test anxiety did not differ based on grade level; however, mathematics test and evaluation anxiety subscale of the Math Anxiety Scale (Erol, 1989) was found to differ based on students’ grade levels (Oksal, Durmaz, & Akin, 2013). More specifically, 7th grade students had higher anxiety levels than that of 6th grade students.
Furthermore, the same study indicated that 6th grade students scored less than 7th and 8th grade students on math
anxiety. These results are consistent with other studies’ findings (Dursun & Bindak, 2011; Yenilmez & Ozbey, 2006). Even though there has been a large body of international research on test anxiety (Bodas & Ollendick, 2005; Lowe & Ang, 2012), studies on this area in the Turkish literature have been limited mostly to high school and university student samples. Considering Turkish students’ low achievement in mathematics and science fields in international tests (Education Reform Initiative, 2014), it is important to focus on understanding how students perceive tests and how they feel during test taking in order to take effective preventive measures. Therefore, the current study will focus on assessing children’s perceptions of tests through analyzing their responses to open-ended questions.
Methodology
Research Goal
The aim of this study was to understand elementary and middle school students’ perceptions of tests through analyzing their responses to open-ended questions. Particularly, the researcher was interested in examining what children thought of tests and how they felt during test taking.
The Participants and Data Collection
The participants consisted of 1143 students between ages 8 and 13 (M = 10.0; SD = 1.24). Among those who indicated their gender, there were 566 females and 570 males. Students were attending 3rd (n = 320), 4th (n = 420), 5th (n = 197),
and 6th (n = 206) grade at three public schools, which were similar in size and socioeconomic status, in Istanbul, Turkey.
Turkey started using the 4+4+4 educational system during the 2012 – 2013 academic year. The first four years correspond to elementary school, the second four years correspond to middle school and the following four years correspond to high school in this educational system. Students start taking exams in 4th grade, which is the last year of
elementary school.
A brief demographic information form and two open-ended questions were administered to the participants. The demographic information form included questions about the participants’ age, gender, and grade levels. The two open-ended questions were, a) What comes to your mind when you hear the word ‘test’? and b) How do you feel when you are taking a test?
The researcher is a Turkish woman working at a private university in Istanbul, Turkey. She is an assistant professor who received her doctoral training in the United States. She had considerable experience in qualitative research methodology and have conducted and published studies using this method before. The researcher is also a practitioner in private practice providing counseling services to clients with mental health issues including but not limited to anxiety, depression, and relationship issues. She aims to understand these issues in depth in order to better help others. In addition, the university that she works at applies the University within School Model (Ozcan, 2013), which requires faculty members to have and renew their experiences working at K-12 schools. This model aims to increase the interactions between universities and K-12 schools by faculty members contributing to the schools while learning through their experiences with the students, teachers, and school administrators. The data for this study was collected as part of the researcher’s experience working at public schools by contributing her knowledge and skills in counseling. After understanding students’ perceptions of test anxiety, she aimed to develop programs that would help the students. In short, anxiety in general and test anxiety in particular is a topic that the researcher is interested in and has theoretical and applied knowledge on.
The students were given the measures at the beginning of a class period. The researcher introduced herself, explained the purpose of her visit, and asked the students to respond to the questions. The classroom teachers accompanied the researcher during data collection. It took approximately 20-25 minutes for the students to complete the questions. Analyzing of Data
Participants’ answers, which were mainly short phrases or sentences, were analyzed using content analysis. Firstly, the researcher read through the students’ responses and formed an initial list of possible domains using open coding. Afterwards, the researcher went through the data and identified possible categories within each domain and sorted the data into the categories. Next, the coded data under each category was counted and the final data set was reviewed. Finally, the domains, categories, and entries under each category were sent to an auditor, who is a researcher experienced in qualitative analysis. The auditor gave feedback regarding the findings. Her feedback included a comment that suggested separating the categories grades, and success vs. failure, which were initially together as a single category. The distinction between one’s score on a test (i.e., grades) and one’s assessment or perception of that score (i.e., success vs. failure) was made and two separate categories were formed.
Findings
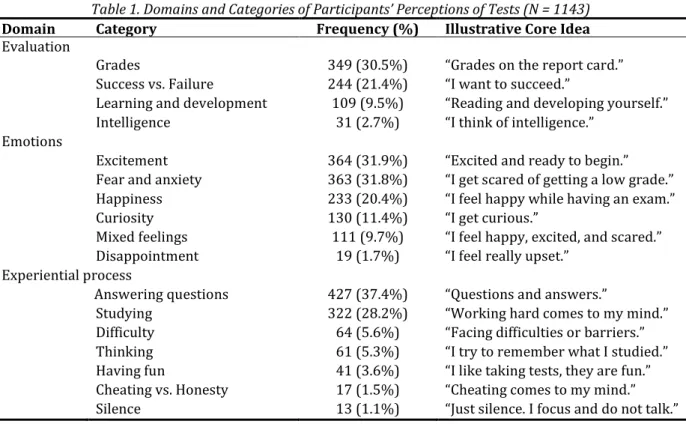
Three main domains emerged from the data. The domains and the categories under each domain were as follows: evaluation (grades, success vs. failure, learning and development, and intelligence), emotions (excitement, fear and anxiety, happiness, curiosity, mixed feelings, and disappointment), and experiential process (answering questions, studying, difficulty, thinking, having fun, cheating vs. honesty, and silence). A list of domains, categories, frequencies, and illustrative core ideas are provided in Table 1.
Table 1. Domains and Categories of Participants’ Perceptions of Tests (N = 1143)
Domain Category Frequency (%) Illustrative Core Idea
Evaluation
Grades 349 (30.5%) “Grades on the report card.”
Success vs. Failure 244 (21.4%) “I want to succeed.”
Learning and development 109 (9.5%) “Reading and developing yourself.” Intelligence 31 (2.7%) “I think of intelligence.”
Emotions
Excitement 364 (31.9%) “Excited and ready to begin.” Fear and anxiety 363 (31.8%) “I get scared of getting a low grade.” Happiness 233 (20.4%) “I feel happy while having an exam.”
Curiosity 130 (11.4%) “I get curious.”
Mixed feelings 111 (9.7%) “I feel happy, excited, and scared.” Disappointment 19 (1.7%) “I feel really upset.”
Experiential process
Answering questions 427 (37.4%) “Questions and answers.”
Studying 322 (28.2%) “Working hard comes to my mind.” Difficulty 64 (5.6%) “Facing difficulties or barriers.” Thinking 61 (5.3%) “I try to remember what I studied.” Having fun 41 (3.6%) “I like taking tests, they are fun.” Cheating vs. Honesty 17 (1.5%) “Cheating comes to my mind.” Silence 13 (1.1%) “Just silence. I focus and do not talk.”
Evaluation. The first domain, evaluation, refers to how students perceive themselves in relation to tests, how they believe their teacher assesses them, or how they assess their outcome in tests is related to evaluation. Four categories emerged within this domain: a) grades, b) success vs. failure, c) learning and development, and d) intelligence. Grades refer to the scores students receive on a given test. Most of the participants (n = 349, 30.5%) indicated that grades were the first concept that comes to their minds when they think of tests. For example, a nine-year-old female, who goes to 3rd grade, indicated that “important grades that go to my report card” came to her mind when she heard the word ‘test’.
An eleven-year-old male, who is a 6th grade student, responded as “the teacher grading us about what we have learned
in class” came to his mind. Next, success vs. failure, which is the second category emerging from the data refers to the students’ assessment of their score on the test or their perception of succeeding or failing in an exam. Two hundred forty-four (21.4%) students shared that the concept of success vs. failure came to their minds when they thought of tests. For instance, an eleven-year-old female in 6th grade indicated that the concept of “receiving a certificate of
appreciation” came to her mind when thinking of tests. Other students responded as “the question of ‘Could I do this, could I succeed?’ comes to my mind”, “the fear of not being able to do it and fail”, and “wanting to succeed.” The third category emerging within the evaluation domain was learning and development. Learning and development is about gaining knowledge and developing oneself through test taking. Among the participants, 109 (9.5%) students talked about tests being a tool for their learning and development. For example, a nine-year-old male going to 3rd grade
indicated that “being knowledgeable” came to his mind when hearing the word ‘test.’ Similarly, a nine-year-old female going to 3rd grade shared that “reading books and learning” came to her mind. Students in higher grade levels
responded as “what we have learned,” “assessing whether we have learned or not,” “developing ourselves through reading, thinking, and learning.” The fourth and last category emerging within the evaluation domain was intelligence. Intelligence refers to students’ beliefs that tests assess their intelligence levels or the functioning of their brains. Thirty-one (2.7%) students talked about tests evaluating their intelligence levels. For instance, several students simply responded as “intelligence,” “being intelligent” or “games that measure intelligence” came to their minds when hearing the word ‘test.’ In addition, a nine-year-old female student in 3rd grade stated that tests make her think of “getting [her]
mind to work” and an eleven-year-old male going to 5th grade shared that he “measured [his] intelligence with tests.” Emotions. The second domain, emotions, refers to different emotions students experience during test taking. Six categories emerged within this domain: a) excitement, b) fear and anxiety, c) happiness, d) curiosity, e) mixed feelings, and f) disappointment. The first category excitement is related to eustress, which is a healthy form of stress that gives individuals energy. Most of the participants (n = 364, 31.9%) reported that they mainly experienced excitement during test taking. For example, an eleven-year-old male in 5th grade shared that he feels “really excited while having a test,” a
twelve-year-old female in 5th grade shared that she feels “excited wondering what [she] will score on the test,” and a
nine-year-old male in 3rd grade shared that he gets “very excited because of the possibility of getting 100 on the exam.”
The second category within the emotions domain, fear and anxiety, is related to distress that the students are experiencing while taking tests. Three hundred sixty three students (31.8%) reported feeling “stressed,” “anxious,” or “afraid” while taking a test. For instance, an eleven-year-old male in 4th grade indicated that he feels “stressed out” and
that he has “a fear of failing.” A ten-year-old female in 4th grade stated that her “hands are shaking” and that she is
feeling “very nervous” during tests. The third category that emerged in the emotions domain was happiness. Happiness is about feeling pleasant and joyful during tests. Two hundred thirty three (20.4%) participants stated that they felt “happy,” “joy,” or “peaceful” during tests. For example, a ten-year-old female in 4th grade shared that she feels “happy
and skillful” during tests, while an eleven-year-old male stated that he feels “very happy when [he finds] the right answers.” Curiosity, which is the fourth category within the emotions domain, is about being curious about the test process. One hundred and thirty (11.4%) students shared that they felt “curious” in regards to tests. For instance, a ten-year-old male in 5th grade indicated that he feels “curious about whether [he] has gotten a low or high score on the test”
and an eleven-year-old female in 5th grade shared that she feels “curious about the questions being easy or hard.” Mixed feelings, which is the fifth category of emotions, refer to students experiencing a wide range of emotions such as happiness, anxiety, surprise, fear, and boredom all at once or interchangeably throughout the test taking experience. One hundred and eleven (9.7%) students reported having mixed feelings related to tests. For example, a twelve-year-old female who is in 6th grade reported feeling “fear, anxiety, excitement, and curiosity.” She shared that she “fears
getting a low grade, anxiety if [she] cannot do it, excitement because of the trill of the unknown, and curiosity due to what the questions will be.” In addition, a thirteen-year-old male in 6th grade indicated that he feels “the up and down of
joy, happiness, and sadness” during the testing process. Lastly, disappointment, which is the sixth category emerging within this domain refers to feeling upset or discontent during tests. Nineteen (1.7%) participants shared that they mostly felt disappointment during testing. A nine-year-old female in 3rd grade shared that she “works a lot and feels
disappointed if there is a question that [she] does not know the answer to.” Similarly, a nine-year-old female in 4th
grade stated that she “does not like tests and feels upset when [she] gets zero on tests.” The students who shared feeling disappointed indicated that their feelings were related to their potential low grades, or the discomfort of not knowing the answers.
Experiential Process. The third domain, experiential process, refers to what students experience during or while preparing for test taking. Seven categories emerged within this domain: a) answering questions, b) studying, c) difficulty, d) thinking, e) having fun, f) cheating vs. honesty, and g) silence. Firstly, answering questions is about students
writing their responses to the exam questions being asked. Four hundred and twenty seven (37.4%) students reported that “questions, answers, or writing [their] responses” came to their minds when they heard the word ‘test.’ A nine-year-old male in 3rd grade replied as “papers with questions on them,” and an eleven-year-old female in 5th grade
replied as “solving problems or equations, answering multiple choice questions, and writing responses.” The next category studying is preparing for an exam by going through the course material. Three hundred and twenty two (28.2%) students shared that studying came to their minds when they thought of tests. For example, an eleven-year-old male in 5th grade shared that tests reminded him of “solving test questions while preparing for the actual test” and an
eleven-year-old female in 5th grade shared that tests made her think of “studying for [her] courses by going over the
material that [they] have learned in class.” The third category that emerged from the experiential process domain was difficulty. Difficulty refers to students viewing tests as challenging for them. Sixty-four (5.6%) students shared that they experienced “difficulty” during tests or that tests reminded them of “difficult questions.” An eleven-year-old female in 5th grade shared that she sees herself as “crossing a very difficult barrier in a racetrack,” whereas a twelve-year-old
female in 6th grade reported that she thinks of tests as “difficult steps to be taken that lead to [her] goals.” The fourth
category thinking is a process in which the students focus on the exam questions and try to remember what they have worked on while preparing for the exam. Sixty-one (5.3%) students indicated that they thought during the testing process. For example, a twelve-year-old female in 6th grade shared that she “thinks of and tries to remember the
information [they] have learned in class during tests.” A nine-year-old male in 3rd grade shared that he “tries to
remember the books that [he] has read while taking a test.”The fifth category having fun is related to students seeing tests as fun or as enjoyable games. Forty-one (3.6%) students indicated having fun during tests. They shared that tests were “enjoyable and fun” or that they liked tests because they had a chance to “solve fun games and puzzles” during testing. Cheating vs. honesty, which is the sixth category within the experiential process domain, refers to dishonesty during test taking or the importance of being honest. Seventeen (1.5%) students shared the importance of “not cheating” or “being honest” during tests or that tests made them think of “looking at [their] friends’ answers while taking tests.” Finally, silence refers to the peace and stillness students experience during tests. Thirteen (1.1%) students reported the test taking process being “in silence” or taking place “in a quiet and peaceful classroom.”
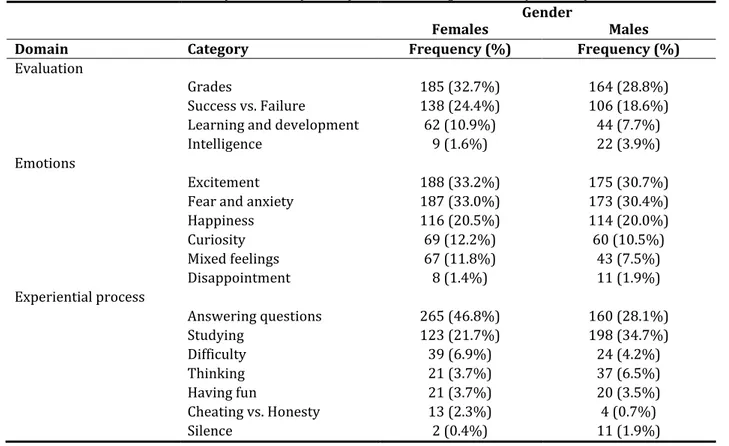
In addition, students’ perceptions of tests according to their genders and grade levels were analyzed. Considering the three main domains of evaluation, emotions, and the experiential process emerging from the data, the similarities and differences between females’ and males’ perceptions of tests are given in Table 2.
Table 2. Participants’ Perceptions of Tests According to Gender (N = 1136)
Gender Females
(n = 566) (n = 570) Males
Domain Category Frequency (%) Frequency (%)
Evaluation
Grades 185 (32.7%) 164 (28.8%)
Success vs. Failure 138 (24.4%) 106 (18.6%)
Learning and development 62 (10.9%) 44 (7.7%)
Intelligence 9 (1.6%) 22 (3.9%)
Emotions
Excitement 188 (33.2%) 175 (30.7%)
Fear and anxiety 187 (33.0%) 173 (30.4%)
Happiness 116 (20.5%) 114 (20.0%) Curiosity 69 (12.2%) 60 (10.5%) Mixed feelings 67 (11.8%) 43 (7.5%) Disappointment 8 (1.4%) 11 (1.9%) Experiential process Answering questions 265 (46.8%) 160 (28.1%) Studying 123 (21.7%) 198 (34.7%) Difficulty 39 (6.9%) 24 (4.2%) Thinking 21 (3.7%) 37 (6.5%) Having fun 21 (3.7%) 20 (3.5%) Cheating vs. Honesty 13 (2.3%) 4 (0.7%) Silence 2 (0.4%) 11 (1.9%)
Reflecting on the percentage values of the evaluation domain, females seem to perceive tests more as grades, success vs. failure, and learning and development than males; whereas males think of intelligence more than females when hearing the word ‘test.’ Next, considering the emotions domain, females appear to be slightly higher in percentage when compared to males when feeling excitement, fear and anxiety, curiosity, and mixed feelings during tests; whereas males and females seem to be feeling happiness and disappointment in relatively similar percentages. Furthermore,
considering the experiential process domain, females appear to be higher in percentage than males perceiving tests as answering questions, difficulty, and cheating vs. honesty; whereas males, seem to be higher in percentage than females thinking of tests more as studying, thinking, and silence. Tests appear to remind both genders of having fun in similar percentages.
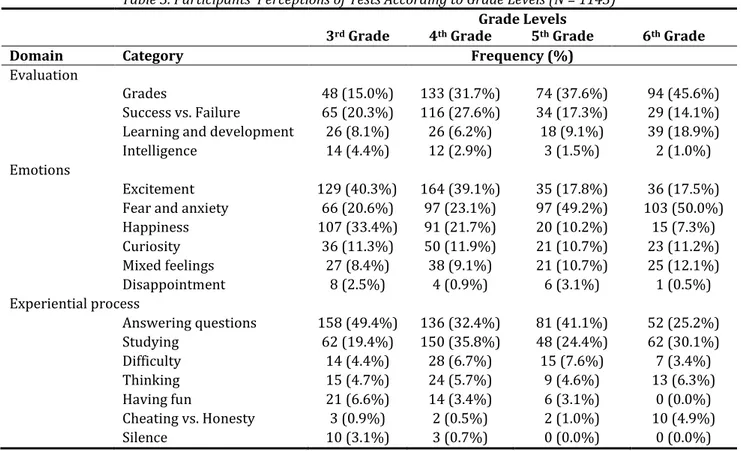
Finally, Table 3 illustrates students’ perceptions of tests according to their grade levels.
Table 3. Participants’ Perceptions of Tests According to Grade Levels (N = 1143)
Grade Levels 3rd Grade (n = 320) 4 th Grade (n = 420) 5 th Grade (n = 197) 6 th Grade (n = 206)
Domain Category Frequency (%)
Evaluation
Grades 48 (15.0%) 133 (31.7%) 74 (37.6%) 94 (45.6%)
Success vs. Failure 65 (20.3%) 116 (27.6%) 34 (17.3%) 29 (14.1%) Learning and development 26 (8.1%) 26 (6.2%) 18 (9.1%) 39 (18.9%)
Intelligence 14 (4.4%) 12 (2.9%) 3 (1.5%) 2 (1.0%)
Emotions
Excitement 129 (40.3%) 164 (39.1%) 35 (17.8%) 36 (17.5%) Fear and anxiety 66 (20.6%) 97 (23.1%) 97 (49.2%) 103 (50.0%) Happiness 107 (33.4%) 91 (21.7%) 20 (10.2%) 15 (7.3%) Curiosity 36 (11.3%) 50 (11.9%) 21 (10.7%) 23 (11.2%) Mixed feelings 27 (8.4%) 38 (9.1%) 21 (10.7%) 25 (12.1%) Disappointment 8 (2.5%) 4 (0.9%) 6 (3.1%) 1 (0.5%) Experiential process Answering questions 158 (49.4%) 136 (32.4%) 81 (41.1%) 52 (25.2%) Studying 62 (19.4%) 150 (35.8%) 48 (24.4%) 62 (30.1%) Difficulty 14 (4.4%) 28 (6.7%) 15 (7.6%) 7 (3.4%) Thinking 15 (4.7%) 24 (5.7%) 9 (4.6%) 13 (6.3%) Having fun 21 (6.6%) 14 (3.4%) 6 (3.1%) 0 (0.0%) Cheating vs. Honesty 3 (0.9%) 2 (0.5%) 2 (1.0%) 10 (4.9%) Silence 10 (3.1%) 3 (0.7%) 0 (0.0%) 0 (0.0%)
Regarding the evaluation domain, perceiving tests as grades seems to increase in percentage as the students’ grade levels increase. Similarly, tests appear to remind students more of learning and development as their grade levels increase. On the other hand, perceiving tests as intelligence appears to decrease as students get to higher grades. The category success vs. failure noticeably increases in 4th grade and then appears to decrease. Considering the emotions
domain, the percentage values of the students’ feelings of excitement and happiness seems to decrease by grade; whereas the percentage values of the feelings of fear and anxiety and mixed feelings seem to increase by grade. The feeling of curiosity appears to be in similar percentages across different grade levels. Lastly, considering the percentages of the experiential process domain, perceiving tests as answering questions appears to be highest in 3rd
grade students and studying for tests seems to be highest in 4th grade students. The experience of having fun in tests
seems to decrease in percentage value by grade levels, whereas the perception of cheating vs. honesty appears to increase in percentage value by grade levels.
Discussion and Conclusion
The aim of this study was to describe children’s perceptions of tests and their experiences with test taking through analyzing their responses to open-ended questions. More specifically, elementary and middle school students from 3rd,
4th, 5th, and 6th grades were asked what comes to their minds when they hear the word ‘test’ and how they feel during
test taking. Three main domains and seventeen categories at total emerged from the data. The domains and the categories under each domain were as follows: evaluation (grades, success vs. failure, learning and development, and intelligence), emotions (excitement, fear and anxiety, happiness, curiosity, mixed feelings, and disappointment), and experiential process (answering questions, studying, difficulty, thinking, having fun, cheating vs. honesty, and silence). The main findings have shown that a large percentage of students perceived tests to be an indicator of their grades and success levels; that they mostly experienced excitement or fear and anxiety during test taking; and they mostly thought of questions and answers or studying when they were asked about tests and the test taking process. Firstly, the students perceiving tests mostly as grades and success levels seem to be consistent with findings of previous research studies. As test anxiety was found to be highly associated with students’ academic achievement in previous studies (Crisan & Copaci, 2015; McDonald, 2001; Owens, Stevenson, Hadwin, & Norgate, 2012), students perceiving tests as grades and success levels makes sense. This is also an expected finding considering the Turkish educational system’s
heavy reliance on nationwide testing. As stated previously, students in Turkey enter nationwide exams following 8th
grade for high school education and 12th grade for undergraduate education or for an associate’s degree (Ministry of
National Education, 2016). When students have limited possibility of access to the schools they wish to study at, wanting to get the highest possible test score and defining one’s success through test scores become inevitable. Unfortunately, defining one’s success by test scores has the risk of increased anxiety in adulthood. Studying with the hope of getting a good grade and the pressure of keeping that up would most likely lead to anxiety and stress if not dealt with appropriately. It could also lead to relying too much on external motivators in life such as expecting applause for work done, instead of internal motivators such as doing the work because it gives one pleasure or helps him or her grow. Therefore, perceiving tests, as grades and success levels appear to have negative consequences for students. Next, students reported most commonly experiencing excitement or fear and anxiety during test taking. Either having positive (i.e., excitement) or negative (i.e., fear and anxiety) emotions, students seem to most frequently experience increased arousal during tests. Considering Yerkes and Dodson’s (1908) study, experiencing too much arousal, would lead to decreased performance in students. Therefore, when students’ emotions of excitement or anxiety and fear are too high, they would most likely perform poorly on tests. As there is a link between poor academic performance and depression (Frojd et al., 2008; Hysenbegasi, Hass, & Rowland, 2005; Owens, Stevenson, Hadwin, & Norgate, 2012), and test anxiety and depression (Yildirim, 2004), students with high arousal levels might be at risk for depression. In addition, thinking of questions and answers or studying when they are asked about tests and the test taking process, appear to be rather neutral responses. Taking into account that students spend significant amount of time studying and solving test questions while preparing for their actual tests, their responses seem to be expected.
Looking at the percentage values of females’ and males’ perceptions of tests, we see that females tend to think more about grades, success vs. failure, and learning and development in relation tests, whereas males equate intelligence more with tests when than females. Considering these findings, female students might be taking tests somewhat more seriously than male students. In other words, female students might be inclined to attribute more meaning to tests and want to get better grades, succeed, and further develop themselves. In line with these findings, females also appeared to be slightly higher in percentage than males when feeling excitement, fear and anxiety, curiosity, and mixed feelings during tests; whereas males and females seemed to be feeling happiness and disappointment in relatively similar percentages. There are several studies indicating no significant differences between female and male students’ test anxiety levels (Aydin & Bulgan, 2017; Putwain & Daniels, 2010; Yenilmez & Ozabaci, 2003; Yenilmez & Ozbey, 2006) and also studies indicating females report of higher test anxiety levels than that of males (e.g., Wren & Benson, 2004). Considering the heavy reliance on nationwide testing in Turkey and all students regardless of their gender going through similar experiences of entering exams that designate their future school options, both genders’ report of more or less similar levels of emotions with females being slightly higher in excitement, fear and anxiety, curiosity, and mixed feelings appear to be reasonable. Lastly, results have shown that females tended to think more about the process during test taking as indicated by their higher percentage of response to answering questions than males; and males tended to think more about the process of getting ready for the tests as indicated by their higher percentage of response to studying than females. These findings might be useful for teachers and schools counselors to consider when working with students and identifying the best ways to help them. For example, if female students think more about the testing process and male students that of the preparation process, giving strategies that help them specifically during these processes might be useful for students.
Finally, focusing on perceptions of tests according to grade levels, regarding the evaluation domain, perceiving tests as grades seems to increase in percentage as the students’ grade levels increase. This might be due to students realizing the heavy dependence the educational system has on tests and test grades. In addition, tests appear to remind students more of learning and development as their grade levels increase, which could be due to the students maturing in age and seeing tests as an opportunity to learn more and develop themselves further. The category success vs. failure noticeably increases in 4th grade and then appears to decrease, which is possibly due to students starting to take exams
in 4th grade in the current Turkish education system. Considering the percentage values of the emotions domain,
students’ feelings of excitement and happiness seems to decrease by grade; whereas feelings of fear and anxiety and mixed feelings seem to increase by grade. These findings indicate the unfortunate experience students are put through in the educational system, which decreases their enthusiasm and increases their fear and anxiety as they grow up. The feeling of curiosity, on the other hand, appears to be in similar percentages across different grade levels, which students reported as mostly related to the wonder of what was going to be asked in the exam. Lastly, considering the experiential process domain, perceiving tests as answering questions appears to be highest in 3rd grade students and
studying for tests seems to be highest in 4th grade students. Seeing tests as answering questions could be thought of as a
neutral response, which would make sense as the youngest grade level of students in the study reporting this finding. Similarly, the 4th grade students reporting the highest percentage of studying for tests among all grade levels seems to
an expected finding considering the 4th grade being the time students start taking in class exams. Students might be
more motivated to study for a test, when it is a novel experience.
In terms of the current study’s limitations, it is important to note that students’ self-reported responses could be over- or underestimated. Collecting data from teachers and/or parents in addition to students’ responses could have given more accurate information. Next, data were collected through open-ended questions that elementary and secondary
school students mostly responded with short phrases or sentences. Gathering information through semi-structured interviews would have given more in-depth information regarding students’ perceptions of tests and their experiences with the test taking process. Lastly, the data for the current study were collected from three public schools in Istanbul. Gathering data from private schools and from different cities of Turkey might have yielded different results.
The current study’s findings could initiate researchers to design further studies examining test anxiety and find useful ways for students to deal with their anxiety. As the study’s main findings pointed out that a large percentage of students perceived tests to be an indicator of their grades and success levels and that they mostly experienced excitement or fear and anxiety during test taking, practitioners such as school counselors or psychologists in private practice working with students from ages 8 to 13 could use the study findings to plan effective applications for treatment and prevention, which would influence students’ future achievement and experiences in testing. For example, school counselors could run group counseling programs addressing test anxiety or teachers could initiate application strategies such as deep breathing or mindfulness activities before giving tests in their classes so students would get into the habit of relaxing their minds and bodies before test taking that could change their experiences. In addition, teachers and school counselors could have class discussions around what tests mean for the students with the hope of them identifying concepts beyond grades and success levels. Being able to look at tests from a different or wider perspective could also little by little help change students’ experience of test anxiety. This study was a step in understanding students’ perceptions of tests. Continuing to conduct studies addressing issues that students experience with stress and anxiety would help students in their academic pursuits and increase their psychological wellbeing.
Acknowledgements
The present study is part of a larger project on children’s experiences with testing and test anxiety. The researcher would like to gratefully acknowledge Dr. Utkun Aydin and Cansu Paksoy for their contribution.
References
Ashcraft, M. (2002). Math anxiety: Personal, educational, and cognitive consequences. Current Directions in Psychological Science, 11(5), 181-185.
Aydin, U., & Bulgan, G. (2017). Cocuklarda Sinav Kaygisi Olcegi’nin Turkce uyarlamasi [Adaptation of Children’s Test Anxiety Scale to Turkish]. Ilkogretim Online [Elementary Education Online], 16(2), 887-899. DOI: 10.17051/ilkonline.2017.304742
Bodas, J., & Ollendick, T. H. (2005). Test anxiety: A cross-cultural perspective. Clinical Child and Family Psychology Review, 8(1), 65-88. doi: 10.1007/s10567-005-2342-x
Crisan, C., & Copaci, I. (2015). The relationship between primary school childrens’ test anxiety and academic performance. Procedia – Socail and Behavioral Sciences, 180, 1584-1589.
Bukulmez, E., & Tutkun, O. F. (2015). 8. Sinif ogrencilerinde sinav kaygisi ve ders calisma yaklasimlari arasindaki iliski. [The relationship between test anxiety and approaches for studying in 8th grade students]. In M. Elmas, A. Isman, C.
Sexton, D. Franklin, T. Franklin, & A. Eskicumali (Eds.), International Conference on Quality in Higher Education (pp. 5-14). Sakarya University, Turkey.
Dursun, S., & Bindak, R. (2011). Ilkogretim II. kademe ogrencilerinin matematik kaygilarinin incelenmesi. [The investigation of elementary school students’ mathematics anxiety]. Cumhuriyet Universitesi Sosyal Bilimler Dergisi [Cumhuriyet University Journal of Social Sciences], 35(1), 18-21.
Education Reform Initiative. (2014). Turkiye PISA 2012 analizi: Matematikte ogrenci motivasyonu, ozyeterlilik, kaygi ve basarisizlik algisi. [Analysis of Turkey’s PISA 2012 results: Student motivation, self-efficacy, anxiety, and perception of
failure in mathematics]. Retrieved March 5, 2017,
http://www.egitimreformugirisimi.org/wp-content/uploads/2017/03/PISA_2012_Paketi_Ogrenci_Analizi.Motivasyon.pdf
Erol, E. (1989). Prevalence and correlates of math anxiety in Turkish high school students. Unpublished Master’s Thesis, Bogazici University, Istanbul.
Frojd, S. A., Nissinen, E. S., Pelkonen, M. U. I., Marttunen, M. J., Koivisto, A. M., & Kaltiala-Heino, R. (2008). Depression and school performance in middle adolescent boys and girls. Journal of Adolescence, 31(4), 485-498.
Hancock, D. R. (2001). Effects of test anxiety and evaluative threat on students’ achievement and motivation. The Journal of Educational Research, 94(5), 284-290.
Hill, K. T., & Eaton, W. O. (1977). The interaction of test anxiety and success-failure experiences in determining children’s arithmetic performance. Developmental Psychology, 13(3), 205-211.
Hysenbegasi, A., Hass, S. L., & Rowland, C. R. (2005). The impact of depression on the academic productivity of university students. Journal of Mental Health Policy and Economics, 8(3), 145-151.
Kaya, M., & Savrun, B. M. (2015). Ortaogretime gecis sistemi ortak sinavlarina girecek ortaokul 8. sinif ogrencilerinin baglanma stilleri ile sinav kaygi duzeyleri arasindaki iliski. [Relationship between attachment styles and test anxiety of students who will take the common exam for transition to secondary education system]. Yeni Symposium, 53(3), 32-42.
Kirkaplan, M. (2015). Temel egitimden ortaogretime gecis (TEOG) ile ilgili 8. sinif ogrencilerinin sinav kaygi duzeylerinin incelenmesi. [The survey of the 8th grade students’ anxiety level about the passing from primary education to secondary education (TEOG)]. Unpublished Master’s Project, Pamukkale University, Denizli.
Lowe, P. A., & Ang, R. P. (2012). Cross-cultural examination of test anxiety among US and Singapore students on the Test Anxiety Scale for Elementary Students (TAS-E), Educational Psychology, 32(1), 107-126. doi: 10.1080/01443410.2011.625625
McDonald, A. (2001). The prevalence and effects of test anxiety in school children. Educational Psychology, 21(1), 89-101. doi: 10.1080/01443410020019867
Ministry of National Education. (2016). National education statistics: Formal education. Retrieved June 24, 2017, http://sgb.meb.gov.tr/meb_iys_dosyalar/2016_03/ 30044345_meb_istatistikleri_ orgun_egitim_2015_2016.pdf Oksal, A., Durmaz, B., & Akin, A. (2013). SBS’ye hazirlanan ogrencilerin sinav ve matematik kaygilarinin bazi degiskenler
acisindan incelenmesi. [An investigation into exam and maths anxiety of students preparing for SBS]. Cumhuriyet International Journal of Education, 2(4), 47-62.
Owens, M., Stevenson, J., Hadwin, J. A., & Norgate, R. (2012). Anxiety and depression in academic performance: An exploration of the mediating factors of worry and working memory. School Psychology International, 33(4), 433-449.
Ozcan, M. (2013). Okulda universite: Turkiye’de ogretmen egitimini yeniden yapilandirmak icin bir model onerisi. [University within school: A new model to re-structure teacher education in Turkey]. Istanbul: TUSIAD.
Peleg-Popko, O. (2002). Children’s test anxiety and family interaction patterns. Anxiety, Stress & Coping, 15(1), 45-59. Phillips, E. M. (1992). The effects of language anxiety on students’ oral test performance and attitudes. The Modern
Language Journal, 76(1), 14-26.
Putwain, D. W., & Daniels, R. A. (2010). Is the relationship between competence beliefs and test anxiety influenced by goal orientation? Learning and Individual Differences, 20, 8-13.
Segool, N. K., Carlson, J. S., Goforth, A. N., Von Der Embse, N., & Barterian, J. A. (2013). Heightented test anxiety among young children: Elementary school students’ anxious responses to high-stakes testing. Psychology in the Schools, 50(5),489-499.
Serdar-Kahveci, S. (2009). Ortaogretim kurumlarina gecis sisteminde uygulanan sinavlarin ailelere maliyetinin ailelerin toplam egitim harcamalari icindeki payi. [Costs associated with exams in transition from primary education to secondary education as proportion of total expenditures paid by families]. Unpublished Master’s Thesis, Gazi University, Ankara.
Tobias, S. (1985). Test anxiety: Interference, defective skills, and cognitive capacity. Educational Psychologist, 20(3), 135-142.
Wren, D. G., & Benson, J. (2004). Measuring test anxiety in children: Scale development and internal construct validation. Anxiety, Stress & Coping, 17(3), 227-240.
Yenilmez, K., & Ozabaci, N. S. (2003). Yatili ogretmen okulu ogrencilerinin matematik ile ilgili tutumlari ve matematik kaygi duzeyleri arasindaki iliski uzerine bir arastirma. [A study on the relationship between mathematics attitudes and mathematics anxiety of teacher boarding school students]. Pamukkale Universitesi Egitim Fakultesi Dergisi [Pamukkale University Journal of Education], 2(14), 132-146.
Yenilmez, K., & Ozbey, N. (2006). Ozel okul ve devlet okulu ogrencilerinin matematik kaygi duzeyleri uzerine bir arastirma. [A study on the mathematics anxiety levels of private school and public school students.]. Uludag Universitesi Egitim Fakultesi Dergisi [Uludag University Journal of Education], 19(2), 431-448.
Yerkes, R. M., & Dodson, J. D. (1908). The relation of strength of stimulus to rapidity of habit-formation. Journal of Comparative Neurology and Psychology, 18(5), 459-482. doi: 10.1002/cne.920180503
Yildirim, I. (2004). Depresyonun yordayicisi olarak sinav kaygisi, gundelik sikintilar ve sosyal destek. [Test anxiety, daily hassles, and social support as predictors of depression]. Hacettepe Universitesi Egitim Fakultesi Dergisi [Hacettepe University Journal of Education], 27, 241-250.