T.C.
BAHÇEŞEHİR ÜNİVERSİTESİ
An Early Warning System Approach for the Identification of Currency Crises
Master Thesis
Özerk Yavuz
2
T.C.
BAHÇEŞEHİR ÜNİVERSİTESİ
Institute of Sciences
Computer Engineering Graduate Program
An Early Warning System Approach for the Identification of Currency Crises
Master Thesis
Özerk Yavuz
SUPERVISOR: ASSOC. PROF.DR. ADEM KARAHOCA
3
T.C
BAHÇEŞEHİR ÜNİVERSİTESİ
The Graduate School of Natural and Applied Sciences
Msc. Computer Engineering
Title of the Master’s Thesis : An Early Warning System Approach for the Identification of Currency Crises
Name/Last Name of the Student : Özerk Yavuz Date of Thesis Defense : 12.06.2009
The thesis has been approved by the Graduate School of Natural and Applied Sciences.
Prof. Dr. A. Bülent ÖZGÜLER Director
This is to certify that we have read this thesis and that we find it fully adequate in scope, quality and content, as a thesis for the degree of Master of Science.
Examining Committee Members:
Assoc. Prof. Dr. Adem KARAHOCA (Supervisor) Prof. Dr. Nizamettin AYDIN
4 To My Parents
5 ACKNOWLEDGEMENTS
I would like to thank everyone who helped me during this study and one special person, my advisor Adem Karahoca for his guidence, support and invaluable advice on my thesis and studies.
I have been fortunate to have a great group of friends and proffesors at Bahcesehir University during my graduate school. I would also like to express my thanks to, Murat Acar for his valuable ideas about this research.
Finally I would like to dedicate this work to my family, Nihat and Emine Yavuz. Without your unending support and love from childhood to now, I never would have made it through this process or any of the tough times in my life. Thank you.
6
ABSTRACT
An Early Warning System Approach for the Identification of Currency Crises
Özerk Yavuz
Institute of Sciences, Computer Engineering Graduate Program
Supervisor: Assoc. Prof. Dr. Adem Karahoca
May 2009, 54 Pages
It is a known fact that currency crises can be extremely costly to the countries, institutions and businesses with its damaging long term effects. If the history of currency crises is investigated it would be understood that crises cause many hazarding effects on economies, business policies and assets .It would generally have short term and long term effects and often spill over, via a variety of channels to other countries and companies. In this study it is aimed to investigate the dominant factors that lead to currency crises, discover the nature and characteristics of currency crises and predict possible currency crises in an early phase which would save managers time for better crisis management policies and corrective actions.
7 In this study we employed data mining, a powerful quantitative method to construct an early warning system for the knowledge discovery and early prediction purposes of Currency Crises. Data mining has been successfully applied in many areas, such as finance, telecommunication, genetics, and marketing with the knowledge discovery and prediction purposes.
Keywords: Early Warning System, Adaptive Neuro Fuzzy Inference System, Currency Crises, Data Mining
8 ÖZET
Para Kuruna Dayalı Krizlerin Tahminlenmesinde Erken Uyarı Sistemi
Yaklaşımı
Özerk Yavuz
Fen Bilimleri Enstitüsi, Bilgisayar Mühendisliği Yüksek Lisans Programı
Tez Danışmanı: Doç. Dr. Adem Karahoca
May 2009, 54 Sayfa
Kur’a dayalı krizlerin reel sektör, ülkeler ve diğer iş kolları bazında değerlendirildiğinde birçok kısa ve uzun vadeli olumsuz etkisinin olduğu bilinen bir gerçektir. Bu kapsamda kura dayalı geçmiş krizler incelendiğinde bunların ekonomik, reel sektör politakaları ve mali varlıklar bazında ne denli kısa ve uzun vadeli olumsuz etkilerinin olduğu anlaşılacaktır. Yine bu etkilerin globalleşmenin ve onun getirdiği yeni anlayışların bir sonucu olarak bu etkileşime yol açan çeşitli kanal ve yollar aracılığıyla diğer ülkelere, sektörlere ve şirketlere sıçraması kaçınılmazdır. Bu ve benzer nedenlerden ötürü çalışmamızda para krizlerine yol açan ağırlıklı neden ve etkenler, bu tipteki krizlerin karakterini ve doğasını anlamamıza sağlayacak şekilde ele alınmış ve incelenmiştir. Edinilen sonuçlar ve bilgi kazanımıyla bu tip krizlerden etkilenen taraflara fayda sağlanması, yine kura dayalı krizlerin erken öngörülmesiyle ilgili karar mekanizmalarının ve
9 yöneticilerin daha etklili risk yönetimi politikaları izlemesi ve etkili önlemler almasına katkıda bulunulması amaçlanmaktadır. Bu amaçla güçlü kantitatif yöntemlerden sayılan veri madenciliği ve makine öğrenmesi yöntemlerinden yararlanılarak bir erken uyarı sistemi geliştirilmiştir. Literaturde bu ve benzer yöntemlerin finans , telekominikasyon ,genetik ,pazarlama gibi birçok alanda bilgi edinme ve öngürüde bulunma amaçlı kullanıldığı bilinmektedir.
Anahtar Kelimeler: Erken Uyarı Sistemi, Adaptive Neuro Fuzzy Inference System, Para Kuruna Dayalı Krizler, Veri Madenciliği
10
TABLE OF CONTENTS
1-INTRODUCTION ... 14
1.3DOMAIN AND INDICATORS OF CURRENCY CRISES IN LITERATURE... 18
2- MATERIAL AND METHODS ... 19
2.1DATA SET... 19
2.1.1DEFINITION OF INDICATORS CONSTITUTE DATA SET... 21
2.2METHODS... 24
2.2.1DATA MINING... 24
2.2.2MACHINE LEARNING... 27
3- EVALUATION METRICS FOR EARLY WARNING SYSTEMS... 38
3.1PRECISION AND RECALL... 39
3.3COVERAGE... 41
3.2STATISTICAL ACCURACY METRICS... 41
3.2.1 Mean Absolute Error ... 42
3.2.2 Mean Square Error ... 42
3.2.3 Root Mean Squared Error... 43
3.3RECEIVER OPERATING CHARACTERISTICS... 44
4. FINDINGS ... 46
5. CONCLUSION AND DISCUSSIONS ... 51
11
LIST OF TABLES
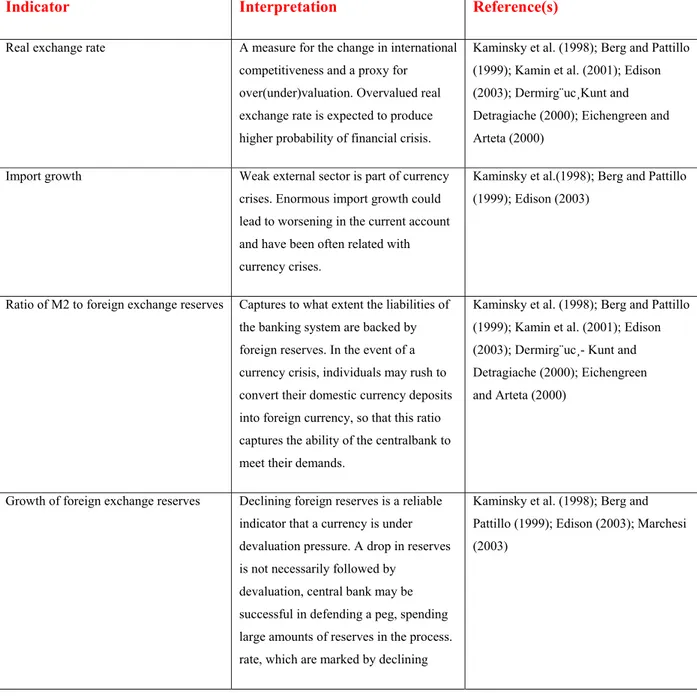
TABLE 1:EXTERNAL SECTOR INDICATORS IN CURRENCY CRISES PREDICTION... 21
TABLE 2:EXTERNAL SECTOR INDICATORS IN CURRENCY CRISES PREDICTION... 22
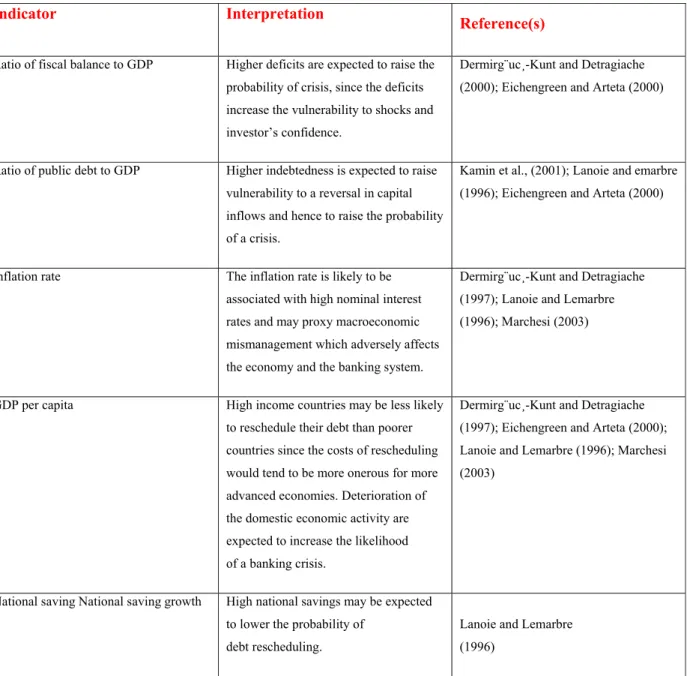
TABLE 3:DOMESTIC REAL AND PUBLIC SECTOR INDICATORS IN CURRENCY CRISES PREDICTION... 23
TABLE 4:DOMESTIC REAL AND PUBLIC SECTOR INDICATORS IN CURRENCY CRISES PREDICTION... 24
12
LIST OF FIGURES
FIGURE 1 DISTRIBUTION OF DATA... 20
FIGURE 2 DATA MINING CYCLE... 26
FIGURE 3 SAMPLE ROC CURVE... 44
FIGURE 4 ANFIS CURRENCY CRISES MODEL... 47
FIGURE 5INTERNATIONAL RESERVES/CRISES... 49
FIGURE 6FOREIGN EXCHANGE RESERVES... 49
FIGURE 7RATIO OF M2 TO FOREIGN EXCHANGE RESV. ... 50
13
LIST OF SYMBOLS/ABBREVIATIONS
Receiver Operating Characteristic : ROC
Mean Square Error : MSE
Mean Absolute Error : MAE
Root Mean Squared Error : RMSE
Hit Rate : HR
Data Mining : DM
Association Rule : AR
14
1-INTRODUCTION
1.1 Problem Definition
Currency Crises exposure a critical issue for public/private industries, organizations and societies and it is obvious that financial and currency crises can be extremely costly to the countries, institutions and businesses. Because of its band-wagon nature, crises often spill over via a variety of channels to other countries and companies and cause damaging effects on economic policies, business policies and assets. Therefore identification of dominant factors that lead to currency crises, investigating the characteristics and development cycle of currency crises an important role for risk management and corrective actions. In this study an Early warning system supported with a data mining point of view is one of the considerable and supportive methods for the effective prediction and knowledge discovery of currency crises.
Recent developments in information systems provide us with possibilities to discover valuable information about economic problems from recorded operational data. Data mining, a powerful quantitative method is one of the considerable approaches in this context. Data mining has been successfully applied in many areas, such as finance, telecommunication, genetics and marketing. In this thesis, we aimed to employ data mining techniques to construct early warning systems for the knowledge discovery and early prediction of “Currency Crises”. Such an early warning system can adaptively identify new problems in currency crises, aid in discovering possible causes of these crises, and monitor those causal factors to predict potential currency crises.
15 1.1.1 Societal Effects of Currency Crises
Financial and currency based crises can be very costly for countries, institutions and companies. Its harmful and negative effects don’t seem in a limited environment, instead often spill over multiple channels to other countries and companies with a domino effect. Therefore successful predictions and approaches in early determination of the crises would lead to better crises management policies, corrective actions that would minimize the effects on companies, local and global region.
1.2 Previous Early Warning System Approaches and Related Works in Currency Crises 1.2.1 What is the Aim of Early Warning Systems?
One of the major problems in crises management or risk management is attaining the correct solutions and policies in an early phase before it gets more complicated. Prediction of possible currency crises in an early phase would save related bodies and managers time for better crisis management policies. Early warning systems are well known in natural sciences. These systems, based on historical monitoring, local observation, or computer modeling, predict natural disasters, such as floods (Grijsen,1992) or earthquakes (Chung,1999), and help to prevent or reduce their impact.
Currency crises often coincide or occur in quick succession with other types of crises, for instance together with banking crises or what has been dubbed the twin crises. (Kaminsky and Reinhart, 1996). Therefore early prediction of currency crises would help to gain pre-impression on the other types of crises as well.
The recent early warning literature about currency crises shows that two frequently used methods in currency crises knowledge discovery and prediction purposes are limited dependent regression models( logit or probit model) or signaling models.
16 1.2.2 The leading indicator approach
The leading indicator approach developed by Kaminsky and Reinhart (1996). In this approach Kaminsky, Lizondo and Reinhart (1998) consider vulnerability indicators and transform them into binary signals: if a given indicator crosses a critical threshold, it is said to send a signal. For instance, if the current account deficit (expressed as a percentage of the GDP) falls below a given threshold, this particular indicator flashes a red light. Of course the lower the threshold, the more signals this Indicator will send over time, but at the cost of more “false alarms”, a particular issue that needs to be considered.
In signaling approach differences in the values of selected variables before and during the crises is observed and checked. In this way it is implied that which variables can be helpful in prediction of crises which are not. Kaminsky and Reinhart (1999), Kaminsky et al.(1998), Yap (1998), Kaminsky (1999), Edison (2003) and Alvarez-Plata and Schrooten (2004) used signaling approach which mainly optimizes the signal to noise ratio for the various potential indicators of crisis.
17 1.2.3 The discrete-dependent-variable approach (Logit and Probit)
In limited dependent regression model it is aimed to predict the probability of the occurrence of the crisis for the next period or the upcoming next k periods of time. Some of the studies that used this approach in previous literature work are, Eichengreen et al. (1994, 1996), Frankel and Rose (1996), Eichengreen and Rose (1998), Milesi-Ferretti and Razin (1998), Glick and Rose (1998), Glick and Moreno (1999), and Gochoco-Bautista (2000). Even if there are some differences in variable consideration of these previous papers the preferred method and approach for this problem is almost same. The advantage of limited dependent regression model is to represent all the information contained in the variables by giving the probability of the crisis (Kaminsky et al., 1998).
Problem Detection: Signals that trigger early warning usually appear as anomalies in monitored performance measures first: deviations from established norms and expected behavior. Deviation detection from various types of data is a prominent function of data mining (Freitas,1997). Literature shows the use of several data mining techniques to identify problems in currency crises prediction. One of the studies for this purpose is the use of a machine-learning fuzzy expert system to predict the currency crises effectively by Chin-Shien Lin (Lin,2008).
Finding Determinant Factors: In order to identify determinant factors for currency crises problems, ultimately the knowledge of domain experts is indispensable. However, data mining may help to quickly find candidate factors. Applicable data mining functions include causation modeling, factor selection, and to some extent classification and regression. Causation models describe causal relations between determinant factors and performance measures.
Prediction: Prediction of problems based on historical and current data of determinant factors is one of the principle requirements imposed by early warning. Fortunately one of the merits of data
18 mining techniques is prediction power. There are many success stories on application of data mining methods for prediction of currency crises and economic forecasting (Suh Son,2008)
1.3 Domain and Indicators of Currency Crises in Literature
Since the negative impacts of currency crises are countless many, to understand the characteristics of currency crises, many research activities and extensive modelling techniques performed over the past three decades. We can classify these approaches under three main titles as first, second and third generation models.
The 'first generation’ models of currency crises starts with Krugman’s paper (1979) in which the first approaches in the literature named. The 'second generation' models of currency crises starts with Obstfeld and Rogoff (1986) where they explained the rational factors that are related with crises (Obstfeld, 1986). 'Third generation' models of currency crises have explored which problems in financial systems and economies have effect on currency crises, and how crises can have real effects on the rest of the economy (Velasco, 2001) constitutes the recent approaches.
As already known there are many factors that lead to currency crises and changes in economic balances. Therefore to fully define the crisis concept is not that easy because of its subjective and speculative environment. Crises have quantitative as well as qualitative attributes.
It shouldn’t be underestimated that each of these factors and indicators do not have the equal weight and correlation on currency crises among others. Some of the measures and indicators that
19 are proposed and literally accepted to identify and understand the characteristics of Currency crises are as follow,
Real Exchange Rate which is known as a measure for the change in international competitiveness and a sign of over/under valuation Kaminsky (1998), Import growth Berg and Pattillo (1999); Ratio of M2 to foreign exchange reserves Kamin et al. (2001); Eichengreen and Arteta (2000), Ratio of M2 to foreign exchange reserves Kaminsky et al. (1998); Berg and Pattillo (1999); Kamin et al. (2001), M1 and M2 Growth Kamin et al. (2001), M2 money multiplier Kaminsky et al. (1998); Berg and Pattillo (1999); Edison (2003), Ratio of domestic credit to GDP Kaminsky et al. (1998); Berg and Pattillo (1999); Edison (2003); Excess real M1 balance Kaminsky et al. (1998); Berg and Pattillo (1999); Edison (2003), Lending and deposit rate spread Kaminsky et al. (1998); Berg and Pattillo (1999), Ratio of public debt to GDP, interest rate Edison (2003); Kamin et al. (2001);
2- Material and Methods
2.1 Data Set
As the Data Set, reliable official records of two sources Central Bank of Turkish Republic and Turkish Statistical Institute used. Data consists of the quarterly based leading indicator values between 1994 and 2005 used to predict currency crises.. Kaminski’s leading indicators of currency crises approach and other literature studies done in this area guided in determination and processing of these indicators.
In this data set the currency crises of Turkey are indicated with 1 in a separate crises labeled column whereas previous quarters of these crises segments were indicated with 0.5 (early warning quarters) and non crises areas were indicated with 0 of the same column. The
20 distribution of data among its position in the 0-1 range that is used to indicate crises, non-crises and early warning segments are as follow.
Real exchange rate, Import growth, Ratio of M2 to foreign exchange reserves, Growth of foreign exchange reserves, M1 and M2 growth, Ratio of domestic credit to GDP, Lending and deposit rate spread Excess real M1 balance, Domestic real interest rate, Lending and deposit rate spread, Ratio of fiscal balance to GDP, Ratio of public debt to GDP, Inflation rate, GDP per capital values are used as the 14 leading indicators of the model. The outputs corresponding to these indicators of the entity are defined with 0, 0.5 and 1 values. Crises periods are shown with 1, non crises periods shown with 0 and early warning signals are shown with 0.5. The distribution of the output space of the model can be seen in Fig .
21 2.1.1 Definition of Some of the Indicators Can Be Used For Currency Crises Prediction
Indicator Interpretation Reference(s)
Real exchange rate A measure for the change in international competitiveness and a proxy for over(under)valuation. Overvalued real exchange rate is expected to produce higher probability of financial crisis.
Kaminsky et al. (1998); Berg and Pattillo (1999); Kamin et al. (2001); Edison (2003); Dermirg¨uc¸Kunt and Detragiache (2000); Eichengreen and Arteta (2000)
Import growth Weak external sector is part of currency crises. Enormous import growth could lead to worsening in the current account and have been often related with currency crises.
Kaminsky et al.(1998); Berg and Pattillo (1999); Edison (2003)
Ratio of M2 to foreign exchange reserves Captures to what extent the liabilities of the banking system are backed by foreign reserves. In the event of a currency crisis, individuals may rush to convert their domestic currency deposits into foreign currency, so that this ratio captures the ability of the centralbank to meet their demands.
Kaminsky et al. (1998); Berg and Pattillo (1999); Kamin et al. (2001); Edison (2003); Dermirg¨uc¸- Kunt and Detragiache (2000); Eichengreen and Arteta (2000)
Growth of foreign exchange reserves Declining foreign reserves is a reliable indicator that a currency is under devaluation pressure. A drop in reserves is not necessarily followed by
devaluation, central bank may be successful in defending a peg, spending large amounts of reserves in the process. rate, which are marked by declining
Kaminsky et al. (1998); Berg and Pattillo (1999); Edison (2003); Marchesi (2003)
22
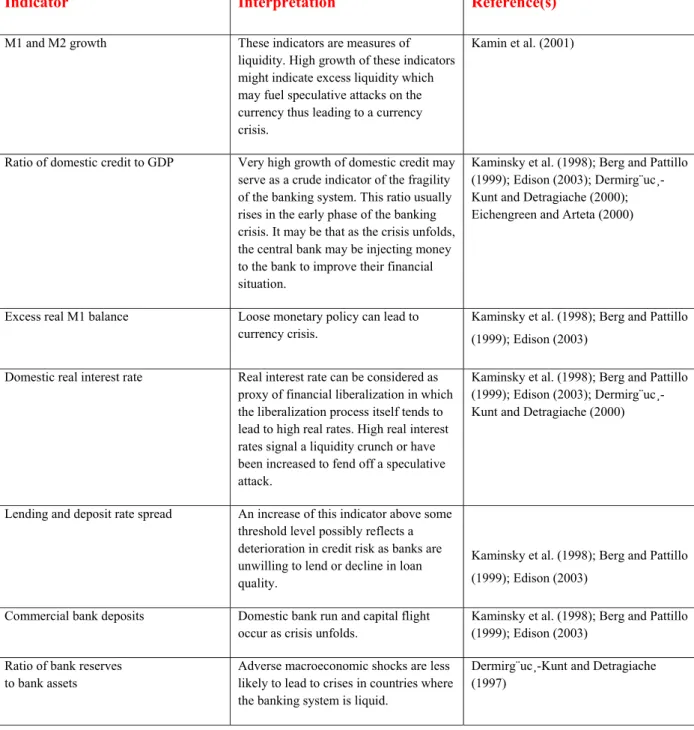
Indicator Interpretation Reference(s)
M1 and M2 growth These indicators are measures of liquidity. High growth of these indicators might indicate excess liquidity which may fuel speculative attacks on the currency thus leading to a currency crisis.
Kamin et al. (2001)
Ratio of domestic credit to GDP Very high growth of domestic credit may serve as a crude indicator of the fragility of the banking system. This ratio usually rises in the early phase of the banking crisis. It may be that as the crisis unfolds, the central bank may be injecting money to the bank to improve their financial situation.
Kaminsky et al. (1998); Berg and Pattillo (1999); Edison (2003); Dermirg¨uc¸-Kunt and Detragiache (2000); Eichengreen and Arteta (2000)
Excess real M1 balance Loose monetary policy can lead to currency crisis.
Kaminsky et al. (1998); Berg and Pattillo (1999); Edison (2003)
Domestic real interest rate Real interest rate can be considered as proxy of financial liberalization in which the liberalization process itself tends to lead to high real rates. High real interest rates signal a liquidity crunch or have been increased to fend off a speculative attack.
Kaminsky et al. (1998); Berg and Pattillo (1999); Edison (2003); Dermirg¨uc¸-Kunt and Detragiache (2000)
Lending and deposit rate spread An increase of this indicator above some threshold level possibly reflects a deterioration in credit risk as banks are unwilling to lend or decline in loan quality.
Kaminsky et al. (1998); Berg and Pattillo (1999); Edison (2003)
Commercial bank deposits Domestic bank run and capital flight occur as crisis unfolds.
Kaminsky et al. (1998); Berg and Pattillo (1999); Edison (2003)
Ratio of bank reserves to bank assets
Adverse macroeconomic shocks are less likely to lead to crises in countries where the banking system is liquid.
Dermirg¨uc¸-Kunt and Detragiache (1997)
23
Indicator Interpretation
Reference(s)
Ratio of fiscal balance to GDP Higher deficits are expected to raise the probability of crisis, since the deficits increase the vulnerability to shocks and investor’s confidence.
Dermirg¨uc¸-Kunt and Detragiache (2000); Eichengreen and Arteta (2000)
Ratio of public debt to GDP Higher indebtedness is expected to raise vulnerability to a reversal in capital inflows and hence to raise the probability of a crisis.
Kamin et al., (2001); Lanoie and emarbre (1996); Eichengreen and Arteta (2000)
Inflation rate The inflation rate is likely to be associated with high nominal interest rates and may proxy macroeconomic mismanagement which adversely affects the economy and the banking system.
Dermirg¨uc¸-Kunt and Detragiache (1997); Lanoie and Lemarbre (1996); Marchesi (2003)
GDP per capita High income countries may be less likely to reschedule their debt than poorer countries since the costs of rescheduling would tend to be more onerous for more advanced economies. Deterioration of the domestic economic activity are expected to increase the likelihood of a banking crisis.
Dermirg¨uc¸-Kunt and Detragiache (1997); Eichengreen and Arteta (2000); Lanoie and Lemarbre (1996); Marchesi (2003)
National saving National saving growth High national savings may be expected to lower the probability of
debt rescheduling.
Lanoie and Lemarbre (1996)
24
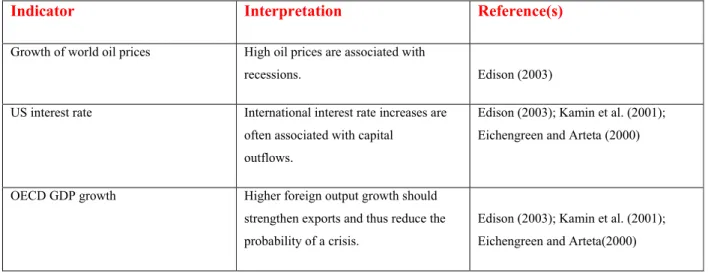
Indicator Interpretation Reference(s)
Growth of world oil prices High oil prices are associated with
recessions. Edison (2003)
US interest rate International interest rate increases are often associated with capital
outflows.
Edison (2003); Kamin et al. (2001); Eichengreen and Arteta (2000) OECD GDP growth Higher foreign output growth should
strengthen exports and thus reduce the probability of a crisis.
Edison (2003); Kamin et al. (2001); Eichengreen and Arteta(2000)
Table 4: Domestic Real and Public Sector Indicators in Currency Crises Prediction
2.2 Methods
2.2.1 Data Mining
Data mining can be defined as the process of extracting hidden patterns from large loads of data. The ambition of data mining can be knowledge discovery, prediction or forecasting. While knowledge discovery provides us explicit information about the characteristics of the data set predictive modeling provides predictions of future events. According to Simoudis , data mining is the process of extracting valid, previously unknown, comprehensible and actionable information from large databases and using it to make business decisions .(Simoudis,1996)
25 Data Mining is often used in fraud detection, risk assessment, and product retailing and involves data analysis methodologies to discover previously unknown, valid patterns and relationships among large data sets. With the enhancements in IT and recently discovered business needs the number of data sets and the information extracted from these data sets has grown in size and complexity.
Therefore analyzing of this enormous amount of data and discovering new meaningful patterns became important. For the solution of this, algorithms that include many mathematical and statistical methods are used and developed over time. Besides these algorithms are very good at solving related problems they are hard to understand by many end users if they are not brought with some case tools. Weka Platform which is developed by the University Waikato and consists of data pre-processing, classification, regression, clustering, association, and visualization activities can be used as a reference for this purpose.
In most of the areas as banking, telecommunication, medicine, retailing, data mining techniques and approaches are used to reduce costs, enhance research activities, and increase sales. In addition to the data mining techniques and approaches used, the quality of data has an overriding importance. Data quality definition here refers to the accuracy and reliability of data.
Within Data Mining it should not be underestimated that data mining can help reveal patterns and relationships, but does not tell the user the value or significance of these patterns. These types of determinations must be made by the user which requires some expert knowledge.
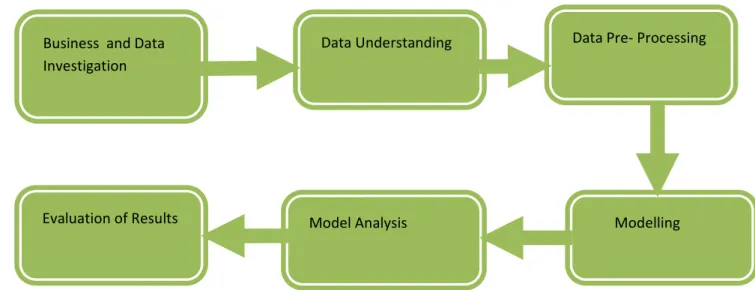
26 There are two approaches for data mining: verification driven, with the aim to confirm a hypothesis, or discovery driven, which is the automatic discovery of information by the use of appropriate tools. It should not underestimate that data mining can identify connections between behaviors and attributes but not a causal relationship. The underlying principle of the conventional scientific cycle “observation-hypothesis-experiment” fits well with processes of Data Mining. Discovery driven mining works well for the observation hypothesis step, whereas verification driven mining works well for the hypothesis experiment step (Crawford, 2006).
Fig 2: Data Mining Cycle
Business and Data Investigation
Modelling Model Analysis
Evaluation of Results
27 2.2.2 Machine Learning
Machine learning is a highly interdisciplinary field of research that is based on ideas and methods from statistics, mathematics, engineering, computer science and optimization theory which is used for the formal study of learning systems.
The technique used in the discovery of unknown significant patters is called modeling. In modeling, simply a model is built with the help of a set of examples or relationships based on data from situations where the answer is known and then applying the model to other situations where the answers aren’t known. Facts like computational power, amount of data are directly related with the processing time of applying trained model.
2.2.3 Supervised Learning
Supervised learning is one of the machine learning methods. In this form of machine learning a model is built from the training data set. The training data consist of pairs of inputs and expected outputs for these input pairs. System is trained model is built using the input and output pair information of the training data set. If the output value of the supervised function is continues it is called regression, if it is a class label of the input then it is called classification. The aim of the supervised learning is to make predictions with higher rates after trained with a set of training examples.
28 2.2.2 Reinforcement Learning
In reinforcement learning the system gets inputs, produces actions and receives rewards upon its actions. In this type of learning the model is not considered to be in a static world, instead it’s in a un-static world where it can contain other models which can also receive rewards, learn and act. The aim of this type of system m is to maximize rewards as similar to the game theory.
2.2.3 Unsupervised Learning
In unsupervised learning, all the observations are assumed to be caused by latent variables, that is, the observations are assumed to be at the end of the causal chain. In practice, models for supervised learning often leave the probability for inputs undefined. This model is not needed as long as the inputs are available, but if some of the input values are missing, it is not possible to infer anything about the outputs. If the inputs are also modeled, then missing inputs cause no problem since they can be considered latent variables as in unsupervised learning.
With unsupervised learning it is possible to learn larger and more complex models than with supervised learning. This is because in supervised learning one is trying to find the connection between two sets of observations. The difficulty of the learning task increases exponentially in the number of steps between the two sets and that is why supervised learning cannot, in practice, learn models with deep hierarchies.
29 2.2.4 Adaptive Neuro Fuzzy Inference System (ANFIS)
For the general understanding and review of ANFIS models and structures Brown and Harris’ studies may be used as references (Brown,1996),(Harris,1994) Detlef Nauck, Frank Klawonn and Rudolf Kruse (Nauck,1997) with J. S. R. Jang, C. T.Sun and E. Mizutani have given more detailed definitions of ANFIS methodology(Mizutani,1997). In a neural-fuzzy system it is benefited from both the features of neural networks and fuzzy systems .In these composition neural network algorithms have the role in determining the parameters of this system. As the consequence of the neural-fuzzy approach a system can be built or maintained automatically using neural network rules and methods.
Adaptive Neuro fuzzy inference system can be thought of as a 5 layer architecture each having a distinct functionality. The main issue in fuzzy logic is to map an input space to an output space among those 5 layers in a rule based approach. In our case to define a pattern as crises the range of factors and what we mean by the crises concept needed to be defined.
With the integration of fuzzy logic with neural networks one main disadvantage of fuzzy systems lack of learning transcended while leading the neural network features in terms of explicit knowledge designation.
The ANFIS approach uses Gaussian functions for fuzzy sets and linear functions for the rule outputs.
Layer 0: It consists of plain input variable set.
Layer 1 Every mode in this layer is an adaptive node with a node function where x (or y) is the input to node I and Ai (or Bi-2) is a linguistic label and O1,I is the membership grade of fuzzy set A ( = A1, A2, B1 or B2) and it specifies the degree to which the given input x (or y) satisfies the
30 quantifier A. The membership function for A can be parameterized membership function as given in equation 1 or normally known as
Bell function and {ai, bi, ci} is the parameter set
i i b i i A a c x x − + = 2 1 1 ) ( µ
Layer 2 Every node in this layer is a fixed node labeled II, whose output is the product of all the incoming signals Each node output represents the firing strength of a rule.
. 2 , 1 ), ( ) ( = = A x B y i wi µ i µ i
Layer 3: Every node in this layer is fixed and determines a normalized firing
strength. It calculates the ratio of the jth rule’s firing strength to the sum of all rules firing strength.
. 2 , 1 , 2 1 = + = i w w w w i i
Layer 4: Every node I in this layer is an adaptive node with a node function. Where i w is a normalized firing strength from layer 3 and { i i i p ,q , r } is the parameter set of this node. Parameters in this layer arereferred to as consequent parameters.
) ( i i i i i if w px q y r w = + +
31 Layer 5: The single node in this layer is a fixed node labeled Σ, which computes the overall output as the summation of all incoming signals. Overall output:
∑
∑
∑
= i i i i i i i i w f w f w 2.2.4 JRip MethodJRip implements a propositional rule learner, “Repeated Incremental Pruning to Produce Error Reduction” (RIPPER), as proposed by Cohen (1995). JRip is a rule learner alike in principle to the commercial rule learner Ripper.
RIPPER rule learning algorithm is an extended version of learning algorithm IREP
(Incrementa1 Reduced Error Pruning). It constructs a rule set in which all positive examples are covered, and its algorithm performs efficiently on large, noisy datasets. Before building a rule, the current set of training examples are partitioned into two subsets, a growing set (usual1y 2/3) and a pruning set (usual1y 1/3). The rule is constructed from examples in the growing set. The rule set begins with an empty rule set and rules are added incrementally to the rule set until no negative examples are covered. After growing a rule from the growing set, condition is deleted from the rule in order to improve the performance of the rule set on the pruning examples. To prune a rule, RIPPER considers only a final sequence of conditions from the rule, and selects the deletion that maximizes the function (see Eq.(1))
32 n p n -p PrNeg) PrPos, v(Rule, + ≡ (1)
where Rule is the set of rules, PrPos is the total number of examples in the considered cluster,
PrNeg is the total number of examples in the cluster not considered and p(n) is the number of
PrPos (PrNeg) examples covered by Rule. Whenever no deletion improves the value of function
w, learning process stops. Furthermore, after the rule is added to the rule set, the total description length of the rule is computed.
2.3.2. Part Method
The PART algorithm combines two common data mining strategies; the divide-and-conquer strategy for decision tree learning with the separate-and-conquer strategy for rule learning. The divide-and-conquer approach selects an attribute to place at the root node and “divides” the tree by making branches for each possible value of the attribute. The process then continues
recursively for each branch, using only those instances that reach the branch. The separate-and-conquer strategy is employed to build rules. A rule is derived from the branch of the decision tree explaining the most cases in the dataset, instances covered by the rule are removed, and the algorithm continues creating rules recursively for the remaining instances until none are left. The PART implementation differs from standard approaches in that a pruned decision tree is built for the current set of instances, the leaf with the largest coverage is made into a rule and the tree is discarded. By building and discarding decision trees to create a rule rather that building a tree incrementally by adding conjunctions one at a time avoids a tendency to over prune that is characteristic problem of the basic separate and conquer rule learner.
33 The key idea is to build a partial decision tree instead of a fully explored one. A partial decision tree is an ordinary decision tree that contains branches to undefined sub trees. To generate such a tree, we integrate the construction and pruning operations in order to find a stable sub tree that can be simplified no further. Once this sub tree has been found tree building ceases and a single rule is read (Frank and Witten, 1998).
The tree building algorithm splits a set of examples recursively into a partial tree. The first step chooses a test and divides the examples into subsets. PART makes this choice in exactly the same way as C4.5. Then the subsets are expanded in order of their average entropy starting with the smallest. The reason for this is that subsequent subsets will most likely not end up being
expanded and the subset with low average entropy is more likely to result in a small sub tree and therefore produce a more general rule. This continues recursively until a subset is expanded into a leaf and choose split of given set of examples into subsets while there are subsets that have not been expanded and all the subsets expanded so far are leaves choose next subset to be expanded and expand it if all the subsets expanded are leaves and estimated error for sub tree estimated error for node undo expansion into subsets and make node a leaf (Blackmore, 2002).
Unlike RIPPER it does not need to perform global optimization to produce accurate rule sets and this additional simplicity is its main advantage. When PART builds a rule, it removes the
instances covered by that rule and continues creating rules recursively for the remaining instances until none of them are left. It differs from the standard approach in the way that each rule is created. In essence to make a single rule a pruned decision tree is built for the current set of instances, the leaf with the largest coverage is made into a rule, and the tree is discarded. PART generalizes only when the implications are known so that it avoids fallacious generalizations.
2.3.3. Ridor Method
Ridor generates the default rule first and then the exceptions for the default rule with the least (weighted) error rate. Later, it generates the best exception rules for each exception and iterates until no exceptions are left. Thus it performs a tree-like expansion of exceptions and the leaf has
34 only default rules but no exceptions. The exceptions are a set of rules that predict the improper instances in default rules (Gaines and Compton, 1995).
Initially, Ripple Down Rules have been developed for knowledge acquisition and maintenance of rule-based systems. In knowledge acquisition and incremental rule learning, it is often hard to add new rules and certify that the adding of a rule will not cause the inconsistency of the rule base, causing the existing rules to perform badly in new classification tasks. As opposed to standard classification rules, induced by using a covering algorithm for rule set construction ripple down rules create exceptions to existing rules, so that the changes are confined to the context of the rule and will not affect other rules. Ripple Down Rules resemble decision lists which induce rules of the form “if-then-else”, as new RDR rules are added by creating except or else branches to the existing rules. If a rule fires but produces an incorrect conclusion then “an except” branch is created for the new rule. If no rule fires then “an else” branch is created for the new rule.
if a ^ b then c except if d then e else if f ^ g then h
The rule can be interpreted as “if a and b are true then we conclude c unless d is true. In that case we conclude e. If a and b are not true then we continue with the other rule and conclude h, if f and g are true.”
2.3.4. OneR Method
OneR, generates a one-level decision tree, that is expressed in the form of a set of rules that all test one particular attribute. 1R is a simple, cheap method that often comes up with quite good rules for characterizing the structure in data. Pseudo code for 1R is as follow (Frank and Witten, 2000);
35
For each attribute,
For each value of that attribute, make a rule as follows: Count how often each class appears
Find the most frequent class
Make the rule assign that class to this attribute-value. Calculate the error rate of the rules.
Choose the rules with the smallest error rates.
2.3.5. Nnge
Nearest-neighbor-like algorithm is using for non-nested generalized exemplars (which are hyper-rectangles that can be viewed as if-then rules) (Martin, 1995). In this method, we can set the number of attempts for generalization and the number of folder for mutual information.
2.3.6. Decision Tables
Decision tables are one of the possible simplest hypothesis spaces, and usually they are easy to understand. A decision table is an organizational or programming tool for the representation of discrete functions. It can be viewed as a matrix where the upper rows specify sets of conditions
36 and the lower ones sets of actions to be taken when the corresponding conditions are satisfied; thus each column, called a rule, describes a procedure of the type “if conditions, then actions”. Given an unlabelled instance, table classier searches for exact matches in the decision table using only the features in the schema (note that there may be many matching instances in the table). If no instances are found, the majority class of the decision table is returned; otherwise, the majority class of all matching instances is returned. To build a decision table, the induction algorithm must decide which features to include in the schema and which instances to store in the body.
Experimental results show that on artificial and real-world domains containing only discrete features, IDTM, an algorithm inducing decision tables, can sometimes outperform state-of-the-art algorithms such as C4.5. Surprisingly, performance is quite good on some datasets with
continuous features, indicating that many datasets used in machine learning may not require these features, or these features may have few values (Kohavi, 1995).
2.3.7. Conjunctive Rules
In Weka, this class implements a single conjunctive rule learner that can predict for numeric and nominal class labels. A rule consists of antecedents “AND”ed together and the consequent (class value) for the classification/regression. In this case, the consequent is the distribution of the available classes (or mean for a numeric value) in the dataset. If the test instance is not covered by this rule, then it's predicted using the default class distributions/value of the data not covered by the rule in the training data. This learner selects an antecedent by computing the information gain of each antecedent and prunes the generated rule using Reduced Error Pruning (REP) or simple pre-pruning based on the number of antecedents. For classification, the information of one antecedent is the weighted average of the entropies of both the data covered and not covered by the rule. For regression, the information is the weighted average of the mean-squared errors of both the data covered and not covered by the rule. In pruning, weighted average of the accuracy rates on the pruning data is used for classification while the weighted average of the mean-squared errors on the pruning data is used for regression.
37 2.3.8. AD Trees
AD Trees can be use for generating an alternating decision trees. The Weka’s this version currently only supports two-class problem. The number of boosting iterations needs to be manually tuned to suit the dataset and the desired complexity/accuracy tradeoff. Induction of the trees has been optimized, and heuristic search methods have been introduced to speed learning (Freund, Mason, 1999).
2.3.9. Nearest Neighbor Instance Based Learner (IB1)
IBk is an implementation of the k-nearest-neighbors classifier that employs the distance metric. By default, it uses just one nearest neighbor (k=1), but the number can be specified manually with –K or determined automatically using leave-one-out cross validation (Frank and Witten, 2000).
2.3.10. Bayesian Networks
There are no deterministic rules which allow to identify a subscriber as a risk indicator. Graphical models such as Bayesian networks supply a general framework for dealing with uncertainly in a probabilistic setting and thus are well suited to tackle the problem of prediction. Every graph of a Bayesian network codes a class of probability distributions. The nodes of that graph comply with the variables of the problem domain. Arrows between nodes denote allowed (causal) relations between the variables. These dependencies are quantified by conditional distributions for every node given its parents (Taniguchi, 1998).
38 A Bayesian network B over a set of variables U is a network structure Bs, which is directed acyclic graph(DAG) over U and set of probability tables Bp={p(u|pa(u))|u Є U} where pa(u) is the set of parents of u in Bs. A Bayesian network represents probability distributions (Bouckaert, 2004);
∏
∈= u U p u pa u
U
P( ) ( | ( )) (2)
3- Evaluation Metrics for Early Warning Systems
In this section, we introduce different types of evaluation metrics that we used to analyze performance of our early warning system. Performance of the early warning systems can be measured under two main categories Efficiency and Effectiveness (Rijsbergen, 1979). Efficiency is measured by the ratio of output over input, and effectiveness is measured by output quality.
There are several popular evaluation metrics available to measure performance of the early warning systems. But it is a challenging task to proof which algorithm is the best for given purpose. Because researchers disagree on which attributes should be measured, and on which metrics should be used for each attribute. Researchers who survey the literature will find different quantitative and qualitative metrics for performance evaluation of RS. Evaluating early warning systems and their algorithms is relatively hard for several reasons. First of all each algorithm has different behavior on different data sets.
39 The most popular and widely used techniques that we discuss in this section are Precision & Recall, Receiver Operating Characteristic (ROC), Coverage, Hit Rate (HR) and statistical accuracy metrics such as Mean Absolute Error (MAE), Mean Squared Error (MSE) and Root Mean Squared Error (RMSE).
3.1 Precision and Recall
In order to evaluate top-N early warning systems two metrics are widely used in Information Retrieval (IR): These are recall and precision. Precision is defined as the ratio of relevant recommended items to the total number of items recommended:
Where nrs is the number of relevant items selected and ns is the number of items selected.
Recall is defined as the ratio of relevant items selected to the total number of relevant items;
Where nrs is the number of relevant items selected and nr is the number of relevant items.
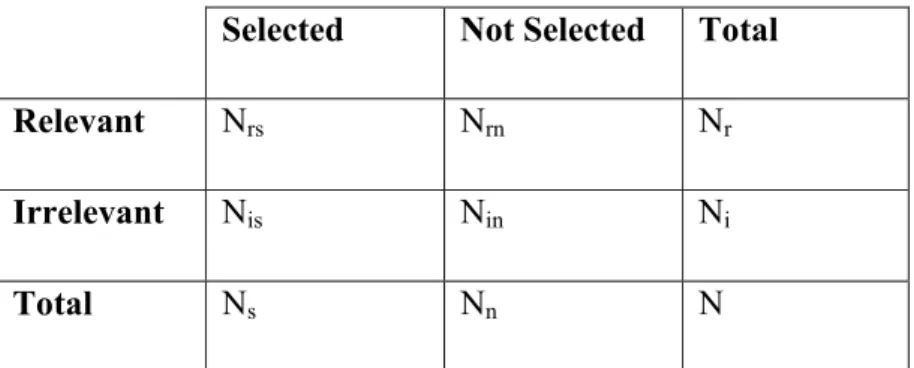
Precision and Recall are computed from a 2x2 matrix, shown in table 4.1. Item set must be separated into two classes which are relevant and not relevant. Also item set must be separated
40 into two different sets where one is selected which represent recommended items and other is not selected represents all items (Herlocker et al, 2004).
Selected Not Selected Total
Relevant Nrs Nrn Nr
Irrelevant Nis Nin Ni
Total Ns Nn N
Table 4.1: Generalized Precision & Recall matrix
3.2 Hit Rate
Hit Rate (HR) is a metric which can measure recommendation quality by looking at the number of hits within the top-N items that were recommended. The number of hits is the number of items in the test set that was also present in the top-N recommended items returned for each item. Hit rate is defined as follows:
41 Where n is the total number of items. HR equals to 1.0 indicates that the algorithm is always able to a recommend the hidden item, whereas HR equals to 0.0 indicates that the algorithm is not able to recommend any of the hidden items.
3.3 Coverage
Coverage is a measure of the percentage of items which CF algorithm can provide predictions. Early warning systems are usually not able to generate a prediction for some of the items because of the data sparsity or because of other factors such as low similarity values which are computed during the item-item matrix generation. Such cases lead to low coverage values. A low coverage value indicates that the early warning system is not able to recommend items for most of the items available in the system. High coverage value indicates that the early warning system is be able to provide recommend for most of the items that user interested. Coverage is defined as follows:
Where ni are the items available in the system and npi is the number of items which the early
warning system is able to generate a prediction.
3.2 Statistical Accuracy Metrics
Statistical recommendation accuracy metric measures the closeness between the numerical recommendations provided by the system and the numerical ratings provided by the user for the
42 same items. Common metrics used for this purpose are Mean Absolute Error, Mean Square Error and Root Mean Squared Error.
3.2.1 Mean Absolute Error
The MAE measures the average absolute deviation between a predicted rating and the user’s true rating.MAE is defined as follows:
Where pi is the predicted rating and the ri is the actual user ratings and N is the total number of the
item’s rated by the users.
3.2.2 Mean Square Error
The MSE measure is a variation of the MAE where the square the error before summing it instead of taking absolute value of the error. The result is more emphasis on large errors. For example, an error of one point increases the sum of error by one, but an error of two points increases the sum by four (Herlocker et al, 2004). MSE is defined as follows:
43 Where pi is the predicted rating and the ri is the actual user ratings and N is the total number of the
item’s rated by the users.
3.2.3 Root Mean Squared Error
RMSE is a measure of error that is biased to weigh large errors disproportionately more heavily than small errors. In most of the cases RMSE indicates better accuracy than MAE.
Where pi is the predicted rating and the ri is the actual user ratings and N is the total number of the
44 3.3 Receiver Operating Characteristics
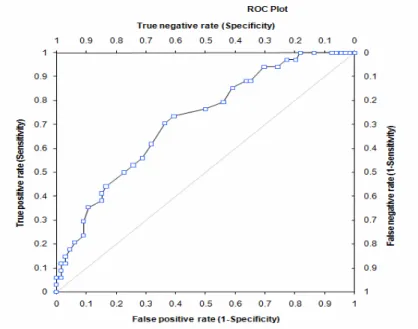
Recently, ROC analysis became the most common accuracy metric to analyze performance of the early warning systems. ROC graph is a technique for visualizing, organizing and selecting classifiers based on their performance. One of the earliest adopters of ROC graphs in machine learning was Spackman (1989), who demonstrated the value of ROC curves in evaluating and comparing algorithms.
Fig 3: Sample ROC curve
ROC sensitivity can be a good metric for measuring the system’s ability to discriminate between good and bad recommendations, independent of the search length (Herlocker et al, 2004). ROC sensitivity denotes the Area Under the Curve (AUC), commonly referred to as the ROC curve, is a measure of the diagnostic power of a filtering algorithm. A ROC curve plots the sensitivity and the specificity of the filtering test. More accurately, it plots sensitivity and 1-specificity. The ROC curve ranges from 0 to 1.
45 Sensitivity (eq-1) is the probability of a randomly selected good recommendation actually being rated as good, and as a result being accepted by the filtering algorithm. Specificity (eq-2) is the probability of a randomly selected bad recommendations actually being rated as bad.
p n Y True Positives False Postives N False Negatives True Negatives Totals P N ,
It is important to note that there exists a trade-off between sensitivity and specificity. Any increase in sensitivity will be accompanied by a decrease in specificity. The area under the ROC curve, corresponding to ROC sensitivity, and increases as the filter is able to detect more good recommendations and at the same time decline more bad recommendations. An area of 1 represents the perfect filtering algorithms, while an area of 0.5 represents a random filter (Vozalis & Margaritis, 2003).
46
4. Findings
Neural Network representations and approaches in data mining may be considered as the adaptation of neural activity and connectivity among neuron cells in human brain. It consists of a large number of nodes which processes the variables maps these set of inputs to the processed outputs. The constructed model based on this definition with the previously discussed indicators can be seen in Fig 4.
In this model each neuron residing in the input layer represents the linguistic variables that indicates the currency crises (which we have 14 in our research).This layer feeds the neurons in hidden layers of the system with corresponding membership functions. This finally continues till reaching to a final output in a rule based approach. The process to construct this type of model generally consists of three major steps, fuzzification, inference, and defuzzification, which are described briefly as follows.
In this context two types of previously discussed learning methods supervised and unsupervised learning may be used. In supervised learning model learns the weight values of the edges among neurons from a set of input-output pairs and unsupervised which only needs the input values. In this research our main concentration is on supervised way of machine learning.
In the ANFIS model developed in Fig2, Real exchange rate, Import growth, Ratio of M2 to foreign exchange reserves, Growth of foreign exchange reserves, M1 and M2 growth, Ratio of
domestic credit to GDP, Lending and deposit rate spread Excess real M1 balance, Domestic real interest rate, Lending and deposit rate spread,
Ratio of fiscal balance to GDP, Ratio of public debt to GDP, Inflation rate, GDP per capital values are used as the 14 leading indicators of the model. With the ANFIS model these indicators are mapped and transferred to an output space among those 5 layers composed of transfer functions and 28 generated rules. In the output space crises periods are shown with 1, non crises periods shown with 0 and early warning signals are described with 0.5. %66 of this input ,output pairs used to train the system. The remaining part of it used for the testing purposes.
47
Fig. 4: ANFIS Currency Crises Model
The results gathered from the training and testing of the system indicate that ANFIS would be a powerful approach to determine currency crises and make predictions with a higher correctness rate. Such that %90 of the test samples were correctly classified.
For the comparison of ANFIS with other machine learning approaches, Root Mean Squared Error, which is known to be a good estimator in statistics, is used. RMSE simply quantifies the amount by which an estimator differs from the true value of the quantity to be estimated. The difference occurs because of randomness or because the estimator doesn't account for information that could produce a more accurate estimate (Chang, 2001).
48 ANFIS Model Statistics
Number of nodes: 857
Number of linear parameters: 420
Number of nonlinear parameters: 784
Total number of parameters: 1204
Number of training data pairs: 79
Number of fuzzy rules: 28
RMSE 0.2043
Method RMSE Precision Correct Incorrectly Classified True/Positive Rate False /Positive Rate Bayesnet 0.1682 0.933 91.6667% 8.3333 0.917 0.042 Ridor 0.2402 0.912 90.2256 % 9.7744 % 0.902 0.048 PART 0.2824 0.888 87.9699 % 12.0301 % 0.88 0.06 J48 0.2713 0.914 88.4615 % 11.5385 % 0.885 0.059 Nnge 0.1883 0.936 92.3077 % 7.6923 % 0.923 0.048 K Means 0.2087 0.944 93.3333 % 6.6667 % 0.933 0.033 AD tree 0.2722 0.898 88.8889 % 11.1111 % 0.889 0.057 IB1 0.1828 0.927 92.6667 % 7.3333 % 0.927 0.037 JRip 0.4714 0.5 66.6667 % 33.3333 % 0.667 0.167 ANFIS 0.2043 0.944 93.3333 6.6667 % 0.933 0.033
49
Figure 5: International Reserves/ Crises
50
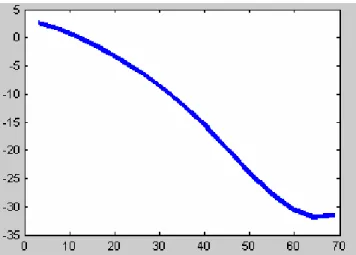
Figure 7: Ratio of M2 to Foreign Exchange Reserves
Figure 8: Real Exchange Rate
Looking at the Root Mean Square Error, Correctness and Precision values of the ANFIS model, we can say that the model is good enough with the 0.2043 Root Mean Square Error value to
51 predict and classify currency crises correctly. In addition to this, the correctness value of the system is 93.33 % and the precision is seen as 0.94 .
5. Conclusion and Discussions
In this thesis we investigated the leading indicators that have importance in the knowledge discovery and prediction of recent currency crises. We reviewed previous studies and researches that are good to be known as Kaminsky et all in this domain.
Looking at the literature signal approach, data mining and probit models are some of the most frequently used methods and approaches in this research field. For a different contribution to the domain we concentrated on the investigation of the topic from a data mining and machine learning perspective developing an ANFIS model that may be used for the knowledge discovery and prediction of currency crises in earlier phases. Kaminsky’s leading indicator approach guided us in selection of these 14 indicators that can be used as the dominant descriptors of currency crises.
The developed model using ANFIS technique and reliable data of Turkish Statistical Institute is consistent enough to be used in the prediction and KD of currency crises in Turkey. For the evaluation of the data and model accuracy some of the frequently used statistical error measures are used. RMSE is one of them. To verify and measure the correlation rates of each indicator we used other classification and clustering algorithms as well. J48, K Means, Bayesian Net , JRip can be counted as some of these algorithms.
To sum up we have met our objectives which were to evaluate and investigate the suitability and performance of Analytical Fuzzy Inference System in currency crises prediction at an earlier
52 phase .Depending on the pretty consistent results with high correctness and lower RMSE measures we think that ANFIS is a good and suitable technique to be used as a supportive method in the early prediction of currency crises with the previously described indicators above. Real Exchange Rate , Import growth Berg , Ratio of M2 to foreign exchange reserves M1 and M2 , M2 money multiplier, Ratio of domestic credit to GDP , Excess real M1 balance Lending and deposit rate spread ,Ratio of public debt to GDP, interest rate are some of the most dominant and quantitative factors in description and knowledge discovery of currency crises. However it should not underestimated that in addition to this quantitative dimension currency crises, has qualitative and speculative attributes.
Depending on the country, currency and other regional factors, the weight and importance of each indicator can vary. But as the experimental results of our data set, currency rate, change in foreign reserves, change in interest rates are more effective indicators among others in currency crises prediction which suits to the financial index definition of Kaminsky and Reinhart proposed in 1999.
In higher ratio of fiscal balance to GDP the probability of crisis is expected to raise, since the deficits increase the vulnerability to shocks and investor’s confidence. Higher indebtedness is expected to raise vulnerability to a reversal in capital inflows and hence to raise the probability of a crisis which is measured with the ratio of public debt to GDP. Ratio of domestic credit to GDP is also a weighted indicator of currency crises which rises in the early phase of the crises.
Another way of summarizing it is that currency crises is effected primarily by the speculative transitions from national money rates to foreign values which would cause the devalue or loose value of that money rate. Money authorities would try to control this, using foreign currency reserves and increase interest rates.
53
References
[1] Brown M. & Harris C (1994). Neurofuzzy adaptive modeling and control: First Edition.
Prentice Hall International. England
[2] Brown M. (1996). An Introduction to Fuzzy and Neurofuzzy Systems. Prentice Hall
International. England
[3] Chang R. & Velasco A. (2001), A model of currency crises in emerging markets. Quarterly Journal of Economics. (pp. 489-517)
[4] Chung J.K. , Shin T.C., Hsiao N.C., Tsai Y.B., Lee W.H.K. & Teng T.L.(1999).
Development of an integrated earthquake early warning system in Taiwan Case for the Hualien area earthquakes. (pp. 719-736). Terrestrial Atmospheric And Oceanic Sciences
[5] Crawford, J. & Crawford, F. (1996). Data Mining in a Scientific Environment. In AUUG 96 &Asia Pacific World Wide Web 2nd Joint Conference. Australia
[6] Freitas A.A. (1997). , Generic, Set-Oriented Primitives to Support Data-Parallel Knowledge
Discovery in Relational Database Systems, University of Essex, Ph.D. Thesis
[7] Grijsen J.G., Snoeker C. , & Vermeulen C. (1992). An IS for flood early warning. In 3rd
international conference on floods and flood management. Florence, Italy: Delft Hydraulics Publication
[8] Jang J. , Sun C. & Mizutani E. (1997). Neurofuzzy and soft computing, A computational
approach to learning and machine intelligent. Prentice Hall International. United States of America
[9] Krugman P. (1979), 'A model of balance-of-payments crises: Journal of Money, Credit, and Banking 11, (pp. 311-25)
[10] Lin C.S. (2008) , A new approach to modeling early warning systems for currency crises:
Can a machine-learning fuzzy expert system predict the currency crises effectively?, Journal of International Money and Finance 27
[11] Nauck D. , Klawonn F. & Kruse R. (1997). Foundations of Neuro-Fuzzy Systems. John Wiley & Sons Ltd. England
[12] Obstfeld M. & Rogoff K. (1986), Rational and self-fulfilling balance-of-payments crises.
54
[13] Simoudis, E. (1996). Reality Check for Data Mining. IEEE EXPERT, 11(5), 26-33
[14] Son S. (2008) , An early warning system for global institutional investors at emerging stock markets based on machine learning forecasting, Elsevier