Proceedings of the World Congress on Civil, Structural and Environmental Engineering (CSEE’16) Prague, Czech Republic – March 30 – 31, 2016
Paper No. ICESDP 103 DOI: 10.11159/icesdp16.103
Flow Velocity Effect on Clear Water Bridge Pier Scour
Mehmet Öner Yeleğen
1, Ali Uyumaz
21Fatih Sultan Mehmet Vakif University, Faculty of Engineering, Civil Engineering Department
Beyoğlu, Istanbul, Turkey
2Istanbul Technical University, Civil Engineering Faculty, Hydraulics Laboratory
Maslak, Istanbul, Turkey
moyelegen@fsm.edu.tr; uyumaz@itu.edu.tr
Abstract- For a long while, scour mechanism has been a major problem to be solved by many researchers. Local scour phenomenon
at bridge piers has many parameters such as flow characteristics, sediment type, bridge pier shape and alignment. To find a general scour equation under the same conditions, the effect rate of any parameter has to be determined. After the determination phase, the rectifier coefficients for a valid equation can be easily calculated for scour estimation. In order to specify whether the scour condition is clear-water or live-bed, the velocity parameter has to be substituted into scour equations because the determinative factor between these two conditions is the flow velocity. Accordingly in this study, the effect of the ratio of mean approach flow velocity to the critical mean approach flow velocity for entrainment of bed sediment (V/Vc) has been investigated. Three of the mostly used empirical scour
formulations, did not take into account the flow velocity, but they are rectified to verify this effect. The data set belongs to four previous studies. Since the parameter, V/Vc, is a dimensionless factor the physical characters of these equations are not altered
significantly. However, importation of this parameter into the currently available formulations improves the calculation results in significant manner.
Keywords: Scour, Clear Water, Velocity Effect, Bridge Pier, Zero-Dimensional
1. Introduction
Scour is one of the most important causes in bridge failure. The mechanism is also very complex. According to some researchers, more than 1,000 bridges have collapsed in United States only during the last 30 years according to some researchers. The majority of these collapses were caused by scour interaction [1,2].
The cause of the scour is simply erosive action of flowing water. This action causes removing of bed materials from the river bed, around the bridge piers or abutments (Fig. 1). There are many factors that affect the scour magnitude such as flow angle and strength, depth of water, pier/abutment shape and diameter, sediment type and so on.
This paper presents the importance of the flow velocity in calculation of scour depth at bridge piers. The data that is used to verify the effect of V/Vc belong to four different laboratory studies [3]. The Mean Absolute Error (MAE), Root
Mean Square Error (RMSE) and coefficient of determination (R2) values are compared between the existing equations and
improved equations (IE). The results show that inclusion of V/Vc ratio provides more reliable scour depth calculation.
2. Scour definition and mechanism
Scour is a result of the flowing water that carries away the sediments from the riverbed, pier or abutment foundations. It may occur on a restricted area such as at the foundation of bridge or abutments and that is called local scour. Moreover it may occur on the whole surface of the original riverbed which is called live-bed scour (Fig. 1).
According to Chabert et al. [4] there are two types of scour definition that changes depending on the flow velocity character. One of them is clear-water scour, where sediments move from scour holes, but not replaced by the approach flow. The other is live-bed scour, where the scour hole is continuously replenished with sediment by the approach flow. The determinative factor between clear water and live-bed scour is the ratio of flow velocity, V, to the critical flow velocity, Vc (Fig. 2). Accordingly, without their ratio, V/Vc, multiplier, scour character cannot be defined whether it is
Fig. 1: Illustration of scour phenomenon.
Fig. 2: The variation of scour type with flow velocity ratio [5].
Moreover Melville et al. [3] has investigated the effect of time scale for local scour at bridge piers and suggested a three dimensional graph that shows the variation between flow velocities, local scour depths and time (Fig. 3).
Many researchers investigated different parameters to solve the scour phenomenon. Some of those parameters are discharge, culvert slope, climate change, cohesion and pier shape [6-10].
To point out the effect of flow velocity ratio, V/Vc, to scour depth, three of mostly used scour depth equations in
practical use are not taking into account the flow velocity. Inclusion of this non-dimensional ratio, V/Vc, does not harm the
physical meanings of existing equations. In addition, the selected equations have to be used for calculating clear water scour corresponding to circular piers and uniform bed material.
3. Empirical Formulae and Data Sets
Up to the present, field and laboratory data are used by many researchers to predict or calculate scour depths [4, 11-17]. Researchers tried to establish some models and write equations to express the best scour prediction. In this case, parameter selection is a crucial task to represent the physics of event. Melville [16] tried to attract the attention to the importance of this issue.
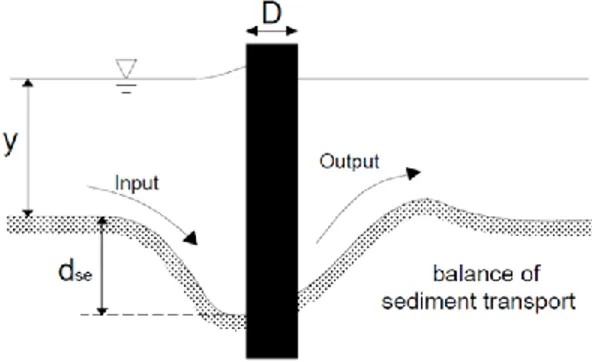
Local scour occurs around bridge piers or abutments. In Figure 4, some parameters of local scour can be easily seen including dse as equilibrium scour depth, y as approach flow depth, D as abutment or pier diameter, inputs and outputs as
bed sediment.
Fig. 4: Local scour parameters.
There are numerous empirical equations for local scour depth estimations at bridge piers. In this paper, three of the most commonly used formulations are used without considering the role of the flow velocity in the local scour depth calculations. These three equations are given in Table 1 [11-13].
Table 1: Empirical formulae used for calculating scour depth.
1 Laursen (1958) 𝑑𝑠 𝑏= 1.34*( 𝑑0 𝑏) 0.5 2 Breusers et al. (1977) 𝑑𝑠 𝑏= 2.0tanh ( 𝑑0 𝑏) 3 Jain et al. (1979) 𝑑𝑠 𝑏 = 1.85𝐹𝑟𝑐 0.25(𝑑0 𝑏) 0.3
On the other hand, the empirical formulae with V/Vc multiplier are given in Table 2.
Table 2: Improved empirical formulae used for calculating scour depth.
1 Laursen (1958) 𝑑𝑠 𝑏 = 1.34∗ ( 𝑑0 𝑏) 0.5 ∗𝑉 𝑉𝑐
2 Breusers et al. (1977) 𝑑𝑏𝑠= 2.0∗ tanh (𝑑𝑏0) ∗𝑉𝑉
𝑐 3 Jain et al. (1979) 𝑑𝑠 𝑏 = 1.85∗ 𝐹𝑟𝑐 0.25(𝑑0 𝑏) 0.3 ∗ 𝑉 𝑉𝑐
The parameters in these equations are pier diameter, b, bridge pier width, d0, critical Froude number, Frc, and the
output of the system is scour depth, ds. As one can see from Table 1, all of the equations are standardized, namely they are
converted into dimensionless forms. In addition, there is no velocity parameter which gives an idea about the scour character whether it is clear-water or live-bed scour.
To show the importance of velocity ratio effect in the scour depth calculation, these equations are applied to the data set which is acquired from Melville et al [3]. The parameters and the dataset ranges are given in Table 3.
Table 3: Ranges of used datasets.
Parameter Unit Data Range
D mm 16-200 d50 mm 0,8-7,8 y mm 20-600 V min/s 0,165-1,208 te min 1,235-840 V/Vc (non-dimensional) 0,4-1,0 dse mm 2-318
The parameters of given data in Table 2 are the ratio of flow velocity to the critical flow, V/Vc, median size of the
sediment particle distribution, d50, mean approach flow depth, y, mean approach flow velocity, V, the time elapsed to
equilibrium scour depth, te and the equilibrium scour depth, dse, which is the output the models. The three empirical
formulations are applied to all these dataset. The parameters that are included in the calculations are pier diameter, b, the ratio of flow velocity to the critical flow, V/Vc, velocity of the flow to calculate the Froude number, V, and the equilibrium
scour depth, dse. The number of used data is 84 all of which correspond to circular piers; uniform bed material and
clear-water scour condition.
3.1. Scour Depth Calculation
In order to see the performances of those selected equations, the calculated and observed values are plotted on same scatter diagrams. The scatter diagrams for scour depth calculations between the empirical and improved equations are given in Figures 5, 6 and 7.
Fig. 5: Scatter diagrams for observed and calculated scour depths a) Laursen equation b) Improved Laursen equation.
0 50 100 150 200 250 300 350 400 450 500 0 50 100 150 200 250 300 350 400 450 500
Observed Scour Depth (mm)
C a lc u la te d S c o u r D e p th ( m m ) a 0 50 100 150 200 250 300 350 400 450 500 0 50 100 150 200 250 300 350 400 450 500
Observed Scour Depth (mm)
C a lc u la te d S c o u r D e p th ( m m ) b
Fig. 6: Scatter diagrams for observed and calculated scour depths a) Breusers equation b) Improved Breusers equation.
Fig. 7: Scatter diagrams for observed and calculated scour depths a) Jain equation b) Improved Jain equation.
As it is seen from Figure 5, Laursen [11] equation usually over calculate the scour depths. V/Vc multiplier corrected
some lower scour depth values and these values caused the scatter diagram approach to 45o straight-line, which shows
better calculation. In Figure 6, Breusers [12] prediction values are just slightly better than Laursen equation. In Figures 6 and 7, V/Vc velocity multiplier improved results of the scour depth scatters are shown.
4. Interpretation and Verification of Results
To find out the differences between the existing and improved equations, some quantitative measures are used for the comparison of error amounts among different alternative solutions. Different error comparison methods are in use in practical applications such as Root Mean Square Error (RMSE), Mean Absolute Error (MAE) and Determination Coefficient (R2). All of these tools are commonly used as standard statistical methods to measure the performance of
models in many studies such as meteorology, climate change and many other disciplines. The mathematical expression for the RMSE is given as follows.
0 50 100 150 200 250 300 350 400 450 500 0 50 100 150 200 250 300 350 400 450 500
Observed Scour Depth (mm)
C a lc u la te d S c o u r D e p th ( m m ) a 0 50 100 150 200 250 300 350 400 450 500 0 50 100 150 200 250 300 350 400 450 500
Observed Scour Depth (mm)
C a lc u la te d S c o u r D e p th ( m m ) b 0 50 100 150 200 250 300 350 400 450 500 0 50 100 150 200 250 300 350 400 450 500
Observed Scour Depth (mm)
C a lc u la te d S c o u r D e p th ( m m ) a 0 50 100 150 200 250 300 350 400 450 500 0 50 100 150 200 250 300 350 400 450 500
Observed Scour Depth (mm)
C a lc u la te d S c o u r D e p th ( m m ) b
𝑅𝑀𝑆𝐸 = √1 𝑛∑ 𝑒𝑖 2 𝑛 𝑖=1 (1)
where e symbolizes the errors between the existing and improved equation results and n is the number of samples. Similarly, the explicit expression for MAE is given below.
𝑀𝐴𝐸 =1
𝑛∑|𝑒𝑖| 𝑛
𝑖=1
(2)
Especially in statistics, the coefficient of determination denoted by R2 is a parameter that shows how well the model
fits the measurements. In many disciplines R2 is used by many researchers, whose main purpose is to test their hypotheses
by comparing the measurements with predictions.
𝑅
2=∑ (𝑦̂𝑖 𝑛𝑖=1 −𝑦̅)2 ∑𝑛𝑖=1(𝑦𝑖−𝑦̅)2
(3)
where y denotes the measured values of the dependent variable, 𝑦̅ is the mean of these measured values and 𝑦̂𝑖 as the model estimation value.
Some researchers suggested MAE instead of RMSE because of RMSE is misleading indicator of the average error property [18]. On the other hand, Chai et al. [19] demonstrated that RMSE is not an ambiguous method like what was pointed out by Wilmott et al. [20]. In order to make a better comparison, RMSE, MSE and R2 values are calculated for all
the equations and their resultants can be compared from Table 4.
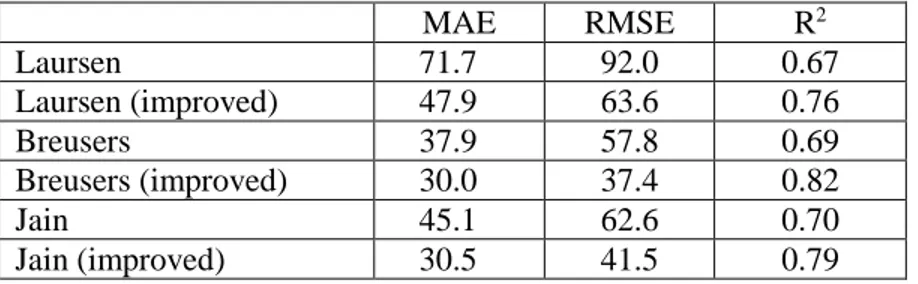
Table 4: Comparison of RMSE, MAE and R2 values for the literature and suggested formulae.
MAE RMSE R2 Laursen 71.7 92.0 0.67 Laursen (improved) 47.9 63.6 0.76 Breusers 37.9 57.8 0.69 Breusers (improved) 30.0 37.4 0.82 Jain 45.1 62.6 0.70 Jain (improved) 30.5 41.5 0.79
As it is seen from this table, the lowest RMSE and MAE values belong to the improved equation of Breusers and therefore, it is recommended for use in practical applications. The performance of the improved equation of Jain is very close to Breusers equation. As well as the best R2 value also belongs to improved Breusers equation. Table 4 also shows
that all the results for RMSE and MAE have lower values in cases of improved equations because of the velocity multiplier inclusion. Improvements in errors clearly show that the ratio of flow velocity to the critical flow velocity is a significant parameter for scour depth calculation.
Furthermore MAE, RMSE and R2 values for existing empirical formulae and the improved alternatives are given in
Figure 8. It is easily seen from this graph that MAE and RMSE values are decreasing in a positive manner when the V/Vc
multiplier is added to the existing empirical formula. Similarly, R2 values are increasing in a positive way for the same
Fig. 8: MAE, RMSE and R2 values for empirical and improved formulae.
4. Conclusion
For a long while, there have been different models established for calculating the scour depth. Because of the complexity of this hydraulic problem, researchers tried to find the main parameters and the best model. Determination of the effective parameters has always been a major problem. In this study, an attempt is made to assess the effect of the flow velocity ratio parameter role in the scour depth estimations. Three of the commonly used formulations are chosen from literature and they do not take into account the flow velocity ratio as a parameter. With the inclusion of the velocity ratio factor into the existing equations improved alternatives are suggested in this paper. Root Mean Square Error (RMSE), Mean Absolute Error (MAE) and coefficient of determination (R2) values are calculated for both existing and improved
equations. It is easily seen from the study that equations which consider the flow velocity ratio provide improved and better calculations than others. The improvements in RMSE and in MAE are over 60% and 70%, respectively for all equations. The positive variation in R2 values are approximately more than 10% for all equations.
All of these results show that the ratio of flow velocity to the critical flow velocity is an important parameter in calculation of scour depth. Future research works may focus in this direction, i.e. to find out how the scour depth varies for the lower and higher values of this ratio.
References
[1] A. M. Shirhole and R. C. Holt, “Planning for a Comprehensive Bridge Safety Program,” Transportation Research Record 1290, Transportation Research Board, National Research Council, Washington, D. C., USA, vol. 1, pp. 39-50, 1991.
[2] J. Kattell and M. Eriksson, “Bridge Scour Evaluation: Screening, Analysis & Countermeasures,” USDA Forest Service San Dimas Technology and Development Center San Dimas, California, USA, 1998.
[3] B. W. Melville and Y. M. Chiew, “Time scale for local scour at bridge piers,” J. Hydraul. Eng., vol. 125, no. 1, 1999. [4] J. Chabert and P. Engeldinger, “Etude des Affouillements autour des Piles des Ponts,” Laboratoire National
d’Hydraulique, Chatou, 1956.
[5] A. J. Raudkivi, “Functional trends of scour at bridge piers,” J. Hydraul. Eng., vol. 112, no. 1, pp. 1-13. 1986.
[6] S. R. Abt, J. F. Ruff and F. K. Doehring, “Culvert slope effects on outlet scour,” J. Hydraul. Eng., vol. 111, no. 10, pp. 1363-1367, 1985.
[7] A. Uyumaz, “Scour downstream of vertical gate” J. Hydraul. Eng., vol. 114, pp. 811–816, 1988.
[8] A. Molinas, N. G. Reiad and J. S. Jones, “Effect of cohesion on abutment scour,” in Proceedings of the In Stream Stability and Scour at Highway Bridges: Conferecence Sponsored by Hydraulics Division of ASCE, Memphis, Tennessee, August 3-5, 1998
[9] B. D. Barkdoll, “Effects of climate change on bridge scour,” inWorld Environmental and Water Resources Congress, Albuquerque, New Mexico, United States, 2012, pp. 2532-2537.
[10] Y. Chiew, J. Hong and M. Qi, “Suction effects on bridge pier scour under clear-water conditions,” J. Hydraul. Eng., vol. 139, no. 6, pp. 621-629, 2013.
[12] H. N. C. Breusers, G. Nicollet and H. W. Shen, “Local scour around cylindrical piers.” J. Hydraul. Res., vol. 15, no. 3, pp. 211-252, 1977.
[13] S. C. Jain, and E. E. Fischer “Scour around bridge piers at high Froude numbers,” FHWA-RD, Federal Highway Administration, U.S. Dept. of Transportation, Washington, DC., 1979, pp. 79-104.
[14] R. Ettema, “Scour at bridge piers,” Report No. 216. School of Engineering, University of Auckland, New Zealand, 1980.
[15] R. K. W. Chee, “Live-bed scour at bridge piers,” Report No. 290, School of Engineering, University of Auckland, New Zealand, 1982.
[16] B. W. Melville, “Pier and Abutment Scour: Integrated Approach,” J. Hydraul. Eng., vol. 123, no. 2, 1997.
[17] M. Ö. Yeleğen, “Investigation of Scour at Bridge Piers Using Data Analysis Methods,” M.Sc. Dissertation, Dept. Civil Eng., Hydraulics Division, Istanbul Technical University, Istanbul, Turkish, 2014.
[18] C. Willmott and K. Matsuura, “Advantages of the Mean Absolute Error (MAE) over the Root Mean Square Error (RMSE) in assessing average model performance,” Clim. Res., vo. 30, pp. 79-82, 2005.
[19] T. Chai and R. R. Draxler, “Root mean square error (RMSE) or mean absolute error (MAE)?,” Geoscientific Model Development Discussions, vol. 7, pp. 1525-1534, 2014.
[20] C. J. Willmott, K. Matsuura and S. M. Robeson, “Ambiguities inherent in sums-of-squares-based error statistics,” Atmospheric Environment, vol. 43, no. 3, pp. 749-752, 2009.
![Fig. 2: The variation of scour type with flow velocity ratio [5].](https://thumb-eu.123doks.com/thumbv2/9libnet/4517735.80398/2.918.208.693.178.683/fig-variation-scour-type-flow-velocity-ratio.webp)