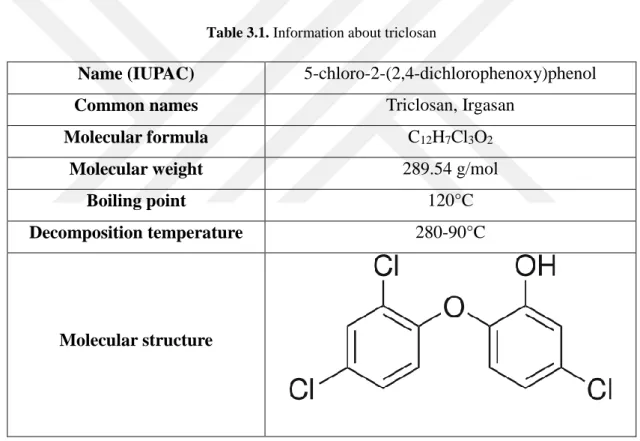
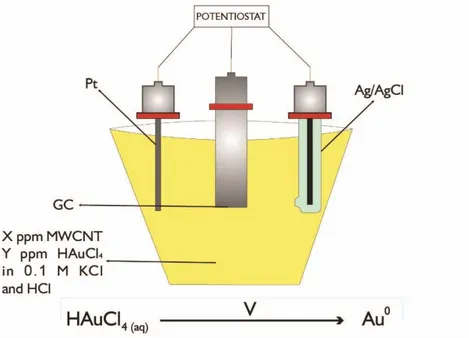
Preparation of modified glassy carbon electrodes for voltammetric determination of triclosan
Tam metin
Şekil
Benzer Belgeler
Several researches have been conducted on acoustic emission signal analysis during the testing of composite materials [97–100] These signals categorized damage based on
Direct electron/ion beam exposure and XeF 2 assisted etching were applied on high density polyethylene (HDPE), Melinex ® and polypropylene (PP) samples, in order
an electrical equivalent circuit will be presented to predict the behavior of the resonator without finite element simulations.. Finally, simulation results will be
Yine Birleşmiş Milletler Yolsuzlukla Mücadele Sözleşmesi’nin 7 nci maddesinin 3 üncü fıkrasına göre “her Taraf Devlet ayrıca, bu Sözleşmenin amaçları
2018 yılında Milli Eğitim Bakanlığı’na (MEB) ayrılan bütçe rakamlarına bakıldığında, iktidar temsilcilerinin aksi yöndeki tüm iddia ve çarpıtmalarına
Depending upon the envisaged type of divorce, the procedure to be followed might differ considerably. Besides the standard civil procedure, the Austrian legal system provides
Primer cerrahi uygulanan olgulardan İİAB sonucunda düşük dereceli neoplazi ile uyumlu bulgular saptanan dört olgu, benign sitolojik bulgular saptanan bir olgu ve tanısal
Köroğlu Destanı, Dede Korkut Destanları'ndan farklı olarak hâlâ sözlü gelenekte yaşayan ve bütün Türk âleminde bir çok varyantları bulunan belki
