https://doi.org/10.1007/s00276-020-02560-1
ORIGINAL ARTICLE
The effect of age, BMI, and bone mineral density on the various
lumbar vertebral measurements in females
Umut Canbek1 · D. Burcu Hazer Rosberg2,3 · Hans Eric Rosberg3 · Tuğba Dübektaş Canbek4 · Ulaş Akgün1 ·
Ayhan Comert5
Received: 21 June 2019 / Accepted: 17 August 2020 © Springer-Verlag France SAS, part of Springer Nature 2020
Abstract
Purpose Healthy spinal balance is dependent on spinal sagittal alignment. It is evaluated by several spinopelvic measures. The objective of this study is to investigate the effect of age and body mass index and the bone mineral density on the several vertebral measures and sagittal spinopelvic measurements.
Methods In this cross-sectional study, a total of 89 female patients were grouped according to age (> 70, < 70); to BMI (underweight (< 18.5 kg/m2), normal weight (18.5–25 kg/m2), overweight (25–30 kg/m2); and to spine T scores (normal, osteopenia, and osteoporosis). On lateral lumbar X-ray, lumbar lordosis (LL) angle and pelvic incidence (PI) are measured. On sagittal T2 MRI images, anterior and posterior vertebral heights and foraminal height and area of the L1–L5 segments were measured.
Results The mean age of the participants was 70.54 ± 6.49. The distribution of the patients in BMI groups and BMD groups were even. Mean lumber lordosis (LL) was 48.27 ± 18.06, and the mean pelvic incidence (PI) was 60.20 ± 15.74. In the younger age group, LL was found to be higher than the older age group. The vertebral and spinopelvic angle measures within the different BMI and BMD groups revealed no difference in between. There were no statistically significant difference in correlation analysis.
Conclusion In this cross-sectional study, the results revealed that younger patients have higher lordosis angle, and normal BMD patients have higher foraminal height and area measures than osteoporotic and osteopenic patients. Obesity seemed not to have any influence on vertebral measures. Spinopelvic parameters seem not to be effected by BMD and BMI.
Keywords Age · Body mass index · Foraminal height · Foraminal area · Bone mineral density · Vertebral measures · Vertebral angle · Spinopelvic angle
Introduction
Spinal sagittal alignment is the major element for normal spinal function and spinal balance. It is evaluated by sev-eral spinopelvic measures [9]. The most important sagit-tal spinopelvic measurement modifiers are sagitsagit-tal vertical axis (SVA), pelvic tilt (PT), and pelvic incidence (PI) [9,
15]. Adult spinal deformity (ASD), which is mostly associ-ated with low back pain, is defined as the disturbed spinal sagittal alignment that causes severe functional disability [12]. It is present in population over 50 years of age and effects mostly lumbar segment of the spine [6, 12]. Female population is known to be more prone to suffer from ASD [12]. The degree of severity of the symptoms in ASD is correlated to the alterations in spinopelvic parameters [1,
6]. However, recent studies have challenged this impact of
* Ayhan Comert
1 Department of Orthopaedics and Traumatology, Faculty of Medicine, Mugla Sitki Kocman University, 48000 Mugla, Turkey
2 Department of Neurosurgery, Faculty of Medicine, Mugla Sitki Kocman University, 48000 Mugla, Turkey
3 Department of Translational Medicine, Skane University Hospital, Lund University, Malmö, Sweden
4 Department of Internal Medicine, Mugla Sitki Kocman University Training and Research Hospital, 48000 Mugla, Turkey
5 Department of Anatomy, Ankara University School of Medicine, 06100 Sihhiye, Ankara, Turkey
sagittal spinopelvic measurements on health status and dem-onstrated weak correlations with clinical outcome [3, 11].
Spinal sagittal alignment is shown to be affected by many variables such as age, sex, weight, pelvic morphology, and bone mineral density [5]. Although it is presented that decreased bone mineral density (BMD) is one of the sus-pected causes of sagittal imbalance [7], there is a study doc-umenting no relations between BMD and thoracic kyphosis in elderly [18]. This information points out that normal spi-nal function depends not only on BMD but also several other factors [27]. The objective of this study is to investigate the effect of age and body mass index and the bone mineral den-sity of the vertebral body on the sagittal spinopelvic meas-urements and foramen height, foramen area, and vertebral anterior and posterior height of the vertebrae.
Materials and methods
In this cross-sectional study, a total of 89 female patients who were examined in Department of Orthopedics Mugla Sitki Kocman University Hospital between January 2017 and January 2018 were included. The inclusion criteria were to be female patients who were suffering from low back pain over 50 years of age. Also, the candidates who have anterior–posterior lumbar X-ray radiographies and a lumbar MRI within the year of the examination were included to the study. Patients who has had spine surgery were excluded from the study. Diabetes, malignancies, or any treatment which may influence bone metabolism, such as estrogen receptor modulators or calcium treatment, were also excluded from the study.
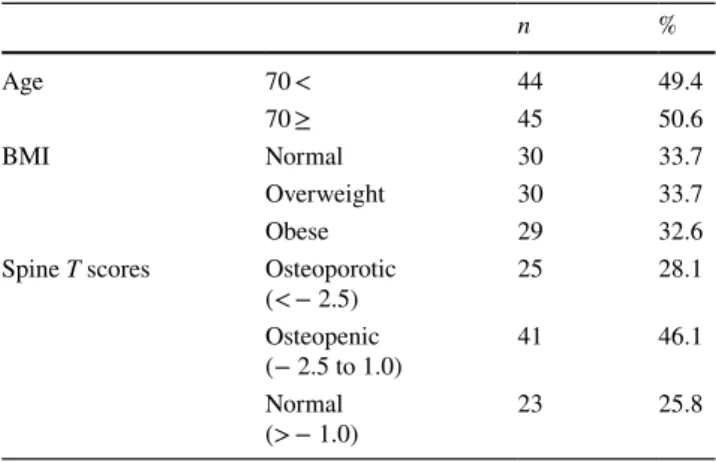
To ease the statistical analysis, we have grouped the patients as over and equal to 70 years of age, and lower 70 years of age. Similarly, the BMI ranges were used to classify the underweight (< 18.5 kg/m2), normal weight (18.5–25 kg/m2), overweight (25–30 kg/m2), and obese (> 30 kg/m2). The BMD measurements of anteroposterior lumbar spine were performed using a dual-energy X-ray absorptiometry (DXA) machine (Stratos DR 2D Fan Beam DEXA, DMS™, 2009). In accordance with the World Health Organization criteria, normal BMD was defined as a value less than 1 standard deviation (SD) below the young adult peak BMD (T score), osteopenia was defined as a value ranging from 1.0 to 2.5 SD below the young adult peak BMD, and osteoporosis was defined as a value equal to or greater than 2.5 SD below that of the young adult peak BMD [16]. Standard reference data of country where the study was performed were used for the T score calculations (Table 1).
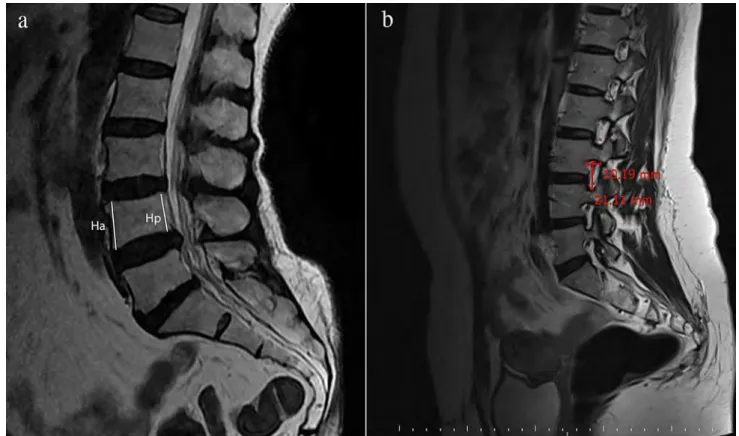
MRI image tracing and measurement of the lumbosa-cral spine was performed by Sigma HDx 1.5™ Viewer, UK with the subject in the routine supine position with the hips and knees flexed. The sagittal T2-weighted images of
the lumbosacral MRI were used for the measurements. The anterior and posterior vertebral height measures were per-formed on the midline sagittal section in which the spinous processes are visible and the dural sac is widest [23]. The foraminal heights were measured where the foramen is in largest dimension for each segment individually from L1–2 to L5–S1 (Fig. 1) [25]. It was documented as the longest distance between the border of superior and inferior pedicle. The foraminal area was calculated manually by this equation as follows:
Foraminal area = (anteroposterior [AP] diame-ter/2) × (foraminal height/2) × Π [2].
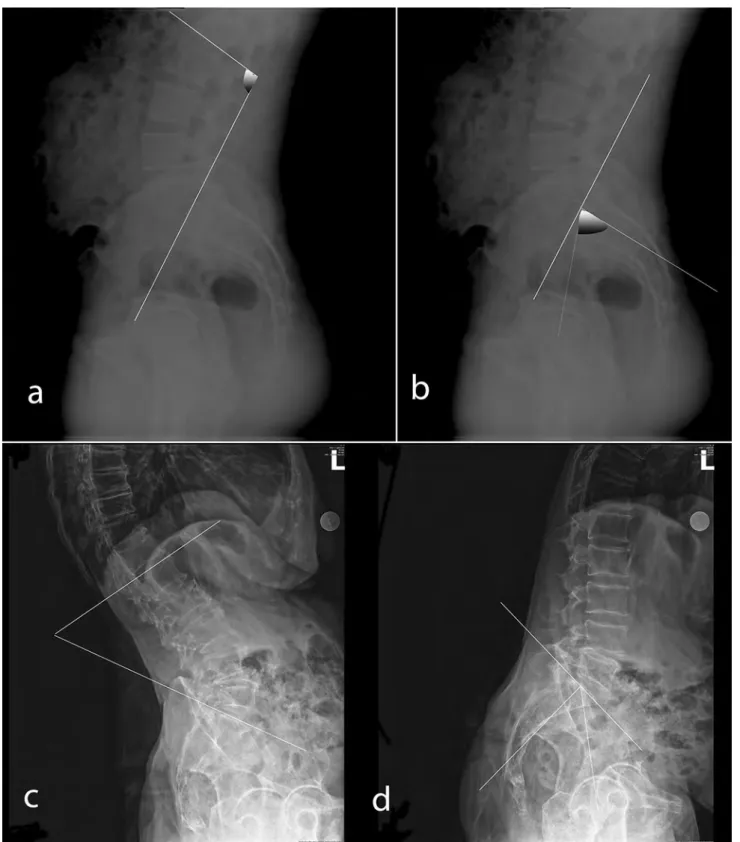
Lumbar lordosis angle (LL) and pelvic incidence (PI) were measured from a series of complete standing anter-oposterior and lateral full-length spine radiographs [1, 22]. LL and PI are measured on the lateral spine graphs. LL is measured as the angle between straight lines from upper end plates of the L1 vertebrae and S1 vertebrae [1]. Pelvic Incidence (PI) is measured as the angle between the per-pendicular to the sacral plate at its midpoint and the line connecting this point to the middle axis of the femoral heads (Fig. 2) [1]. All measurements were performed by a single physician (DBHR) blinded to the clinical data.
Statistical analysis
Statistical analysis between age and vertebra measurements was done by Student’s t test. Statistical analysis between BMI and vertebral measurements were done by F test, and to identify the statistical significance within the BMI groups, Bonferroni analysis was performed. Similarly, F test was used to identify the statistical significance in between Spine
T scores and vertebrae measurements. Bonferroni analysis
was performed to seek the statistical significance within the Spine T scores. A p value of < 0.05 was considered sta-tistically significant. Additionally, the Pearson correlation analysis for the vertebrae and foraminal measurements with the variables of age, spine T score values and BMI of the
Table 1 Group classifications of the patients are presented
n % Age 70 < 44 49.4 70 ≥ 45 50.6 BMI Normal 30 33.7 Overweight 30 33.7 Obese 29 32.6
Spine T scores Osteoporotic
(< − 2.5) 25 28.1
Osteopenic
(− 2.5 to 1.0) 41 46.1 Normal
patients were evaluated. A p value less than 0.05 was con-sidered significant.
Results
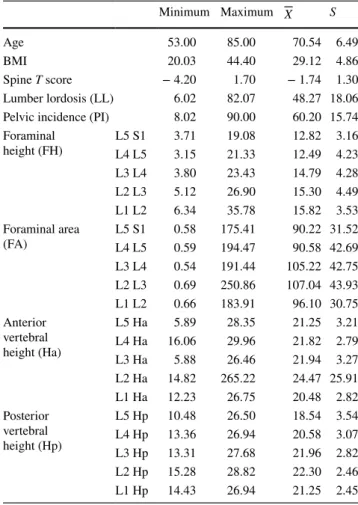
The mean age of the participants was 70.54 ± 6.49, %49.4 of the patients were under 70, and %50.6 were 70 and over. The mean BMI value was 29.12 ± 4.86, with %33.7 of the patients was within normal BMI values, %33.7 was over-weight and %32.6 was obese. Mean Spine T score of the patients was found to be − 1.74 ± 1.3, with %28.1 of the patients were osteoporotic, %46.1 were osteopenic and %25.8 had normal spine T scores. Mean lumber lordosis (LL) was 48.27 ± 18.06, and the mean pelvic incidence (PI) was 60.20 ± 15.74. The detailed measurement data of the other vertebra measurements are presented in Table 2. The foraminal measurements, foraminal height, and area did not differ in between patients who are over 70 years of age and lower. Similarly, the anterior and posterior vertebral height and the PI did not differ in between different age groups. LL angle in the younger patient group was significantly higher than older patients (Table 3). The anterior vertebral height measures did not differ for BMI values of the patients. How-ever, normal weighted patients had significantly higher L4 posterior vertebral height compared to overweighed group.
Also, obese patients had significantly higher L3 posterior vertebral height compared to overweighed group. The LL and PI angles did not differ for BMI values of the patients.
The anterior and posterior vertebral heights did not differ for the Spine T score values of the patients. Similarly, LL and PI angles did not differ for the Spine T scores. Patients with normal bone mineral density values had significantly higher foraminal height values in L4–5 level than osteopenic patients (13.97 vs 11.26, p = 0.03). Additionally, osteoporo-tic and normal bone mineral density bearing patients have higher foraminal area values of L5–S1 compared to osteo-penic patients (102.03 vs 78.51 vs 98.24; p = 0.004). Also, patients with normal bone mineral density has higher foram-inal area of L4–5 compared to osteopenic patients (112.16 vs 79.33, p = 0.011).
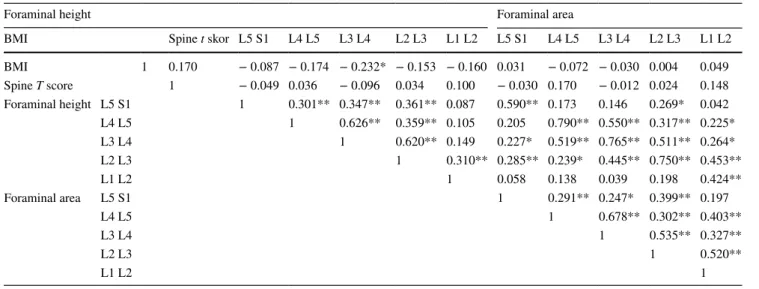
We have also performed correlation analysis in between the variables. The correlation between BMI, Spine T score and incidence height and area revealed a very weak nega-tive correlation in between BMI and L3–4 foraminal height (r = − 0.232; p < 0.05). There was no significant correlation in between spine T scores and other variables. The corre-lation analysis within the foraminal heights and foraminal height and area values revealed weak positive correlation in between (Table 4).
The correlation between BMI, spine T scores, and vertebral height measurements revealed a weak negative
correlation in between BMI and L4 Hp (r = − 0.215;
p < 0.05). There was no significant correlation in between
spine T scores and other variables. The correlation analy-sis within the anterior and posterior vertebral heights
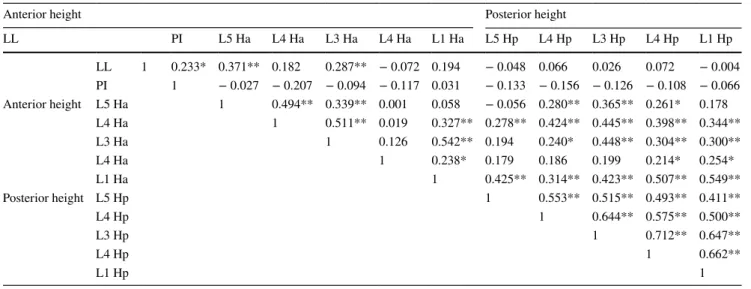
revealed a very weak positive correlation also (Table 4). The correlation analysis in between LL vs spine T score and PI vs spine T score revealed no statistical significance. There was no correlation in between LL and foraminal
measurements; however, we have detected a very weak negative correlation in between PI and foraminal height of L1–L2 vertebrae level (r = − 0.219; p < 0.05) (Table 5). The correlation analysis in between LL and PI revealed very weak positive correlation (r = 0.233; p < 0.05). We have also detected a weak positive correlation in between LL and L5 Ha (r = 0.371; p < 0.01), and again a weak positive correlation in between LL and L3 Ha (r = 0.287;
p < 0.01). PI revealed no correlation with anterior and pos-terior heights of the vertebral measures (Table 6).
Discussion
This study investigated the effect of age, BMI, and bone mineral density on the vertebral measures in female patients. In this cross-sectional study, we have achieved an almost even distribution of patients among different groups. The distribution of age was even, almost half of the patients were under 70 years of age, and the remaining were over 70. Simi-larly, the number of patients within the BMI groups and BMD groups was similar. In this study, MRI was used for vertebral measurements. Even though the X-ray examination and CT scanning are gold standard for evaluation of bone pathologies, they have some limitations. In addition to the radiation damage caused by these techniques, it is also dif-ficult to clarify disc structure and soft tissue, especially the orientation of the nerve tissue relative to the bone [26]. In clinical point of view, recent literature points out the impor-tance of evaluation of both bone and soft tissue in vertebral pathologies [17, 29] Therefore, MRI has become an impor-tant imaging tool for diagnosing spinal pathologies. More and more studies in the literature investigate the accuracy of MRI and have proven the reliability of MRI in vertebral measurements, identifying the details of its anatomy [10,
14, 20, 21, 24]
The degree of severity of the symptoms in spinal disease is correlated to the alterations in spinopelvic parameters [1,
6]. Spinal sagittal alignment is shown to be affected by many variables such as age, sex, weight, pelvic morphology, and bone mineral density [5]. The results revealed that younger patients have higher lordosis angle, and normal BMD patients have higher foraminal height and area measures than osteoporotic and osteopenic patients. Obesity seemed not to have any influence on vertebral measures.
Among different age groups, no difference was detected with the vertebral measurements and the spinopelvic angles, except for LL. In the younger age group, LL was found to be higher than the older age group. This finding is comparable with the recent literature [8]. It is stated that a decrease in LL itself triggers spinal sagittal imbalance in elderly, and the rest of the spinopelvic measurements have almost no effect. In this study, although there is a slight decrease in the anterior height of the vertebra in the elderly group, it revealed no statistical difference [10]. In
Table 2 Demographic characteristics of the participants are pre-sented as mean values with standard deviations
Minimum Maximum X S
Age 53.00 85.00 70.54 6.49
BMI 20.03 44.40 29.12 4.86
Spine T score − 4.20 1.70 − 1.74 1.30 Lumber lordosis (LL) 6.02 82.07 48.27 18.06 Pelvic incidence (PI) 8.02 90.00 60.20 15.74 Foraminal height (FH) L5 S1L4 L5 3.713.15 19.0821.33 12.82 3.1612.49 4.23 L3 L4 3.80 23.43 14.79 4.28 L2 L3 5.12 26.90 15.30 4.49 L1 L2 6.34 35.78 15.82 3.53 Foraminal area (FA) L5 S1L4 L5 0.580.59 175.41194.47 90.22 31.5290.58 42.69 L3 L4 0.54 191.44 105.22 42.75 L2 L3 0.69 250.86 107.04 43.93 L1 L2 0.66 183.91 96.10 30.75 Anterior vertebral height (Ha) L5 Ha 5.89 28.35 21.25 3.21 L4 Ha 16.06 29.96 21.82 2.79 L3 Ha 5.88 26.46 21.94 3.27 L2 Ha 14.82 265.22 24.47 25.91 L1 Ha 12.23 26.75 20.48 2.82 Posterior vertebral height (Hp) L5 Hp 10.48 26.50 18.54 3.54 L4 Hp 13.36 26.94 20.58 3.07 L3 Hp 13.31 27.68 21.96 2.82 L2 Hp 15.28 28.82 22.30 2.46 L1 Hp 14.43 26.94 21.25 2.45
Table 3 The comparison of LL and PI angles for different age groups *p < 0.05 Age n X S t p Lumber lordosis 70 < 44 52.93 17.06 2.477 0.015* 70 ≥ 45 43.71 18.03 Pelvic incidence 70 < 44 58.53 16.19 0.656 0.327 70 ≥ 45 61.83 15.29
the literature, especially anterior height of the vertebra was found to be lower in elderly to younger age group [28]. However, the foraminal measures seems to be divergent within the age groups.
The distribution of different vertebral and spinopelvic angle measures within the different BMI groups revealed no difference in between groups, except for the posterior height of the L4 and L5 vertebrae. In the literature, there are studies confirming the effect of BMI on the vertebral and spinopelvic measures [19, 28]. It is stated that in obese patients with higher BMI values, spinal inclination angle increases with an increase in lumbar and thoracic kyphosis angles [13]. Similarly, in another study, it is stated that the risk of spondylolisthesis increases in obese patients with increase in PI measures [4].
The spinopelvic measures and vertebral height measures in our study did not differ among different BMD values. In this study, it was detected higher foraminal height and foraminal area values in normal Spine t value patients com-pared to osteopenic and osteoporotic patients in L4–5 and L5–S1 levels. This finding supports the hypothesis that nor-mal BMD bearing patients have higher foraminal measures in the transitional spine segment end up with less possible nerve root decompression and adult spinal deformity, there-fore, with less low back pain2. Within our knowledge, there is no specific study documenting the foraminal measure changes among patients with different BMD values.
However, in aspect of spinopelvic angles, there are different studies documenting different results [7]. It is presented that there is significant difference in terms of
Table 4 The correlation analysis in between foraminal measurements, BMI, and spine T scores
*p < 0.05, **p < 0.01
Foraminal height Foraminal area
BMI Spine t skor L5 S1 L4 L5 L3 L4 L2 L3 L1 L2 L5 S1 L4 L5 L3 L4 L2 L3 L1 L2 BMI 1 0.170 − 0.087 − 0.174 − 0.232* − 0.153 − 0.160 0.031 − 0.072 − 0.030 0.004 0.049 Spine T score 1 − 0.049 0.036 − 0.096 0.034 0.100 − 0.030 0.170 − 0.012 0.024 0.148 Foraminal height L5 S1 1 0.301** 0.347** 0.361** 0.087 0.590** 0.173 0.146 0.269* 0.042 L4 L5 1 0.626** 0.359** 0.105 0.205 0.790** 0.550** 0.317** 0.225* L3 L4 1 0.620** 0.149 0.227* 0.519** 0.765** 0.511** 0.264* L2 L3 1 0.310** 0.285** 0.239* 0.445** 0.750** 0.453** L1 L2 1 0.058 0.138 0.039 0.198 0.424** Foraminal area L5 S1 1 0.291** 0.247* 0.399** 0.197 L4 L5 1 0.678** 0.302** 0.403** L3 L4 1 0.535** 0.327** L2 L3 1 0.520** L1 L2 1
Table 5 The correlation analysis in between vertebral height measurements and LL, PI angle measurements
*p < 0.05, **p < 0.01
Anterior height Posterior height
LL PI L5 Ha L4 Ha L3 Ha L4 Ha L1 Ha L5 Hp L4 Hp L3 Hp L4 Hp L1 Hp LL 1 0.233* 0.371** 0.182 0.287** − 0.072 0.194 − 0.048 0.066 0.026 0.072 − 0.004 PI 1 − 0.027 − 0.207 − 0.094 − 0.117 0.031 − 0.133 − 0.156 − 0.126 − 0.108 − 0.066 Anterior height L5 Ha 1 0.494** 0.339** 0.001 0.058 − 0.056 0.280** 0.365** 0.261* 0.178 L4 Ha 1 0.511** 0.019 0.327** 0.278** 0.424** 0.445** 0.398** 0.344** L3 Ha 1 0.126 0.542** 0.194 0.240* 0.448** 0.304** 0.300** L4 Ha 1 0.238* 0.179 0.186 0.199 0.214* 0.254* L1 Ha 1 0.425** 0.314** 0.423** 0.507** 0.549** Posterior height L5 Hp 1 0.553** 0.515** 0.493** 0.411** L4 Hp 1 0.644** 0.575** 0.500** L3 Hp 1 0.712** 0.647** L4 Hp 1 0.662** L1 Hp 1
spinopelvic angles in osteoporotic patients and femur neck BMD and high PI were found to be the significant param-eters in determination of sagittal balance in osteoporotic patients [7]. On the other hand, another study documented no difference in spinopelvic angle measures among differ-ent BMD value patidiffer-ents [7].
The correlation analysis in between variables did not reveal significant powerful correlation. However, there were some interesting weak correlations in between, such as a very weak negative correlation in between BMI and L3–4 foraminal height. In this study, the authors found out that as BMI increases, the foraminal height in L3–4 decreases; however, the rest of the segments do not dif-fer statistically. Similarly, there is weak negative correla-tion in between BMI and L4 Hp (r = − 0.215; p < 0.05) and a weak positive correlation in between LL and L3 Ha (r = 0.287; p < 0.01). These results reveal no significant clinical outcome; however, they point out that L3–L4 ver-tebra level is the most effected verver-tebra level with other variables. The authors found out that bone mineral density changes do not affect other variables, such as vertebral measures or spinopelvic angles, so there is no correlation in between. This result is similar to the literature, present-ing no correlation in between age and bone mineral density with spinopelvic parameters [7]. However, Lee et al. pre-sented that although there was no significant difference in between osteoporosis and control group in terms of PI [5], there seems to be strong correlation between osteoporosis and spinopelvic angles and also the outcome of the patient [7]. The authors also detected no significant difference in terms of PI among groups; however, our correlation analy-sis revealed no clinically important result. The reason for that could be due to distribution of the patients and the low number of cases included in our cross-sectional study.
There were some limitations to this study. The num-ber of patients was limited. For these patients included in the study, only MRI examination was indicated when they had their appointment. None of the patients have had CT examinations. CT scanning is good for the evaluation of some parameters of bone and can be good for previous studies. Recent literature investigates the accuracy of MRI using MRI measurements, and has proven the reliability of MRI in vertebral measurements identifying the details of its anatomy; therefore, all subject measurements were done on MRI. In addition, since the results were focused on a specific geographic region, regional and racial differences may have impacted the outcome.
Conclusions
In this cross-sectional study, the results revealed that younger patients have higher lordosis angle, and normal BMD patients have higher foraminal height and area meas-ures than osteoporotic and osteopenic patients. Obesity seemed not to have any influence on vertebral measures. Spinopelvic parameters seem not to be effected by BMD and BMI.
Acknowledgements This work was not supported by grant funding.
Compliance with ethical standards
Conflict of interest None of the authors have any conflict of interest
with the content of this manuscript.
Table 6 The correlation analysis in between vertebral measurements vs LL and PI
*p < 0.05, **p < 0.01
Anterior height Posterior height
LL PI L5 Ha L4 Ha L3 Ha L4 Ha L1 Ha L5 Hp L4 Hp L3 Hp L4 Hp L1 Hp LL 1 0.233* 0.371** 0.182 0.287** − 0.072 0.194 − 0.048 0.066 0.026 0.072 − 0.004 PI 1 − 0.027 − 0.207 − 0.094 − 0.117 0.031 − 0.133 − 0.156 − 0.126 − 0.108 − 0.066 Anterior height L5 Ha 1 0.494** 0.339** 0.001 0.058 − 0.056 0.280** 0.365** 0.261* 0.178 L4 Ha 1 0.511** 0.019 0.327** 0.278** 0.424** 0.445** 0.398** 0.344** L3 Ha 1 0.126 0.542** 0.194 0.240* 0.448** 0.304** 0.300** L4 Ha 1 0.238* 0.179 0.186 0.199 0.214* 0.254* L1 Ha 1 0.425** 0.314** 0.423** 0.507** 0.549** Posterior height L5 Hp 1 0.553** 0.515** 0.493** 0.411** L4 Hp 1 0.644** 0.575** 0.500** L3 Hp 1 0.712** 0.647** L4 Hp 1 0.662** L1 Hp 1
References
1. Chapman TM Jr, Baldus CR, Lurie JD, Glassman SD, Schwab FJ, Shaffrey CI et al (2016) Baseline patient-reported outcomes correlate weakly with radiographic parameters: a multicenter prospective nih adult symptomatic lumbar scoliosis study of 286 patients. Spine (Phila Pa 1976) 41(22):1701–1708
2. Cho W, Sokolowski MJ, Mehbod AA, Denis F, Garvey TA, Perl J et al (2013) MRI measurement of neuroforaminal dimension at the index and supradjacent levels after anterior lumbar interbody fusion: a prospective study. Clin Orthop Surg 5:49–54
3. Cho Y, Lee G, Aguinaldo J, Lee KJ, Kim K (2015) Correlates of bone mineral density and sagittal spinal balance in the aged. Ann Rehabil Med 39:100–107
4. Cutler WB, Friedmann E, Genovese-Stone E (1993) Prevalence of kyphosis in a healthy sample of pre- and postmenopausal women. Am J Phys Med Rehabil 72:219–225
5. de Vries AA, Mullender MG, Pluymakers WJ, Castelein RM, van Royen BJ (2010) Spinal decompensation in degenerative lumbar scoliosis. Eur Spine J 19:1540–1544
6. Faraj SSA, De Kleuver M, Vila-Casademunt A, Holewijn RM, Obeid I, Acaroglu E et al (2018) Sagittal radiographic parameters demonstrate weak correlations with pretreatment patient-reported health-related quality of life measures in symptomatic de novo degenerative lumbar scoliosis: a European multicenter analysis. J Neurosurg Spine 28:573–580
7. Fyllos AH, Arvanitis DL, Karantanas AH, Varitimidis SE, Han-tes M, Zibis AH (2018) Magnetic resonance morphometry of the adult normal lumbar intervertebral space. Surg Radiol Anat 40:1055–1061
8. Guler UO, Yuksel S, Yakici S, Domingo-Sabat M, Pellise F, Perez-Grueso FJ et al (2016) Analysis of the reliability of sur-geon’s ability to differentiate between idiopathic and degenera-tive spinal deformity in adults radiologically. What descripdegenera-tive parameters help them decide? Eur Spine J 25:2401–2407 9. Ha KY, Jang WH, Kim YH, Park DC (2016) Clinical Relevance
of the SRS-Schwab Classification for Degenerative Lumbar Sco-liosis. Spine (Phila Pa 1976) 41:E282–288
10. Hegazy AA, Hegazy RA (2014) Midsagittal anatomy of lumbar lordosis in adult egyptians: MRI study. Anat Res Int 2014:370852 11. Hirano K, Imagama S, Hasegawa Y, Muramoto A, Ishiguro N
(2013) Impact of spinal imbalance and BMI on lumbar spinal canal stenosis determined by a diagnostic support tool: cohort study in communityliving people. Arch Orthop Trauma Surg 133:1477–1482
12. Horn SR, Segreto FA, Ramchandran S, Poorman GR, Sure A, Marascalachi B et al (2018) The influence of body mass index on achieving age-adjusted alignment goals in adult spinal deformity corrective surgery with full-body analysis at 1 year. World Neu-rosurg 120:e533–e545
13. Jalai CM, Diebo BG, Cruz DL, Poorman GW, Vira S, Buckland AJ et al (2017) The impact of obesity on compensatory mecha-nisms in response to progressive sagittal malalignment. Spine J 17:681–688
14. Jindal G, Pukenas B (2011) Normal spinal anatomy on magnetic resonance imaging. Magn Reson Imaging Clin N Am 19:475–488 15. Kadioglu HH, Takci E, Levent A, Arik M, Aydin IH (2003) Meas-urements of the lumbar pedicles in the Eastern Anatolian popula-tion. Surg Radiol Anat 25:120–126
16. Kanis JA, Melton LJ III, Christiansen C, Johnston CC, Khal-taev N (1994) The diagnosis of osteoporosis. J Bone Miner Res 9:1137–1141
17. Kwok AW, Wang Y-XJ, Griffith JF, Deng M, Leung JC, Ahuja AT et al (2012) Morphological changes of lumbar vertebral bodies and intervertebral discs associated with decrease in bone mineral density of the spine: a cross-sectional study in elderly subjects. Spine 37:E1415–E1421
18. Le Huec JC, Charosky S, Barrey C, Rigal J, Aunoble S (2011) Sagittal imbalance cascade for simple degenerative spine and con-sequences: algorithm of decision for appropriate treatment. Eur Spine J 20(Suppl 5):699–703
19. Lee JS, Lee HS, Shin JK, Goh TS, Son SM (2013) Prediction of sagittal balance in patients with osteoporosis using spinopelvic parameters. Eur Spine J 22:1053–1058
20. Masharawi Y, Kjaer P, Bendix T, Manniche C, Wedderkopp N, Sorensen JS et al (2008) The reproducibility of quantitative meas-urements in lumbar magnetic resonance imaging of children from the general population. Spine (Phila Pa 1976) 33:2094–2100 21. Matsumoto M, Okada E, Kaneko Y, Ichihara D, Watanabe K,
Chiba K et al (2011) Wedging of vertebral bodies at the thora-columbar junction in asymptomatic healthy subjects on magnetic resonance imaging. Surg Radiol Anat 33:223–228
22. Mika A, Unnithan VB, Mika P (2005) Differences in thoracic kyphosis and in back muscle strength in women with bone loss due to osteoporosis. Spine (Phila Pa 1976) 30:241–246
23. Ren Z, Liu A, Yang K, Wang D, Buser Z, Wang JC (2017) Evaluation of changes in lumbar neuroforaminal dimensions in symptomatic young adults using positional MRI. Eur Spine J 26:1999–2006
24. Roberts N, Gratin C, Whitehouse GH (1997) MRI analysis of lumbar intervertebral disc height in young and older populations. J Magn Reson Imaging 7:880–886
25. Takeda N, Kobayashi T, Atsuta Y, Matsuno T, Shirado O, Minami A (2009) Changes in the sagittal spinal alignment of the elderly without vertebral fractures: a minimum 10-year longitudinal study. J Orthop Sci 14:748–753
26. Tarantino U, Fanucci E, Iundusi R, Celi M, Altobelli S, Gasbarra E et al (2013) Lumbar spine MRI in upright position for diag-nosing acute and chronic low back pain: statistical analysis of morphological changes. J Orthop Traumatol 14:15–22
27. Uysal E, Paksoy Y, Koplay M, Nayman A, Gumus S (2015) Effects of body mass index, mesenteric and abdominal subcuta-neous adipose tissue on the spinopelvic parameters. Wien Klin Wochenschr 127:935–941
28. Weinstein SL, Ponseti IV (1983) Curve progression in idiopathic scoliosis. J Bone Joint Surg Am 65:447–455
29. Yamato M, Nishimura G, Kuramochi E, Saiki N, Fujioka M (1998) MR appearance at different ages of osteoporotic compres-sion fractures of the vertebrae. Radiat Med 16:329–334
Publisher’s Note Springer Nature remains neutral with regard to jurisdictional claims in published maps and institutional affiliations.