Türkiye’de On Beş Yaş Grubu Öğrencilerin Matematik
Okuryazarlık Becerileri İle İlişkili Duyuşsal Özellikleri
*Ergül DEMİR
**ÖZ. Bu çalışmanın amacı; PISA 2012 Türkiye sonuçlarına göre
15 yaş grubu öğrencilerin matematik okuryazarlık becerileri ile ilişkili duyuşsal özelliklerini incelemektir. Bu çalışma temel araştırma olarak yürütülmüştür ve korelasyonel araştırma olarak desenlenmiştir. PISA 2012 Türkiye öğrenci anketi verileri üzerinde, yapısal eşitlik modellemesi ile ikincil düzey analizler yürütülmüştür. PISA 2012 Türkiye örneklemi, 170 okul ve toplam 4 848 öğrenciden oluşmaktadır. Kayıp verilerle başa çıkabilmek için bu çalışmada Öğrenci Anketinin B formunun kullanılması tercih edilmiştir. Bu form, 1 598 öğrenci tarafından yanıtlanmıştır. Belirlenen amaç kapsamında ikincil düzey bir yapısal model kurulmuştur. Bu model,12 gözlenen değişken, 4 birincil düzey gizil değişken ve 1 ikincildüzey gizil değişken içermektedir. Modele göre, birincil düzey gizil değişkenler arasında matematik okuryazarlığı becerilerinin en iyi yordayıcısı ‘problem çözmeye yönelik davranışlar’dır. Gözlenen değişkenler içerisinde ise en iyi yordayıcılar; ‘problem çözme azmi’, ‘matematik kaygısı’ ve ‘problem çözmeye açıklık’ olarak belirlenmiştir.
Anahtar sözcükler: PISA 2012, duyuşsal özellikler, matematik okuryazarlığı, yapısal eşitlik modellemesi
* Bu araştırma, 15-19 Nisan 2015 tarihleri arasında Chicago’da gerçekleşen “77th Annual Meeting of
National Council on Measurement in Education (NCME)” da sözlü bildiri olarak sunulmuştur.
**Yrd.Doç.Dr., Ankara Üniversitesi Eğitim Bilimleri Fakültesi Ölçme ve Değerlendirme Bölümü, Türkiye,
Ergül DEMİR
166
ÖZET
Amaç ve Önem: Uluslararası Öğrenci Değerlendirme Programı (PISA),
Ekonomik İşbirliği ve Kalkınma Örgütü (OECD) tarafından, OECD’ye üye olan ve olmayan ülkelerdeki 15 yaş grubu öğrencilerin okuma becerileri, matematik okuryazarlık becerileri ve fen okuryazarlık becerileri performanslarına yönelik olarak yürütülen Dünya çapında bir çalışmadır. İlk defa 2000 yılında düzenlenmiştir ve sonrasında her üç yılda bir tekrar etmektedir. Her bir çalışmada, sözü geçen bu üç alandan biri, esas alan olarak belirlenmektedir.
PISA 2012, PISA’nın beşinci araştırmasıdır. PISA 2012’de 65 ülkeden 15 yaş civarı yaklaşık 510 000 öğrenci test edilmiştir. Bu ülkelerden ve ekonomilerden 34’ü OECD üyesidir. PISA 2012, özel olarak matematik okuryazarlığı odaklıdır.
Türkiye, 2003 yılından beri düzenli olarak PISA’ya katılmaktadır. PISA 2012 sonuçlarına göre Türkiye’deki 15 yaş grubu öğrenciler, matematik okuryazarlığı açısından ülkeler ortalamasına yakın bir performans göstermiştir. Bununla birlikte Türkiye’nin ortalaması, OECD üyesi ülkeler ortalamasının ve tüm katılımcı ülkeler ortalamasının altında kalmıştır.
PISA çalışmalarında, öğrenci performansı ile ilişkili olan ve bu performansın geri planını oluşturan öğrenci özellikleri hakkında veri toplamak için farklı ölçme araçları kullanılmaktadır. Öğrenci Anketi, bu araçlardan biridir. PISA Öğrenci Anketi, psikometrik açıdan iyi yapılandırılmış bir araçtır. Bu araç, öğrencilerin matematik okuryazarlıkları ile ilişkili olan ve matematik okuryazarlığını yordayan duyuşsal özellikleri hakkında önemli bilgiler sağlamaktadır.
Bu kapsamda bu çalışmanın amacı; PISA 2012 sonuçlarına göre Türkiye’de öğrencilerin matematik okuryazarlığı becerileri ile ilişkili olan ve bu beceriyi yordayan duyuşsal özelliklerini incelemektir. Belirlenen amaç doğrultusunda, öğrencilerin duyuşsal özellikleri ile matematik okuryazarlığı becerileri arasındaki ilişkileri açıklayan manidar bir model kurulmuş, bu model sınırlılığında matematik okuryazarlığı becerileri ile ilişkili duyuşsal özellikler ve bu özelliklerin yordayıcılıkları değerlendirilmiştir.
Yöntem: Bu çalışma temel araştırma türünde yürütülmüştür ve
korelasyonel araştırma olarak desenlenmiştir. PISA 2012 Türkiye öğrenci anketi verileri üzerinde, yapısal eşitlik modellemesi (YEM) ile ikincil düzey analizler yapılmıştır.
PISA 2012 Türkiye evreni, 15 yaş grubunda olup erişilebilen toplam 955 349 öğrenciden oluşmaktadır. PISA 2012 Türkiye örneklemi ise İBBS Düzey
1 sınıflamasına göre belirlenen 170 okul ve bu okullarda öğrenim gören toplam 4 848 öğrenciden oluşmaktadır.
PISA 2012 öğrenci anketi, üç farklı form şeklinde tasarlanmıştır (A Formu, B Formu ve C Formu). Her bir formda ortak maddeler yer almaktadır. Bu ortak maddeler tüm katılımcılarca yanıtlanmaktadır. Diğer taraftan sadece iki formda yer alan maddeler bulunmaktadır. Bu maddeler ise tüm katılımcıların yaklaşık %67’si tarafından yanıtlanmaktadır. Ortak maddeler dışında kalan bu maddeler düzeyinde en azından %33’lik bir kayıp veri miktarı söz konusudur. Kayıp veri sorunu ile başa çıkmak için bu çalışmada öğrenci anketinin B formunun kullanılması tercih edilmiştir. B formu, öğrenci duyuşsal özellikleri hakkında en fazla bilgi sağlayan formdur. PISA 2012 Türkiye Öğrenci Anketi (B Formu), toplam 1 598 öğrenci tarafından yanıtlanmıştır.
Çalışmanın amacı doğrultusunda, PISA öğrenci anketi verileri arasında yer alan indeks ve standartlaştırılmış toplam puanlar ile tanımlanmış değişkenler kullanılarak, ikincil düzey bir yapısal model kurulmuştur. Bu modelde öğrencilerin matematik okuryazarlık becerileri ikincil düzey gizil değişken olarak tanımlanmıştır. Öğrenci duyuşsal özellikleri ise birincil düzey gizil değişkenler olarak tanımlanmıştır. Birincil düzey gizil değişkenlerle ilişkilendirilecek gözlenen değişkenlerin belirlenmesinde, öğrenci anketinde yer alan toplam 48 indeks ve standart toplam puan ile tanımlı 48 değişken incelenmiştir. Bu değişkenler içerisinde 15’inin öğrencilerin duyuşsal özelliklerini belirlediği görülmüştür.
İleri analizler öncesinde, belirlenen değişkenler üzerinde yapısal eşitlik modellerinin temel varsayımları kontrol edilmiştir. İlgili literatür bağlamında kayıp veriler, aykırı değerler, otokorelasyon, normallik ve çoklu normallik, doğrusallık ve çoklu bağlantılılık varsayımları test edilmiştir. Ardından açımlayıcı çalışma olarak temel bileşenler analizi ve doğrulayıcı faktör analizi yapılmıştır. Başlangıç modelini tanımlamaya yönelik bu çalışmalar sonrasında, 12 değişken ve 4 faktörden oluşan, yaklaşık %70 açıklanan varyans sağlayan birincil düzey bir model kurulabilmiştir. Faktörler ‘matematiğe yönelik duygular’, ‘okula yönelik duygular’, ‘matematik endişesi’ ve ‘problem çözme davranışı’ olarak isimlendirilmiştir. Bu modele ikincil düzey gizil değişken olarak matematik okuryazarlığı becerileri de eklenerek, ikincil düzey bir yapısal model oluşturulmuştur. Modifikasyonlara
Ergül DEMİR
168
bağlı iyileştirme çalışmalarından sonra yüksek model-veri uyumu sağlayan manidar bir ikincil düzey yapısal model elde edilmiştir.
Bulgular: Kurulan manidar model sınırlılığında, birincil düzey gizil
değişkenler arasında matematik okuryazarlığı becerilerini en iyi yordayan değişkenin ‘problem çözme davranışı’ olduğu görülmüştür. Problem çözme davranışındaki 1 birim değişim, matematik okuryazarlığı becerilerinde 0.32 birim değişime karşılık gelmektedir. Diğer üç gizil değişken olan ‘matematiğe yönelik duygular’, ‘okula yönelik duygular’ ve ‘matematik endişesi’, öğrencilerin matematik okuryazarlık becerileri ile negatif yönlü bir ilişki göstermektedir.
Matematik endişesi ile matematik okuryazarlığı becerileri arasında negatif yönlü ilişki bulunması, ilgili literatürün de desteklediği bir durumdur. Buna göre matematik endişesi yüksek olan öğrenciler, matematik okuryazarlığı becerileri düşük olan bireylerdir ya da tam tersi söylenebilir. ‘matematiğe yönelik duygular’ ve ‘okula yönelik duygular’ ile matematik okuryazarlığı becerileri arasında negatif yönlü bir ilişki olması ise alışıldık ya da beklenen bir durum değildir. Buna göre kendisini matematiğe ve okula yönelik duyguları açısından üst düzeyde gören ya da bu şekilde rapor eden öğrenciler, aynı zamanda matematik okuryazarlık becerileri düşük olan öğrencilerdir. Tersi de geçerlidir. Bu durumun, Türkiye’de öğrencilerin kendilerini nasıl değerlendirdikleri ile ilişkili olması olasıdır. Diğer taraftan bu durum, matematik eğitiminin ve okulların öğrencilerin gelişimi üzerindeki olumsuz etkilerin de bir göstergesi olabilir. Bu konularda daha derinlemesine araştırmalara ihtiyaç olduğu açıktır.
Kurulan modelde yer alan 12 gözlenen değişken arasında matematik okuryazarlığı becerilerinin en iyi yordayıcısı ‘problem çözme azmi’ olarak belirlenmiştir. Bu değişkendeki 1 birim değişim, problem çözme davranışında 0.67 birim, matematik okuryazarlığı becerilerinde ise 0.21 birim değişime karşılık gelmektedir. Bunu ‘matematik kaygısı’ ve ‘problem çözmeye açıklık’ izlemektedir. Yordayıcılığı en az olan değişkenler ise ‘matematiksel davranış’, ‘araçsal motivasyon’, ‘okula yönelik tutum: öğrenme etkinlikleri’ ve ‘matematik ilgisi’ gelmektedir. Bu değişkenlerin tamamı negatif yordayıcıdır.
Tartışma ve Sonuçlar: Bu çalışmanın bulguları, 15 yaş grubu
öğrencilerin duyuşsal özellikleri ile matematik okuryazarlığı becerileri arasında manidar ilişkiler olduğunu ve bu ilişkilerin çok değişkenli yapıda modellenebildiğini göstermektedir. Türkiye sınırlılığında bu ilişkiler, zayıf
düzeyde olmakla birlikte manidardır. Bu ilişkiler bağlamında ilgili literatürle örtüşmeyen bulgular, Türkiye’de öğrencilerin kendilerini gerçek durumlarından farklı bir şekilde rapor etmiş olabilecekleri ya da Türkiye’de matematik eğitiminin ve okulların öğrenciler üzerindeki negatif etkilerini gösterme olasılıklarını ortaya çıkarmaktadır. Eğitim ve öğretim süreçlerinde bu tür ilişkilerin doğasının anlaşılması ve dikkate alınmasının, öğrencilerin performanslarının yükseltilmesinde yol gösterici nitelikte olacağı değerlendirilmektedir.
İleri araştırmalara yönelik olarak, matematik okuryazarlığı dışındaki diğer becerilerin modellenmesi, farklı değişkenlerle benzer modellerin çalışılması önerilmektedir. Ayrıca, bu çalışmada kurulan model üzerinde ya da benzer modeller üzerinde kültürler arası karşılaştırmalara dayalı araştırmaların yapılması da önerilmektedir.
Ergül DEMİR
170
Affective Characteristics Predicting 15-Year-Old
Students' Mathematics Literacy Skills in Turkey
*
Ergül DEMİR**
ABSTRACT: The aim of this study is to examine the affective
characteristics of the 15-year-old students in Turkey, significantly predicting their mathematics literacy skills and competencies, according to the PISA 2012 results. This study has been executed as a basic research and has been designed as a correlational research. Secondary level analyses have been performed on PISA 2012 Turkey student questionnaire data by using structural equation modelling. PISA 2012 Turkey sample is composed of 170 schools and 4 848 students. In order to handle with missing data problem, in this study, Student Questionnaire Form B data were preferred to use. This form was answered by 1 598 students. Within the aim of this study, a secondary-level structural model has been constructed. This model is including 12 observed variables and 4 primary-level latent variables and 1 secondary-level latent variable. According to this model, among primary level latent variables, best predictor of students’ mathematics literacy skills is ‘behaviour of problem solving’. Among indicators, best predictors are ‘perseverance’, ‘mathematics anxiety’ and ‘openness for problem solving’ as well.
Keywords: PISA 2012, affective characteristics, mathematics
literacy, structural equation modelling
* This research was presented as an oral presentation on April 15-19, 2015 at 77th Annual Meeting of
National Council on Measurement in Education (NCME), Chicago.
** Assist.Prof.(PhD), Ankara University Educational Sciences Faculty Measurement and Evaluation
Department, Turkey, [email protected]
INTRODUCTION
Concept of ‘mathematics literacy’ has become common term. There is an intense historical background. In this context, the terms ‘mathematics literacy’, ‘quantitative literacy’, ‘numeracy’, ‘quantitative reasoning’ or sometimes just ‘mathematics’ have the close meaning with each other. Quantitative literacy is defined as “the capacity to deal effectively with the quantitative aspects of life” (Steen, 2001). In the framework of Programme for International Student Assessment (PISA), there is a same definition but called ‘mathematics literacy’ (OECD, 2000):
An individual’s capacity to identify and understand the role that mathematics plays in the world, to make well-founded mathematical judgements and to engage in mathematics in ways that meet the needs of that individual’s current and future life as a constructive, concerned and reflective citizen.
These definitions emphasize that mathematics literacy focus on both some basic skills and some higher-order thinking skills to understand the role of numerical, mathematical or quantitative relations in life. On the other hand, it is obvious that “mathematical literacy is not restricted to the ability to apply quantitative aspects of mathematics but involves knowledge of mathematics in the broadest sense” (De Lange, 2001). In this respect, mathematics literacy can be considered as higher level of skills or ability (Haladyna, 1997). Mathematics literacy involves some competencies or sub-skills (OECD, 1999):
• Mathematics Thinking and Reasoning: Posing questions characteristic of mathematics; knowing the kind of answers that mathematics offers; distinguishing among different kinds of statements; understanding and handling the extent and limits of mathematical concepts.
• Mathematical Argumentation: Knowing what proofs are; knowing how proofs differ from other forms of mathematical reasoning; following and assessing chains of arguments; having a feel for heuristics; creating and expressing mathematical arguments. • Mathematical Communication: Expressing oneself in a variety of
ways in oral, written, and other visual form; understanding someone else’s work.
• Modeling: Structuring the field to be modeled; translating reality into mathematical structures; interpreting mathematical models in terms of context or reality; working with models; validating models; reflecting, analyzing, and offering critiques of models or solutions; reflecting on the modeling process.
Ergül DEMİR
172
• Problem Posing and Solving: Posing, formulating, defining, and solving problems in a variety of ways.
• Representation: Decoding, encoding, translating, distinguishing between, and interpreting different forms of representations of mathematical objects and situations as well as understanding the relationship among different representations.
• Symbols: Using symbolic, formal, and technical language and operations.
• Tools and Technology: Using aids and tools, including technology when appropriate.
Improving the students’ mathematics skills is one of the primary goals of the mathematics education in schools. However, school learnings on mathematics are generally focused on essential or basic level skills, especially in the elementary and middle grades (Dossey, 1997). Whereas, problems in the real world is grounded and mathematical approaches need to be related with this context (Martin, 2007). Therefore, mathematics literacy has become fundamental. If students are expected to handle with such kind of complex problems and situations in the world, mathematics education provided in schools need to be organized according to the mathematics literacy skills (McCrone and Dossey, 2007).
Mathematics literacy is defined by relating some sub-skills like mathematical communication, reasoning, problem solving and etc. At the same time, it is well-known that there are significant correlations between mathematics skills and affective characteristics of students like self-efficacy, self-concept, mathematical behaviour, mathematics anxiety and etc. (Anıl, 2008; Ayotola&Adedeji, 2009; Cooper&Robinson, 1991; IEA, 1996, 2011; Kaiser&Willender, 2005; OECD, 2014a, 2014b, 2014c; Özgen&Bindak, 2011; Randhawa, Beamer&Lundberg, 1993; Thomas&Higbee, 1999; Yıldırım, 2011). These researches show that affective characteristics of students are possible to be significant predictors of mathematics achievement and mathematics literacy skills.
On the other hand, it is seen that just few characteristics or variables are be able to consider in such kind of models to explain the relations between the specific student characteristics and mathematics literacy. But, it is obvious that there is a need for more detailed researches to understand the nature of mathematics literacy. It is possible that this limitation is due to data collection and observation difficulties. At this point, The Programme for International Student Assessment (PISA) provides solutions and advantages with their large-scale assessment framework.
PISA is a worldwide study by the Organisation for Economic Co-operation and Development (OECD) in member and non-member nations of
15-year-old students' performance on reading skills and mathematics literacy and science literacy. It was first performed in 2000 and then repeated every three years. In each study, one of these three areas is determined main domain. PISA 2012 was the fifth survey of the PISA. In PISA 2012, nearly 510 000 students around age 15 in 65 countries and economies were tested. 34 of these countries and economies was the member of OECD. PISA 2012 had a special focus on mathematics literacy (OECD, 2014d).
In PISA studies, different measurement tools are used to collect data about student characteristics related with the performance and forming the background of performance. Student questionnaire is one of these tools. Student questionnaire is a well-structured tool in terms of psychometrics. It provides important information about students' affective characteristics which are possible to correlate with mathematics literacy and predicting mathematics literacy. PISA questionnaire data includes a lot of affective variables (OECD, 2014d).
Since 2003, Turkey regularly participates in PISA. According to the PISA 2012 results, 15-year-old students in Turkey showed a success close to the average in mathematics literacy. However, they performed below both OECD countries and participating countries. Most of the students are located on the first and second proficiency levels in mathematical literacy (OECD, 2014a). Defining the relations between students’ affective characteristics and their mathematical literacy skills provides to understand the nature of this situation in Turkey.
In this context, the aim of this study is to examine the affective characteristics of the 15-year-old students in Turkey, significantly predicting their mathematics literacy skills and competencies, according to the PISA 2012 results.
METHOD
In this section, research model, participants, data collection tool and data analyses technics are explained respectively.
Research Model
This study has been executed as a basic research and has been designed as a correlational research. Secondary level analyses have been performed on PISA 2012 Turkey student questionnaire data by using multilevel structural equation modelling (SEM).
Ergül DEMİR
174
Basic researches are studies aimed at producing pure conceptual knowledge. Correlational design is the most common nonexperimental research design especially in education (Karasar, 2012). In this method, two or more variables are tried to determine whether there is relations between them (Slavin, 1992).
Participants
PISA 2012 Turkey population is composed of 955 349 fifteen year-old student. PISA 2012 Turkey sample were determined based on NUTS Level-1. Sample were composed of 170 schools and 4 848 students.
In this study, analyses have been conducted on PISA 2012 Turkey Student Questionnaire (Form B) data. This Form was answered by 1 598 students in Turkey.
Data Collection Tool
PISA 2012 student questionnaire was designed as three different forms (form A, form B and form C). In each form, there were some common items. These items were answered all respondents. Also there were some other items took place only two forms. These items were answered by nearly 67% of all respondents. At least there were 33% amounts of missing data in these items, except common items. Therefore, in order to handle with missing data problem, in this study, Student Questionnaire Form B data were preferred to use. Form B was a form that provided the most information for students' affective characteristics.
Data Analyses
Within the aim of this study, a secondary-level structural model has been developed by using PISA indexes and standard scores and variables identified from student questionnaire data. On this model, students' mathematics literacy performances were determined as secondary-level latent variables. Students' affective characteristics were determined as primary-level variables. In order to determine the observed variables to be related with primary-level latent variables, a total of 48 indexes and standard scores and variables have been examined. During the analyses, it was utilized from IBM SPSS Statistics 20 and LISREL 8.7 softwares.
FINDINGS
In this section is including the steps in the establishing the model showing the relationship between students’ affective characteristics and mathematics literacy skills. And then, according to the relations between affective
characteristics and mathematical skills in the model, predictive level of variables and best predictors of skill are explained with detailed.
Selecting Variables for Initial Model
PISA 2012 Student Questionnaire (Form B) includes lots of variables defined as index scores or standardized total points. Fifteen of them are related with students’ affective characteristics. These fifteen variables are (1) mathematics anxiety - ANXMAT, (2) attitude towards school: learning outcomes - ATSCHL, (3) attitude towards school: learning activities - ATTLNACT, (4) sense of belonging to school - BELONG, (5) cognitive activation in mathematics lessons - COGACT, (6) attributions to failure in mathematics - FAILMAT, (7) instrumental motivation for mathematics - INSTMOT, (8) mathematics interest - INTMAT, (9) mathematics behaviour - MATBEH, (10) mathematics self-efficacy - MATHEFF, (11) mathematics intentions - MATINTFC, (12) mathematics work ethic - MATWKETH, (13) openness for problem solving - OPENPS, (14) perseverance - PERSEV, (15) mathematics self-concept - SCMAT.
To select variables for initial model, first of all, these fifteen variables were checked in terms of some basic statistical assumptions. Normality was checked by graphically and descriptively. It is decided that there is no skewness and kurtosis problem in general. Four variables with a high possibility of distortion were marked.
Linearity was checked by calculating bivariate and partial correlation coefficients. Also, multicollinearity was checked by calculating variance inflation factors, tolerance coefficients and condition index as collinearity diagnostics statistics. Five variables with insignificant or lower level of significance in terms of correlation were marked.
In addition, variables were checked for missing data, outliers and autocorrelations. It is seen that ratio of missing is under 5 percent for each variable. Assuming that the missing data were formed randomly, multiple imputation method was used to handle with missing data and to obtain complete data set. There is very small amount of outliers for each variable (under 1 percent). It was decided that there was no need to remove them from data set. According to Durbin-Watson statistics and Q-Q pilots for residuals, there is no autocorrelation problem.
Exploratory Studies
After preliminary controls and analysis, principal component analysis with oblique rotation was conducted with fifteen variables. Data set and variables are available for this analysis (KMO=0.853, Bartlett’s test of
Ergül DEMİR
176
sphericity χ2=7653.64, df=105 and p<0.05). Outputs of analysis were
considered in terms of communalities, total variance explained, factor loading and correlations between factors. It’s seen that two of fifteen variables (COGACT and MATINTFC) have lower communalities value and factor loadings. Also one variable (MATHEFF) has close factor loading on two factors. Due to that, total variance explained is reduced. So these three variables were removed from data set. After analysis with other twelve variables, a significant structure with four factors could be defined. For this structure, total variance explained and structure matrix and correlations between factors are shown in the following tables.
Table 1. Total Variance Explained by Factors
Factors Eigenvalues Eigenvalues Rotated Variance (%) Variance (%) Cumulative
1 4,238 3,657 35,316 35,316 2 1,747 2,150 14,559 49,875 3 1,391 1,906 11,593 61,468 4 1,030 2,056 8,581 70,049 * Factors with eigenvalues above 1.00 are shown in the table.
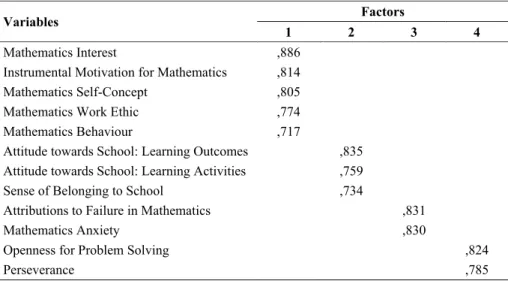
Table 2. Structure Matrix with Variables and Factors
Variables Factors
1 2 3 4
Mathematics Interest ,886
Instrumental Motivation for Mathematics ,814
Mathematics Self-Concept ,805
Mathematics Work Ethic ,774
Mathematics Behaviour ,717
Attitude towards School: Learning Outcomes ,835
Attitude towards School: Learning Activities ,759
Sense of Belonging to School ,734
Attributions to Failure in Mathematics ,831
Mathematics Anxiety ,830
Openness for Problem Solving ,824
Perseverance ,785
* Highest factor loadings are shown in the table. (Extraction method: Principal component analysis. Rotation method: Oblimin with Kaiser Normalization)
Table 3. Correlations between Factors Factors 1 2 3 4 1 1,000 ,149 -,169 ,323 2 ,149 1,000 -,103 ,154 3 -,169 -,103 1,000 -,113 4 ,323 ,154 -,113 1,000
End of exploratory studies, it was seen that a significant model is possible to structure with twelve affective variables. Communalities for these variables vary between 0.603 and 0.826. These variables are grouped under four factors. Total variance explained is approximately 70 percent. Correlations between factors are statistically significant but not high.
As seen at Table 2, the two of these four factors include just two variables. As a general guide, it is recommended that a factor should have at least three variables in order to define a factor. But, this depends on the design of the study and characteristics of the variables. If some factors have two variables, these factors interpreted with caution. And, it is possible when the variables are highly correlated with each other and almost uncorrelated with other variables (Kline, 1994; Tabachnick & Fidell, 2007). In this study, while the factorial model was forced with two factors, total variance explained by factors was reducing from 70 percent to 49 percent and communalities of some variables were reducing under 0.30. So, it was needed exclusion or inclusion. It is known that specifying too few factors by ignoring or combining some of them causes the loss of important information (Zwick & Velicer, 1986). Indeed, in this study, these couple variables were defined as indexes and standard way. And, correlations between them can be interpreted as high by considering the sample size and significance level (r>0.40 and p<0.001). Also, as seen at Table 3, factors are almost uncorrelated each other. Therefore, although some factors include two variables, they were preferred to define as separate factors and to include into the model.
First factor includes five affective variables, second factor includes three variables, third and fourth factors include two variables. Factors are named as emotions towards mathematics (EMAT), emotions toward school (ESCHL), mathematics concerns (CONS) and behaviour for problem-solving (BEHPS), respectively.
Confirmatory Studies
After exploratory studies, confirmatory factor analysis was conducted on primary level structural equation modelling with twelve variables and four factors. Modification indices was considered to improve model-data fit.
Ergül DEMİR
178
According to the results, this primary level model has statistically significant (χ2=656.64, df=39 and p<0.05). Some goodness of fit statistics are shown in
the following table.
Table 4. Goodness of fit statistics for Primary Level Structural Model
Indices Statistics
Root Mean Square Error of Approximation (RMSEA) 0.10
Root Mean Square Residual (RMR) 0.07
Standardized RMR 0.06
Normed Fit Index (NFI) 0.94
Comparative Fit Index (CFI) 0.94
Incremental Fit Index (IFI) 0.94
Relative Fit Index (RFI) 0.90
Goodness of Fit Index (GFI) 0.94
Adjusted Goodness of Fit Index (AGFI) 0.87
Parsimony Goodness of Fit Index (PGFI) 0.47
* All statistics are significant at 0.01 significance level.
According to the results, it is seen that a primary level model with twelve variables and four factors can be confirmed statistically. Although not showing perfect fit, this model is statistically significant and acceptable in terms of fit indices.
Secondary Level Structural Equation Modelling
After confirmatory studies, secondary level modelling was tried to construct by adding mathematics literacy skills plausible values (PV_MATH) as secondary level variables to the primary level model. Conceptual diagram for this model is shown in following figure.
Figure 1. Secondary Level Conceptual Diagram
Analysis was conducted by considering possible modifications to improve model-data fit. According to the results, a significant secondary level model could be constructed (χ2=406.77, df=93 and p<0.05). Some goodness
of fit statistics are shown in the following table.
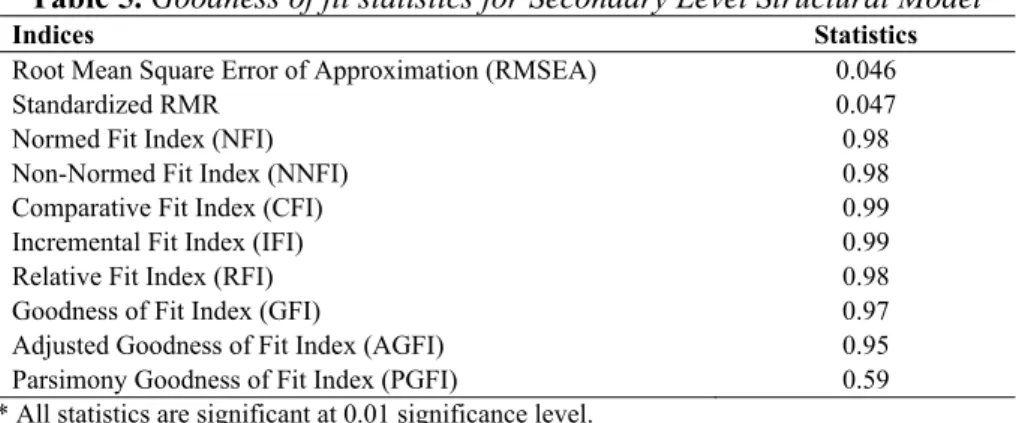
Table 5. Goodness of fit statistics for Secondary Level Structural Model
Indices Statistics
Root Mean Square Error of Approximation (RMSEA) 0.046
Standardized RMR 0.047
Normed Fit Index (NFI) 0.98
Non-Normed Fit Index (NNFI) 0.98
Comparative Fit Index (CFI) 0.99
Incremental Fit Index (IFI) 0.99
Relative Fit Index (RFI) 0.98
Goodness of Fit Index (GFI) 0.97
Adjusted Goodness of Fit Index (AGFI) 0.95
Parsimony Goodness of Fit Index (PGFI) 0.59
* All statistics are significant at 0.01 significance level.
As shown in table, the secondary level model fits very-well. Indices for residuals are below 0.05 and other indices are above 0.95.
INTMAT INSTMOT SCMAT MATWKE MATBEH EMAT ATSCHL ATTLNAC BELONG ESCHL FAILMAT ANXMAT CONS OPENPS PERSEV BEHPS PV-1 PV-2 PV-3 PV-4 PV-5 PV_MATH
Ergül DEMİR
180
Predictors of Mathematics literacy Skills
According to the significant model, it is possible to make inference about the predictive level of affective characteristics and best predictor for mathematical skills of students. Estimates for paths in the model are shown in the following table.
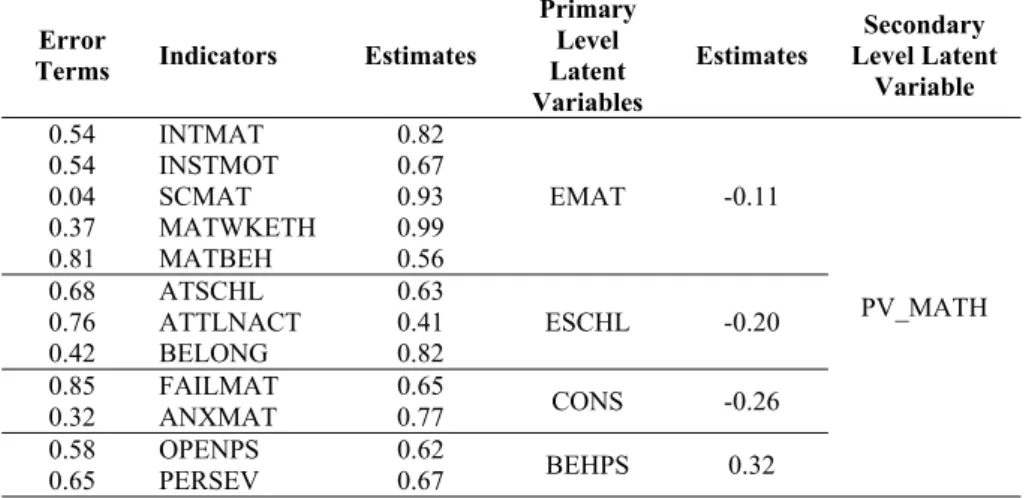
Table 6. Estimates for Paths in the Secondary Level Structural Model
Error
Terms Indicators Estimates
Primary Level Latent Variables
Estimates Level Latent Secondary Variable 0.54 INTMAT 0.82 EMAT -0.11 PV_MATH 0.54 INSTMOT 0.67 0.04 SCMAT 0.93 0.37 MATWKETH 0.99 0.81 MATBEH 0.56 0.68 ATSCHL 0.63 ESCHL -0.20 0.76 ATTLNACT 0.41 0.42 BELONG 0.82 0.85 FAILMAT 0.65 CONS -0.26 0.32 ANXMAT 0.77 0.58 OPENPS 0.62 BEHPS 0.32 0.65 PERSEV 0.67
* All paths are significant (t>2.34 and p<0.05).
As shown in table, among these four primary level latent variables, ‘behaviour for problem solving’ is best predictor of mathematics literacy skills. One-unit change in this variable leads 0.32 unit change in mathematics literacy skills. In other words, students with high level of ‘behaviour for problem solving’ have high level of ‘mathematics literacy skills’. Also opposite can be said. This finding and importance of problem solving skills on mathematics education are supported by some other researches (IEA, 2011; OECD, 2014c).
‘Emotional for mathematics’, ‘emotional for school’ and ‘mathematics concerns’ are negatively correlated with ‘mathematics literacy skills’. Also, indicators related with them are negatively correlated with ‘mathematics literacy skills’ as well. In terms of ‘mathematics concerns’, this is an expected and understandable finding. Students with high level of concerns have also lower level of mathematics literacy skills or vice versa. This result overlaps with the findings of previous researches (Cooper & Robinson, 1991; IEA, 2011; OECD, 2014a, 2014b; Thomas&Higbee, 1999). But, in terms of other
characteristics ‘emotions for mathematics’ and ‘emotions for school’, these findings are seems to be extraordinary and difficult to explain. It is understood that students who reported themselves with high level of ‘emotions for mathematics’ and ‘emotions for school’ have also lower level of ‘mathematics literacy skills’ or opposite. In fact, there are some researches that similar findings are obtained (IEA, 1996, 2011; OECD, 2014b; Özgen&Bindak, 2011; Yıldırım, 2011).
Among indicators, ‘perseverance’ is the best predictors of ‘mathematics literacy skills’ (0.67x0.32=0.2144). One-unit change in ‘perseverance’ leads 0.67 unit change in ‘behaviour for problem solving’ and 0.21 unit change in ‘mathematics literacy skills’. It is followed by ‘mathematics anxiety’ (0.77x0.26=0.2002). Oneunit change in this characteristic leads approximately -0,20 unit change in ‘mathematics literacy skills’. Thirdly, one-unit change in ‘openness for problem solving’ leads approximately 0,20 unit change in ‘mathematics literacy skills’ (0.62x0.32=0.1984).
On the other hand, lowest predictors among indicators are ‘mathematics behaviour’, ‘instrumental motivation for mathematics’, ‘attitude towards school: learning activities’ and ‘mathematics interest’ respectively. Again respectively, oneunit changes in these characteristics lead 0.0616, 0.0737, -0.0820 and -0.0902 unit change in ‘mathematics literacy skills’. As mentioned above, these findings can overlap with the findings of some previous researches.
DISCUSSION AND CONCLUSIONS
Findings of this study show that relations between student’s affective characteristics and mathematics literacy skills can be modelled on a multivariate structure. For such a model, PISA provides important advantages. PISA data includes many variables for students’ characteristics related with mathematics literacy skills. It is difficult to find such kind of data together. However, statistical models with these psychological data require meeting some certain assumptions. Therefore, such models are statistically limited. Processes for selecting variables and constructing the model should be conducted fairly sensitive. Moreover, each model is significant in its own limitations.
In this study, a secondary level structural equation model could be constructed significantly. In this model, relations between students’ affective characteristics and mathematics literacy skills were modelled in multivariate level. This model is statistically significant with high model-data fit. As
Ergül DEMİR
182
affective characteristics, 12 indicators were determined in the model. These observed variables were defined under four factors. These factors were named as ‘emotions for mathematics’, ‘emotions for school’, ‘mathematics concerns’ and ‘behaviour for problem solving’.
In the limitations of this model, among factors, best predictor of mathematics literacy skills is ‘behaviour for problem solving’. These latent variables are defined with ‘openness for problem solving’ and ‘perseverance’. It is seen that students with high level of ‘openness for problem solving’ and ‘perseverance’ have high level of mathematics literacy skills. Also opposite is true. It is seen obviously that problem solving skills are one of the very important proficiencies in the learning-teaching process.
Among factors, ‘mathematics concerns’ shows negative correlation with mathematics literacy skills. This factor was defined with ‘attributions to failure in mathematics’ and ‘mathematics anxiety’. Accordingly, students with high level of anxiety and attributions of failure have lower level of mathematics literacy skills. Also opposite can be said.
Among factors, ‘emotions for mathematics’ and ‘emotions for school’ show negative correlations with mathematics literacy skills. These factors were defined with ‘mathematics interest’, ‘instrumental motivation’, ‘mathematics self-concept’, ‘mathematics work ethic’, ‘mathematical behaviour’, ‘attitude towards school’ and ‘sense of belonging’. This means that students with high level of emotions for mathematics or school have also lower level of mathematics literacy skills. This findings are supported the results of some similar researches. This situation is possible to due to students’ reporting themselves. There may be differences between students’ real situations and observations. On the other hand, it is possible that this situations show negative effects of learning mathematics and schools on the development of students. There is need for in-depth research on these issues.
Among indicators, best predictor of mathematics literacy skills is ‘perseverance’. This is a positive predictive. It is followed by ‘mathematics anxiety’ as negative predictor. ‘Openness for problem solving’ is one of best predictors as positively. On the other hand, ‘mathematics behaviour’, ‘instrumental motivation for mathematics’, ‘attitude towards school: learning activities’ and ‘mathematics interest’ are lowest predictors of mathematics literacy skills. These characteristics are negative predictive. As mentioned about, it is possible that this situation is due to students reporting themselves. Or, it is possible that this situation show negative effects of mathematics and schools on the development of 15 year old students in Turkey.
This study showed that some 15-year-old students' affective characteristics are very closely related with mathematics literacy skills and competencies in Turkey. In order to support the development of students healthy, it is important to understand the nature of such kind of relations. In the teaching-learning process, improvements to be made in accordance with these characteristics would likely to raise and improve students’ performances.
For further research, it is recommended that other domains like science literacy should be considered. As another recommendation, it is thought that different structural models can be constructed with different variables. In addition, a comparative study between different cultures is recommended.
REFERENCES
Anıl, D. (2008). The analysis of factors affecting the mathematical success of Turkish students in the PISA 2006 evaluation program with structural equation modeling. American-Eurasian Journal of Scientific Research, 3 (2), 222-227. Ayotola, A., & Adedeji, T. (2009). The relationship between mathematics
self-efficacy and achievement in Mathematics. Procedia-Social and Behavioral
Sciences, 1(1), 953-957.
Cooper, S. E., & Robinson, D. A. G. (1991). The relationship of mathematics efficacy beliefs to mathematics anxiety and performance. Measurement and Evaluation
in Counseling and Development, 24 (1), 4-11.
De Lange, J. (2001). Mathematics for literacy. Paper Presented at the 2001 National
Forum on Qualitative Literacy, National Academy of Sciences. Washington
D.C. [Available online at:
http://www.maa.org/sites/default/files/pdf/QL/pgs75_89.pdf], Retrieved on March 22, 2015.
Dossey, J.A. (1997). Essential skills in mathematics. Washington D.C.: National Centre for Educational Statistics (NCES).
Haladyna, T. M. (1997). Writing test items to evaluate higher-order thinking. Needham Heights, MA: Allyn & Bacon.
IEA (1996). Mathematics achievement in the middle school years: IEA's third
international mathematics and science study. Chestnut Hill, MA: TIMSS Center,
Boston College.
IEA (2011). TIMSS 2011 international results in mathematics. Chestnut Hill, MA: TIMSS & PIRLS International Study Center, Lynch School of Education,
Boston College. [Available online at:
http://files.eric.ed.gov/fulltext/ED544554.pdf], Retrieved on March 22, 2015. Kaiser, G., & Willender, T. (2005). Development of mathematical literacy: Result of
an empirical study. Teaching Mathematics and Its Applications, 24(2-3), 48-60. Karasar, N. (2014). Bilimsel araştirma yöntemi (27. Baskı). Ankara: Nobel Akademik
Yayıncılık.
Kline, P. (1994). An easy quide to factor analysis. London and New York: Routledge, Taylor&Francis Group.
Ergül DEMİR
184
McCrone, S.S., & Dossey, J.A. (2007). Mathematical literacy: it’s become fundemental. Principal Leadership, 7(5), 32-37.
OECD (1999). Measuring student knowledge and skills: A new framework for
assessment. Paris: Organization for Economic Co-Operation and Development
(OECD) Publications.
OECD (2000). Knowledge and skills: First results from the OECD programme for
international student assessment (PISA) 2000. Paris: Organization for Economic
Co-Operation and Development (OECD) Publications.
OECD (2014a). PISA 2012 results in focus What 15-year-olds know and what they
can do with what they know (Volume I). Organization for Economic
Co-Operation and Development (OECD) Publications. [Available online at: http://www.oecd.org/pisa/keyfindings/pisa-2012-results-overview.pdf], Retrieved on March 22, 2015.
OECD (2014b). PISA 2012 results: Ready to learn students’ engagement, drive and
self-beliefs (Volume III). Organization for Economic Co-Operation and
Development (OECD) Publications. [Available online at: http://www.oecd.org/pisa/keyfindings/PISA-2012-results-volume-III.pdf], Retrieved on March 22, 2015.
OECD (2014c). PISA 2012 Results: Creative problem solving students’ skills in
tackling real-life problems (Volume V). Organization for Economic
Co-Operation and Development (OECD) Publications. [Available online at: http://www.oecd.org/pisa/keyfindings/PISA-2012-results-volume-V.pdf], Retrieved on March 22, 2015.
OECD (2014d). PISA 2012 technical report. Organization for Economic Co-Operation and Development (OECD) Publications. [Available online at: http://www.oecd.org/pisa/pisaproducts/PISA-2012-technical-report-final.pdf], Retrieved on March 22, 2015.
Özgen, K., & Bindak, R. (2011). Determination of self-efficacy beliefs of high school students towards math literacy. Educational Sciences: Theory & Practice, 11(2), 1085-1089.
Randhawa, B.S., Beamer, J.E. & Lundberg, I.(1993). Role of mathematics self-efficacy in the structural model of mathematics achievement. Journal of
Educational Psychology, 85(1), 41-48.
Slavin, R.E. (1992). Research methods in education (2th edition). Needham Heights, MA: Allyn & Bacon.
Steen, L.A. (Ed.). (2001). Mathematics and democracy: The case for quantitative
literacy. Princeton, NJ: National Council on Education and the Disciplines
(NCED).
Tabachnick, B. G., & Fidell, L. S. (2007). Using multivariate statistics (5th ed.). Boston, MA: Allyn & Bacon.
Thomas, P.V., & Higbee, J.L. (1999). Affective and cognitive factors related to mathematics achievement. Journal of Developmental Education, 23(1), 8-16. Yıldırım, S. (2011). Self-efficacy, intrinsic motivation, anxiety and mathematics
achievement: findings from Turkey, Japan and Finland. Necatibey Faculty of
Education Electronic Journal of Science and Mathematics Education, 5(1),
277-291.
Zwick, W. R., & Velicer, W. F. (1986). Factors influencing five rules for determining the number of components to retain. Psychological Bulletin, 99(3), 432-442.