THE ASSESSMENT OF HEAVY METAL CONTENT BY USING BIOACCUMULATION INDICES IN EUROPEAN CHUB, Squalius cephalus (Linnaeus, 1758)
Tam metin
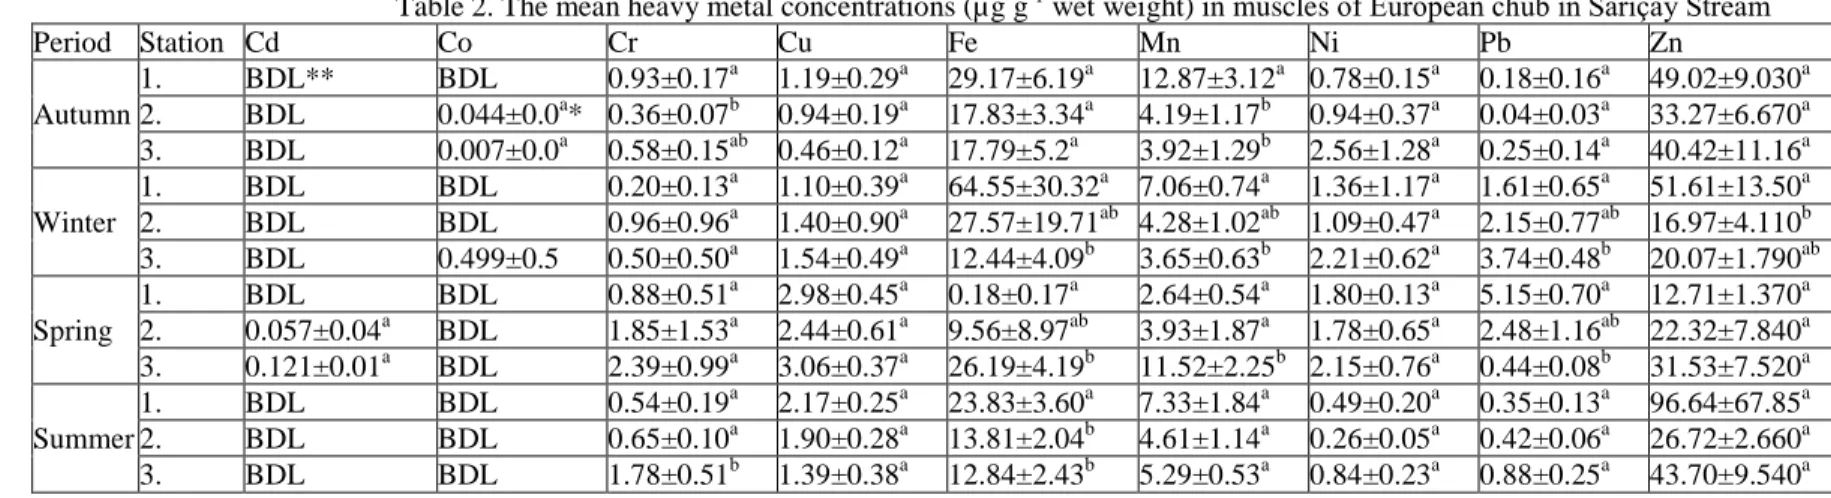
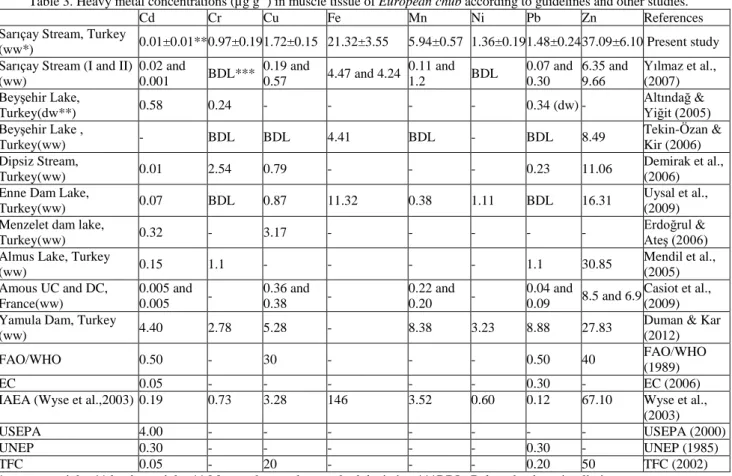
Şekil


Benzer Belgeler
The current outbreak of coronavirus disease 2019 (COVID-19) caused by severe acute respiratory syndrome coronavirus 2 (SARS-CoV-2) occurred in the wholesale market in Wuhan, China
Basının gelişmesi ve süreli yayın sayısının hızla artmasının Erme- ni harfli Türkçe yazma pratiği açısından anlamı dikkate alındığında durum daha
The aim of this paper is to evaluate the system of banking supervision in Turkey that can be clas- sified as regulatory authority’s supervision, internal audit and independent
Manila (121.1 o D, 14.7 o K) istasyonundan alınan saatlik foF2 verileri ile Dünya Data Merkezinden alınan Dst verilerinin e ş zamanlı ve gecikmeli de ğ
Tablo 6.5’te elektriksel veriler sonucunda hesaplanan kirlilik etkisi (KE) ve görüntü işleme işlemi sonucunda elde edilen kirlilik oranı (KO) verilmiştir.. Kirlilik etkisi
• Bir tırnağın tabanında lezyon bulunduğunda iyileşmeyi çabuklaştırmak ve ağrıyı ortadan kaldırmak için kullanılır.. ORTOPEDİK
Ölçüm yapılan birincil kökenli çok fazlı (sıvı+gaz+katı) ve iki fazlı (sıvı+gaz) kapanımlarda sıvı fazın gaz faza oranı daha fazla olup, kapanımların tümü sıvı
Ürün, tasarım yazılımlarıyla bilgisayar ortamında tasarlanır (CAD), imalat koşulları bilgisayar ortamında CAM ve benzer programlarıyla imalat açısından test edildikten
