INDIVIDUAL ANTECEDENTS of EMOTIONAL LABOUR
in AIRLINE INDUSTRY*
Meltem GÜNGÖR DELEN
ABSTRACT
Emotional labour is the display of organizationally desired emotions by employees during service interactions. Emotions are the last phenomenon, employees may incorporate to the labour process. Workers are expected to display some appropriate emotions to the customers, especially in service sector. There are individual antecedents of emotional labour as; gender, age, marital status, education, experience, and it’s assumed that these antecedents create a difference. The aim of this study is determining the individual antecedents of emotional labour through a research held in airline industry.
Keywords:
emotional labour, individual antecedents, flight attendantsHAVACILIK SEKTÖRÜNDE DUYGUSAL EMEĞİN BİREYSEL ÖNCÜLLERİ
ÖZ
Çalışma yaşamında duygusal emek; çalışanların hizmet verdikleri süre içinde, kendilerinden beklenen duyguları sergilemeleridir. Çalışanların emek sürecine katabilecekleri son olgu duygularıdır. Özellikle hizmet sektörü çalışanlarından, müşterilere karşı bir takım duyguları sergilemeleri beklenmektedir. Duygusal emek sürecinde farklılık yaratabilen bir takım bireysel öncüller bulunmaktadır. Bireysel öncüller; cinsiyet, yaş, medeni durum, eğitim ve tecrübe olarak sıralanabilir. Bu çalışmanın amacı; havacılık sektöründe yapılacak bir araştırma ile duygusal emeğin bireysel öncüllerini ve sonuçlarını belirlemektir.
Anahtar Kelimeler:
duygusal emek, bireysel öncüller, kabin ekibiINTRODUCTION
The growth in service industry and increased competition among service providers has forced organiza-tions to become more customer oriented. Organizaorganiza-tions, which prioritized customer satisfaction and improve service quality, could hardly survive in the market. Under these circumstances, hands and minds are not enough anymore, and new demands emerged in the labour process. Employees are now expected to manage their emotions in conformity with the organization’s strategy and policies. In service ındustry, emotional demands become a more and more prevalent component of the work (Leidner, 1999: 82).
There are also several reasons for the prevalence of emotional labour in service work. First, front-line employees are situated at the organization customer interface and represent the organization to customers. Second, most of the service transactions involve face to face interactions.
1
1
Makale Gönderim tarihi: 03.09.2016; Makale Kabul Tarihi: 22.02.2017 *
Third, the special feature of service work is customer participation in service encounter and it creates uncertainty. Fourth, the services rendered during an encounter are relatively intangible (Bowen, Chase, Cummings, & Associates, 1990; Bowen&Schneider, 1988; Brown, Gummeson, Edvardsoson, &Gustavsson, 1991 from Ashforth&Humphrey, 1993: 90). Emotional labour promotes customers’ assumptions about the organizations and product quality, in this context (Salami, 2007: 142). Featuring customer satisfaction, requires employees to behave in a friendly manner, even though they are exposed to negative behaviors by customers (Bryman, 2004: 117)
Service industry includes a wide range of jobs, and most of them have emotional demands more or less, but some of these jobs require higher emotional skills. Emotional labour can be observed mostly in interactive service work, especially the ones (railway or airline transportation) that employees share a confined space with clients.
1. LITERATURE REVIEW
1.1. Emotional LabourEmotional labour was first proposed by Arlie Russell Hochschild, in her book called “The Managed Heart: Commercialization of Human Feeling” in which she analyzed the emotional labour process of flight attendants in Delta Airlines. Hochschild defined emotional labour as “the management of feelings to create a publicly observable facial and bodily display” (2012: 7). It’s a dramaturgical perspective, where employee is an actor and customers are the audiences (Grandey, 2000: 96). There are some organizational norms about the range, intensity and duration of these desired emotions, and they are called as “feeling rules”. Ashforth and Humphrey defined emotional labour as “the act of displaying the appropriate emotion” and prefer the term “display rules”, because they refer to behavior than internal states. They suggest that behaviors are directly observed by customers and employees may conform to display rules without having to manage their feelings (1993: 90). Associated with the second part of their suggestion, Ashforth and Humphrey, excludes emotional effort and emotional dissonance somewhat in the emotional labour process.
Morris and Feldman defined emotional labour as “… the effort, planning, and control needed to express organizationally desired emotions during interpersonal transactions.” (1996: 987). In their definition, the first point is the effort required for managing emotions, the second and the most important point is that these emotions are determined by employer or management, because they are organizationally desired emotions. So we have to assume these emotional demands as a part of the labour process, and once they are displayed, emotions become a market commodity (1996: 98).
emotional display, attentiveness to required display rules, variety of emotions required to display and emotional dissonance.
Frequency of emotional display is the main indicator of emotional labour, and depends on the frequency of interaction between employee and customers. Frequency may differentiate among jobs in the service industry. In jobs including much more customer interactions and requiring socially appropriate emotional displays, organizations have high demands of regulated emotional displays (Morris&Feldman, 1996: 989). The second dimension of emotional labour is attentiveness to required display rules. The jobs that require more attentiveness require much more physical and mental effort and that means more emotional labour. Attentiveness depends on “duration of emotional display” and “intensity of emotional display”. Short interactions are much more specific and simple, and require less emotional effort than longer interactions (Morris&Feldman, 1996: 989-990). Emotional intensity is related to the strength and importance of an emotion that is experienced or expressed. Employees manage their emotions through; “surface acting” or “deep acting”. Surface acting is stimulating emotions that are not actually felt (Hochcschild, 2012: 35). In surface acting, employees behave as if they were feeling the organizationally required emotions, although their actual feelings are different. The second way is deep acting, whereby employees attempt to actually experience or feel the organizationally desired emotions (Ashforth&Humphrey, 1993: 93). In other words, it’s making an effort for actually feeling the required emotion, rather than sustaining the emotion actually felt (Topateş&Kalfa, 2010: 49).
The third dimension of emotional labour is the variety of emotions required. Variety of emotions to be displayed becomes an important and effortful activity for employees. Employees, who must alter the kinds of emotions displayed as a part of their work role, have to engage in more active planning and conscious monitoring of their behaviors (Morris&Feldman, 1996: 991). Displayed emotions can be integrative (positive), masking (neutral) and differentiating (negative). Positive emotional displays strengthen the emotional bond between employee and customer and can be observed through a wide range of service work, especially in public-contact work roles and hospitality industry. Emotional neutrality or masking emotions are aimed to convey the authority employees have, over the target of the interaction. Negative emotional displays can be observed on a limited scale, including distrust, irritation or hostility, aiming to make the clients feel unease, worry or fear (Wharton&Erickson, 1993: 466-467).
Emotional dissonance is the conflict between emotions required to be displayed and one’s actual feelings. It is generally accepted as a consequence of emotional labour in literature, but it can also be considered as a fourth dimension. Because, when employees’ genuine feelings clash with organizational
display rules, managing emotions or expressions becomes more difficult and effortful for them. And that means there is more emotional labour in these kinds of situations (Morris&Feldman, 1996: 992).
In their study, Kruml and Geddes (2000) identified a two dimensional structure, composed of emotive dissonance and emotive effort. Emotive dissonance is defined as the difference between felt and displayed emotions. And the emotive effort is defined by Hochschild’s notion of feeling management. This is one of the first studies, identifying emotive effort specifically as a dimension of emotional labour. This conceptual-ization is in congruence with Morris and Feldman’s (1996), but differs in classification.
1.2. Individual Antecedents of Emotional Labour
Hochschild (2012) suggested that the way employees perform emotional labour is influenced by individual and organizational (situational) characteristics (Lin Chu, 2002: 31). Morris and Feldman (1996), in their study, examined the relationships among organizational characteristics, job characteristics, individual differences, and the four dimensions of emotional labour. And they determined some of these antecedents as; explicitness of display rules, closeness of monitoring, routineness of task, power of role receiver, task variety, form of interaction, job autonomy, affectivity and gender. Kruml and Geddes (2000), analyzed; gender, age, experience and empathetic ability as individual antecedents and display training, display latitude, customer affect, quality orientation and emotional attachment as job characteristics. As it’s seen, organizational and job characteristics vary by studies, but individual antecedents have resemblances.
Gender has been found to be an important variable, that influence emotions people express and emotion regulation mechanisms they use. The result of many studies determined that women are more prone to display warmth and liking during transactions, than men. Men tend to display nonverbal cues that reflect power and authority, but women display more warmth and friendly cues (Bem, 1974; Freize&Ramsey, 1976; Seigler&Seigler, 1976 from Rafaeli, 1989: 385). And similar differences can be observed in verbal behavior (Putnam&Mc-Callister, 1980 from Rafaeli, 1989: 385). In her study with 1,300 clerks and 11,000 customers, Rafaeli determined that women clerks display positive emotions much more than male clerks (1989: 388). Although the reason for this gender difference is unclear, she makes some assumptions like; sex role socialization, women’s greater need for social approval and women’s greater ability to encode their emotions as the reason for this gender difference (Rafaeli, 1989: 391). Wharton and Erickson (1993) determine a connection between the work and family roles of women and states that women have to perform high amounts of emotion management at home and as to at work.
Age is another individual characteristic, and as Hochschild (2012) has suggested older employees are more adept at managing their emotions. They “speak more matter-of-factly about their emotional labor in
clearly defined and sometimes mechanistic ways: “I get in gear, I revved up, I get plugged in.”” (1983: 133). Kruml and Geddes also determined that older employees have higher emotive skills, as creating necessary feelings and displaying appropriate emotions (2000: 38). Experience has a similar effect as; “employees with less experience or occupational tenure are likely to feel more role uncertainty. Thus these employees are more likely to experience dissonance and effort.” (Kruml&Geddes, 2000: 25). Employees improve their emotional skills in time, but for the ones who have less experience, it’s effortful to manage their emotions and being inconformity with the display rules.
2. METHODOLOGY
2.1. Context of Research2.1.1. Characteristics of Airline Industry and Flight Attendants
The main object of airline industry is, providing passengers’ arrival, safely and comfortably to their desired location in due time. Passengers’ expectations are, to meet with friendly staff, to get a quality service, to spend a safe and comfortable travel. In the airline industry, customers are the final decision maker, in terms of service quality, thereby customer satisfaction is much more important than a great deal of other sectors (Okumuş&Asil, 2007: 11). The airline industry also, has similarities with the hospitality industry in specific ways, especially passengers are accepted as guests and hospitality has importance as well as the service provided in flight.
Flight attendants, who have close interaction with passengers during the flight, have to display all of the organizationally desired emotions, during these interactions. Whitelegg points out this case with a perfect statement; “… -through the absence of the smile – can be perceived by the customer as a faulty commodity” (2002: 75). The emotions, flight attendants display are an integral part of the service they provide. They also perform their work in a confined space, and have no place to escape during the flight. So we can say that flight attendants are the employees who are experiencing highest emotional labour.
2.1.2. Aim of the Study
The aim of this study is, to determine the influence of individual differences on emotional labour process. In some of the emotional labour studies (Morris&Feldman, 1996; Kruml&Geddes, 2000; Lin Chu, 2002), individual (gender, age, experience, empathetic ability, etc.) and organizational (explicitness of display rules, closeness of monitoring, routineness of task, power of role receiver, job autonomy, etc.) antecedents are determined. These individual or organizational characteristics influence how employees perform emotional labour. But studies in that area are still not enough and further researches are needed. In this study, individual antecedents such as gender, age, marital status, education level and experience, are examined and differences in groups are tried to identify.
2.2. Sample and Questionnaire Design
The boundary of this study is limited to the airline industry, and the target population was flight attendants who work in airline companies in İstanbul. İstanbul was chosen because, nearly all of the airline companies are centered in this city. The sample is determined by interval estimation and selected randomly because it’s failed to reach the exact number of the universe.
2.2.1. Sample
Gender range of the sample is nearly similar with the gender range of the universe, but the other features are randomly determined, because there was no specific data about the range of them in the universe.
Two thirds (%69,6) of the participants are female and %30,4 is male. Because of the gendered perceptions about this occupational group, it has seen as a female dominated job for many years. Although the gendered prejudices dwindled in the recent years, and men began to prefer it as a job, it’s seen that women are still predominant. The majority of the participants are in the 25-34 age group (%66,2), and about %80 of them are under the age of 34. It’s mostly because of the age limits determined by the employers, and it’s also not seen as a life time career by the employees. Only a small percentage (%21,2) of them keep on working as a flight attendant. About two third of the participants are single or divorced, and %36,2 of them are married. The education level of the participants is mostly high; %69,1 has a university degree (2 (%30) or 4 (%39,1) years), %3,9 has a master degree, only %27,1 of them has high school degree. Two-third of the participants has been in working life more than five years, %7,2 less than 1 year, %9,7 1-3 years, and %15,9 3-5 years. One-fourth of them has been working at the same organization more than ten years. The range of the other seniority groups is very close to each other.
2.2.1. Questionnaire Design
The Emotional Labour Scale used in this study, was developed by Lin Chu (2002) inherence to hospitality organizations, based on the studies of Kruml and Geddes (2000), Grandey (1999) and DeLay (1999). The emotional labour scale of Lin Chu was chosen because, hospitality and airline industries have similarities in terms of customer relations. The survey was translated into Turkish, and after the pilot scheme, some modifications (about translation) have been made on the questionnaire.
2.3. Data Analysis
Data was collected via self-administrated 229 surveys. After implementation, questionnaire forms were controlled, and 22 forms were determined as wrong or deficit, and eliminated, statistical evaluation was done over 207 surveys.
variable is “emotional labour score”. There were 18 questions about emotional labour in the survey, and participants were required to answer them in a likert scale of five. Overall average emotional labour score is determined by summing up each of the participants answers to the related questions and then dividing to 18. This overall average score is used as a dependent variable in analysis and individual characteristics are examined through differences in groups.
3. RESULTS
3.1. GenderIn the existing literature on emotional labour, it’s assumed that women are more prone to emotional labour skills than men (Taylor&Tyler, 2000: 91). T test is used for analyzing, whether there is a difference between emotional labour scores of male and female flight attendants. As a result of the analysis, the average score of male employees is 3,60 and female employees is 3,55.
Table 1: Emotional Labour Scores According to Gender
For p value in Levene’s test, that is done for determining the variance equality of the groups, is higher than 0,05 (p=0,27), so we can conclude that there is not an important statistical difference between male and female flight attendants.
3.2. Age
Differences between age groups are tested by ANNOVA. One of the main assumptions of ANNOVA is the equality of variances. The variance between age groups isn’t significant (p=0,39) and not equal, we have to be very careful while interpreting the test results.
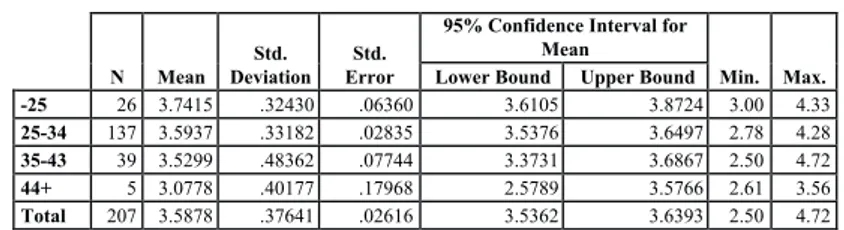
Table 2: Emotional Labour Scores According to Age Groups
We can suggest that there are significant differences (p=0.002) between age groups, but the inequality of variance between groups shouldn’t be forgotten. Because both of the p values are smaller than 0.05, we can still claim that there are differences between the emotional labour scores of age groups.
N Mean Std. Deviation Std. Error Mean Female 144 3.6069 .37207 .03101 Male 63 3.5441 .38557 .04858
N Mean Deviation Std. Error Std.
95% Confidence Interval for Mean
Min. Max. Lower Bound Upper Bound
-25 26 3.7415 .32430 .06360 3.6105 3.8724 3.00 4.33
25-34 137 3.5937 .33182 .02835 3.5376 3.6497 2.78 4.28 35-43 39 3.5299 .48362 .07744 3.3731 3.6867 2.50 4.72
44+ 5 3.0778 .40177 .17968 2.5789 3.5766 2.61 3.56
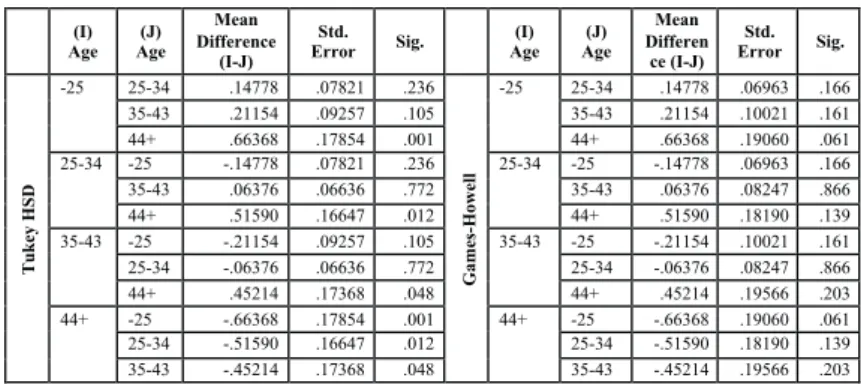
Table 3: Comparison between Age Groups
Results of Tukey is based on homogenous variance, so we have to consider the results of Games-Howell. According to these results, there is a marginal difference between “less than 25” and “more than 44” age group F(3,203) = 5.11, p < .05. On the other hand, such a difference between middle aged employees and young or elder employees couldn't be determined. As seen in the graphic below, the emotional labour scores of the employees’ decreases with increasing age, especially after the age of 43.
3.3. Education
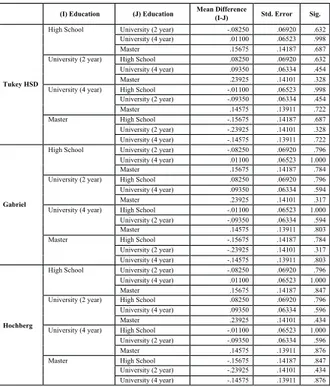
Education level is another criteria that has importance on emotional labour skills. The number of employees having a university degree of two years (These are mostly vocational high schools) is very high, so university level is divided into two groups as “2 years” and “4 years”.
Table 4: Emotional Labour Scores According to Education
Variance between the groups is homogenous (p=0.20), and results show no significant difference between the groups. Flight attendants having a university degree, has nearly the same emotional labour score as the ones having high school degree. Because there isn’t a significant difference between the groups, a post-hoc test is needed to determine which of the groups are different from each other. When sig. values are analyzed, it’s seen that none of the p values is under 0.05, in other words, none of them is at the %95 confidence interval. Consequently, no correlation is determined between emotional labour and education level. (I) Age Age (J) Mean Difference (I-J) Std.
Error Sig. Age (I) Age (J)
Mean Differen ce (I-J) Std. Error Sig. Tukey HSD -25 25-34 .14778 .07821 .236 Games -Howell -25 25-34 .14778 .06963 .166 35-43 .21154 .09257 .105 35-43 .21154 .10021 .161 44+ .66368 .17854 .001 44+ .66368 .19060 .061 25-34 -25 -.14778 .07821 .236 25-34 -25 -.14778 .06963 .166 35-43 .06376 .06636 .772 35-43 .06376 .08247 .866 44+ .51590 .16647 .012 44+ .51590 .18190 .139 35-43 -25 -.21154 .09257 .105 35-43 -25 -.21154 .10021 .161 25-34 -.06376 .06636 .772 25-34 -.06376 .08247 .866 44+ .45214 .17368 .048 44+ .45214 .19566 .203 44+ -25 -.66368 .17854 .001 44+ -25 -.66368 .19060 .061 25-34 -.51590 .16647 .012 25-34 -.51590 .18190 .139 35-43 -.45214 .17368 .048 35-43 -.45214 .19566 .203
N Mean Deviation Std. Error Std.
95% Confidence Interval for Mean
Min. Max. Lower
Bound Bound Upper
High School 56 3.5734 .39683 .05303 3.4671 3.6797 2.72 4.72 University (2 years) 62 3.6559 .33708 .04281 3.5703 3.7415 2.78 4.39 University (4 years) 81 3.5624 .36381 .04042 3.4820 3.6429 2.50 4.33 Master 8 3.4167 .58794 .20787 2.9251 3.9082 2.61 4.22 Total 207 3.5878 .37641 .02616 3.5362 3.6393 2.50 4.72
Table 5: Comparison between Education Levels
3.4. Marital Status
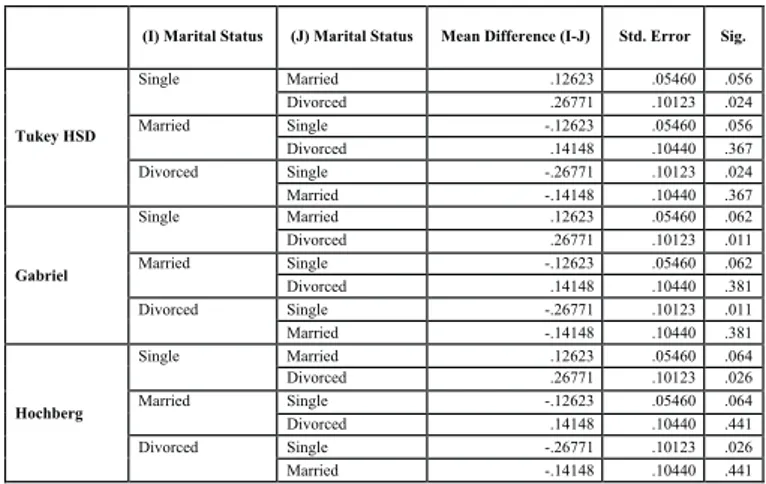
There are significant differences in emotional labor scores of flight attendants, according to marital status (p=0.007). We can say that marital status of employees affects their emotional labour skills.
Table 6: Emotional Labour Scores According to Marital Status
Variance between groups is homogenous, so there isn’t a significant difference between each other (p=0.91). Flight attendants who are single have the highest (3.65) emotional labour score, and the ones who are divorced have the lowest (3.38) scores. Gabriel’s test results will be more convenient, because the number of people in groups is not equal. Consequently, single flight attendants have significantly high scores than divorced ones (p<0.05) and marginally high scores than married ones (p<0.10). However, married and divorced employees don’t have different emotional labour scores (p>0.05), in other words their scores are very close to each other.
(I) Education (J) Education Mean Difference (I-J) Std. Error Sig.
Tukey HSD
High School University (2 year) -.08250 .06920 .632
University (4 year) .01100 .06523 .998
Master .15675 .14187 .687
University (2 year) High School .08250 .06920 .632
University (4 year) .09350 .06334 .454
Master .23925 .14101 .328
University (4 year) High School -.01100 .06523 .998
University (2 year) -.09350 .06334 .454
Master .14575 .13911 .722
Master High School -.15675 .14187 .687
University (2 year) -.23925 .14101 .328
University (4 year) -.14575 .13911 .722
Gabriel
High School University (2 year) -.08250 .06920 .796
University (4 year) .01100 .06523 1.000
Master .15675 .14187 .784
University (2 year) High School .08250 .06920 .796
University (4 year) .09350 .06334 .594
Master .23925 .14101 .317
University (4 year) High School -.01100 .06523 1.000
University (2 year) -.09350 .06334 .594
Master .14575 .13911 .803
Master High School -.15675 .14187 .784
University (2 year) -.23925 .14101 .317
University (4 year) -.14575 .13911 .803
Hochberg
High School University (2 year) -.08250 .06920 .796
University (4 year) .01100 .06523 1.000
Master .15675 .14187 .847
University (2 year) High School .08250 .06920 .796
University (4 year) .09350 .06334 .596
Master .23925 .14101 .434
University (4 year) High School -.01100 .06523 1.000
University (2 year) -.09350 .06334 .596
Master .14575 .13911 .876
Master High School -.15675 .14187 .847
University (2 year) -.23925 .14101 .434
University (4 year) -.14575 .13911 .876
N Mean Deviation Std. Error Std.
95% Confidence Interval for Mean
Min. Max. Lower Bound Upper Bound
Single 117 3.6529 .36099 .03337 3.5868 3.7190 2.61 4.72 Married 75 3.5267 .38764 .04476 3.4375 3.6159 2.50 4.39 Divorced 15 3.3852 .33364 .08615 3.2004 3.5699 2.83 3.89 Total 207 3.5878 .37641 .02616 3.5362 3.6393 2.50 4.72
Table 7: Comparison between Marital Statuses
3.5. Business Experience and Seniority
Experience is the time spent in the working life and seniority is the time spent in the current organization. It’s assumed that, business experience of the flight attendants will be effective on emotional labour skills and will create a difference between the groups.
Table 8: Emotional Labour Scores According to Business Experience
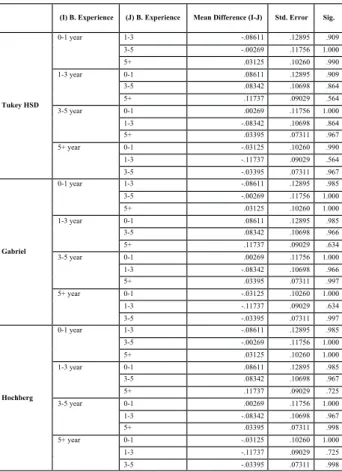
Variance between the groups are homogenous, so there isn’t a significant difference between them (p=0.96). Although the ones who have 1-3 years of experience have the highest emotional labour scores, there isn’t a significant difference between the groups (p=0.62). As it’s seen in the post-hoc test results, none of the p value is under 0.05, in other words, none of them is at the %95 confidence interval. Consequently, no relationship is determined, contrary to our assumptions.
(I) Marital Status (J) Marital Status Mean Difference (I-J) Std. Error Sig.
Tukey HSD Single Married .12623 .05460 .056 Divorced .26771 .10123 .024 Married Single -.12623 .05460 .056 Divorced .14148 .10440 .367 Divorced Single -.26771 .10123 .024 Married -.14148 .10440 .367 Gabriel Single Married .12623 .05460 .062 Divorced .26771 .10123 .011 Married Single -.12623 .05460 .062 Divorced .14148 .10440 .381 Divorced Single -.26771 .10123 .011 Married -.14148 .10440 .381 Hochberg Single Married .12623 .05460 .064 Divorced .26771 .10123 .026 Married Single -.12623 .05460 .064 Divorced .14148 .10440 .441 Divorced Single -.26771 .10123 .026 Married -.14148 .10440 .441
N Mean Deviation Std. Error Std.
95% Confidence Interval for Mean
Min Max Lower Bound Upper Bound
0-1 year 15 3.6000 .37515 .09686 3.3922 3.8078 2.89 4.22 1-3 year 20 3.6861 .37432 .08370 3.5109 3.8613 2.83 4.33 3-5 year 33 3.6027 .37606 .06546 3.4693 3.7360 2.89 4.22 5+ year 139 3.5687 .37855 .03211 3.5053 3.6322 2.50 4.72 Total 207 3.5878 .37641 .02616 3.5362 3.6393 2.50 4.72
Table 9: Comparison between the Groups
It’s also assumed that the seniority of the flight attendants in the current organization, will be effective on emotional labour skills and will create a difference between the groups.
Table 10: Emotional Labour Scores According to Seniority
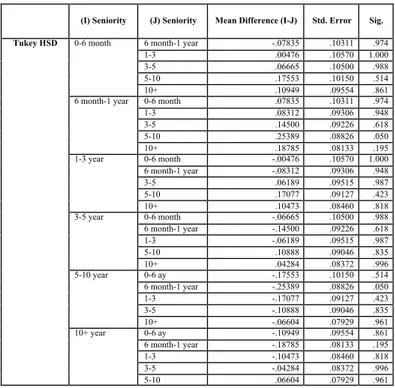
Variance between the groups are homogenous, so there isn’t a significant difference between them (p=0.11). There are marginal differences (p=0.07) between groups, in terms of emotional labour scores. In other word, seniority of employees affects their emotional labour scores.
(I) B. Experience (J) B. Experience Mean Difference (I-J) Std. Error Sig.
Tukey HSD 0-1 year 1-3 -.08611 .12895 .909 3-5 -.00269 .11756 1.000 5+ .03125 .10260 .990 1-3 year 0-1 .08611 .12895 .909 3-5 .08342 .10698 .864 5+ .11737 .09029 .564 3-5 year 0-1 .00269 .11756 1.000 1-3 -.08342 .10698 .864 5+ .03395 .07311 .967 5+ year 0-1 -.03125 .10260 .990 1-3 -.11737 .09029 .564 3-5 -.03395 .07311 .967 Gabriel 0-1 year 1-3 -.08611 .12895 .985 3-5 -.00269 .11756 1.000 5+ .03125 .10260 1.000 1-3 year 0-1 .08611 .12895 .985 3-5 .08342 .10698 .966 5+ .11737 .09029 .634 3-5 year 0-1 .00269 .11756 1.000 1-3 -.08342 .10698 .966 5+ .03395 .07311 .997 5+ year 0-1 -.03125 .10260 1.000 1-3 -.11737 .09029 .634 3-5 -.03395 .07311 .997 Hochberg 0-1 year 1-3 -.08611 .12895 .985 3-5 -.00269 .11756 1.000 5+ .03125 .10260 1.000 1-3 year 0-1 .08611 .12895 .985 3-5 .08342 .10698 .967 5+ .11737 .09029 .725 3-5 year 0-1 .00269 .11756 1.000 1-3 -.08342 .10698 .967 5+ .03395 .07311 .998 5+ year 0-1 -.03125 .10260 1.000 1-3 -.11737 .09029 .725 3-5 -.03395 .07311 .998
N Mean Deviation Std. Error Std.
95% Confidence Interval for Mean
Min Max Lower Bound Upper Bound
0-6 month 21 3.6455 .26263 .05731 3.5260 3.7651 3.17 4.22 6 m.-1 year 34 3.7239 .31826 .05458 3.6128 3.8349 3.00 4.33 1-3 year 30 3.6407 .38538 .07036 3.4968 3.7846 2.83 4.28 3-5 year 31 3.5789 .39278 .07055 3.4348 3.7229 2.89 4.22 5-10 year 37 3.4700 .31470 .05174 3.3650 3.5749 2.67 4.11 10+ year 54 3.5360 .44551 .06063 3.4144 3.6576 2.50 4.72 Total 207 3.5878 .37641 .02616 3.5362 3.6393 2.50 4.72
The flight attendants who has just started working at the organization, especially the ones having more than 6 moths and less than 1 year of seniority has the highest emotional labour scores (3.72). The groups that have significant differences can be determined by a post-hoc test. According to the test results, only 6 month-1 year and 5-10 year groups have statistically higher scores (p=0.05). In other words, there is a significant difference only between these two groups, and there is no difference between the other groups.
Table 11: Comparison between the Groups
As a conclusion, according to the results, the characteristics like “seniority in the current organization” (the ones having seniority of 6 month-1year, from the ones having seniority of 5-10 years), “marital status” (the single ones from the divorced ones), “age” (the ones younger than 25 years old from the ones more than 44) effects the participants emotional labour scores significantly. On the other hand, no significant effect of “gender”, “education level”, and “business experience” is determined on emotional labour scores.
DISCUSSION
Airline industry is one of main industries that requires high emotional demands, especially flight attendants are subjected to these demands, because of their close interactions with passengers. As Hochschild stated; “… the emotional style of offering the service is part of the service itself…” (2012: 5). This statement is more important for the airline industry, because service encounter is the key criterion that
(I) Seniority (J) Seniority Mean Difference (I-J) Std. Error Sig.
Tukey HSD 0-6 month 6 month-1 year -.07835 .10311 .974
1-3 .00476 .10570 1.000
3-5 .06665 .10500 .988
5-10 .17553 .10150 .514
10+ .10949 .09554 .861
6 month-1 year 0-6 month .07835 .10311 .974
1-3 .08312 .09306 .948 3-5 .14500 .09226 .618 5-10 .25389 .08826 .050 10+ .18785 .08133 .195 1-3 year 0-6 month -.00476 .10570 1.000 6 month-1 year -.08312 .09306 .948 3-5 .06189 .09515 .987 5-10 .17077 .09127 .423 10+ .10473 .08460 .818 3-5 year 0-6 month -.06665 .10500 .988 6 month-1 year -.14500 .09226 .618 1-3 -.06189 .09515 .987 5-10 .10888 .09046 .835 10+ .04284 .08372 .996 5-10 year 0-6 ay -.17553 .10150 .514 6 month-1 year -.25389 .08826 .050 1-3 -.17077 .09127 .423 3-5 -.10888 .09046 .835 10+ -.06604 .07929 .961 10+ year 0-6 ay -.10949 .09554 .861 6 month-1 year -.18785 .08133 .195 1-3 -.10473 .08460 .818 3-5 -.04284 .08372 .996 5-10 .06604 .07929 .961
The present results support these high emotional demands, with high emotional labour scores among flight attendants. Through analyzes of individual antecedents of emotional labour, some of our assumptions are verified and some of them not.
In previous studies, it’s assumed that women are more prone to emotional labour skills than men, but research results doesn’t support this assumption. However as the result of research, no significant difference could be detected between male and female flight attendants in terms of emotional labour scores. Different assumptions are found for the age factor. Since employees in older age gain experience about how to manage their emotions, or their personal characters become more dominant, they may experience difficulties in displaying certain emotions. According to the results, a difference was determined between 25 years old and younger employees and 44 years old and older employees. The emotional labour scores start to decrease after 42 years old. Education level is another criterion that can make a difference in the emotional labour process. However, no relationship has been identified between emotional labour and education level. When groups are examined according to their marital status in terms of the emotional labour scores, it was observed that emotional labour scores of single flight attendants are higher than those who are married and divorced. Also there isn’t a significant difference between married and divorced.
According to the professional status; firstly business experience was examined, and it was assumed that the emotional labour scores will increase as the business experience of the participants will increase. Although those who have 1-3 years of experience have higher average scores of emotional labour, there is no statistically significant difference between the groups. Hence, no relationship has been identified between the business experience and emotional labour. Another factor is the seniority in the current organization. Just as in business experience, it was assumed that the emotional labour scores will increase as their seniority increase. The emotional labour score of those who have low seniority (6 months - 1 year) and those who have 5 year and more seniority were higher than those who have average seniority.
As a result, factors such as seniority, marital status, age seriously affect the average emotional labour scores of the participants in this study. On the other hand, no effect of gender, education level and work experience on average emotional labour scores was detected.
REFERENCES
Ashforth, B. E. & Humphrey, R. H. (1993). Emotional Labor in Service Roles: The Influence of Identity. Academy of Management Review, 18(1), 88-115.
Bem, S. L. (1974). The Measurement of Psychological Androgyny. Journal of Consulting and Clinical Psychology, 42, 155-162.
Bowen, D. E., Chase, R.B., T.G. Cummings & Associates. (1990). Service Management Effectiveness: Balancing Strategy, Organization and human Resources, Operations, and Marketing, San Francisco: Jossey-Bass.
Bowen, D. E. & Schneider, B. (1998). Services Marketing and Management: Implications for Organiza-tional Behavior. In B. M. Staw & L. L. Cummings (Ed.), Research in OrganizaOrganiza-tional Behavior, 10, (pp. 43-80). Greenwich, CT: JAI Press.
Brown, S. W., Gummesson, E., Edvardsson, B. & Gustavsson, B. (1991). Service Quality; Multidisci-plinary and Multinational Perspectives. Lexington, MA: Lexington.
Bryman, A. (2004). The Disneyization of Society, SAGE Publications Ltd.
Delay, M.T. (1999). Emotional Labour in the Workplace, Unpublished Master Thesis, University of Arkansas, Little Rock.
Freize, I.H., Ramsey, S.J. (1976). Nonverbal Maintenance of Traditional Sex Roles. Journal of Social Issues, 32(3), 133-141.
Grandey, A. A. (2000). Emotion Regulation in the Workplace: A New Way to Conceptualize Emotional Labor. Journal of Occupational Health Psychology, 5(1), 95-110.
Hochschild, A. R. (2012). The Managed Heart: Commercialization of Human Feeling. London: University of California Press.
Kruml, S. M. & Geddes Deanna (2000). Exploring the Dimensions of Emotional Labor. Management Communication Quarterly, 14(1), 8-49.
Leidner, R. (1999). Emotional Labor in Service Work. The ANNALS of the American Academy of Political and Social Science, 561, 81-95.
Lin Chu K. H. (2002). The Effects of Emotional Labor on Employee Work Outcomes, Unpublished Phd Thesis, Faculty of the Virginia Polytechnic Institute and State University.
Morris, J. A. & Feldman Daniel C. (1996). The Dimensions, Antecedents and Consequences of Emotional Labor. Academy of Management Review, 21(4), 986-1010.
Putnam, L. & McCallister, L. (1980). Situational Effects of Task and Gender on Their Nonverbal Display, In D. Nimmo (Ed.), Communications Yearbook, 4, (pp.679-697), Beverly Hills, CA: Sage.
Rafaeli, A. (1989). When Clerks Meets Customers: A Test of Variables Related to Emotional Expressions on the Job. Journal of Applied Psychology, 74(3), 385-393.
Salami, S. O. (2007). Moderating Effect of Emotional Intelligence on the Relationship Between Emotional Labour and Organizational Citizenship Behavior. European Journal of Social Sciences, 5(2), 142-150.
Taylor, S. & Tyler, M. (2000). Emotional Labour and Sexual Difference in the Airline Industry. Work, Employment&Society, 14(1), 77-95.
Topateş H. & Kalfa, A. (2010). Yeni Çalışma İlişkileri Bağlamında Örgütsel Yurttaşlık ve Duygusal Emek. İktisat Dergisi, 513, 46-53.
Wharton, A. (1993) The Affective Consequences of Service Work. Work and Occupations, 20, 205-232. Wharton, A. S. & Erickson, R. C. (1993) Managing Emotions on the Job and at Home: Understanding the Consequences of Multiple Emotional Roles. Academy of Management Review, 18(3), 457-486.
Whitelegg, D. (2002) Cabin Pressure: The Dialectics of Emotional Labour in the Airline Industry. The Journal of Transport History, 23(1), 73-86.