THE IMPACT OF THE OHIO GRADUATION TEST ON GEOGRAPHY INSTRUCTION AS PERCEIVED BY THE SECONDARY SOCIAL STUDIES
TEACHERS IN CENTRAL OHIO
DISSERTATION
Presented in Partial Fulfillment of the Requirements for the Degree of Doctor of Philosophy in the Graduate
School of The Ohio State University By
Cemalettin Ayas, M.Ed. * * * * *
The Ohio State University 2009
Dissertation Committee: Approved by
Professor Steven L. Miller, Advisor _____________________________ Professor W. Randy Smith Advisor
Professor Cynthia A. Tyson College of Education and Human Ecology
Copyright by Cemalettin Ayas
ii
ABSTRACT
The purpose of this study was to explore the perspectives of social studies teachers concerning the impact of the Ohio Graduation Test (OGT) on geography instruction in the secondary schools of central Ohio. The central research question was, “From the perspectives of social studies teachers in secondary schools of central Ohio, what has been the effect of the Ohio Graduation Test (OGT) on geography instruction?” In order to answer this major question in addition to supplementary research
sub-questions, an exploratory study employing quantitative methods was designed and successfully carried out in accordance with the procedures explained in detail in the methodology chapter.
To summarize, the population of this study consisted of all secondary social studies teachers who are currently teaching in the middle and high schools of central Ohio. A specifically developed 28-item cross-sectional survey as the major data
collection instrument for this study was constructed through a content validity approach and pilot tested. The survey instrument was then administered via the Internet to a randomly selected sample of secondary social studies teachers. The number of teachers who responded to the questionnaire is 206. The data gathered were analyzed by SPSS 16.0. Data analysis of the study basically utilized descriptive statistics. Tables and figures were constructed to present the results. The research instrument was intended to measure the perspectives of social studies teachers regarding whether or not there has been a
iii
change in geography instruction following the OGT, especially in the areas of instructional time devoted to teaching geography, curriculum and the instructional strategies used in the classroom, use of teaching materials, emphasis of particular
geographic concepts/topics, and perceptions about geography and the impact of the OGT. The major demographic profile of the research subjects, according to responses from social studies teachers who participated in the study, is by and large Caucasian males who teach middle class students with above average OGT scores in suburban public schools for 11 or more years. A great majority of those teachers have a master’s degree, hold a comprehensive social studies (7-12) licensure and completed at least two or more college level geography courses. One-third of these teachers work at a middle school and two-thirds work in a high school setting. Typically they work as teachers of U.S. History, World History and U.S. Government.
Due to the nature of the OGT as a state-mandated standardized testing program, the results of this study mainly contributed to two bodies of literature: geography education in particular and high-stakes testing in general. Based on the overall research findings, it would be reasonable to infer that the OGT has impacted the way in which geography instruction is delivered in the secondary schools of central Ohio. Yet, this effect showed some variation by school level (middle school versus high school) as well as by grade level (Grades 6-8, 9-10 and 11-12).
Parallel to the current literature regarding the effects of high-stakes testing on teaching and learning, the results of this study indicate that social studies teachers do practice more of a “teaching to the test” strategy since the implementation of the OGT.
iv
The findings specifically suggest that teachers who teach the grades where the OGT is administered evidently perform more “teaching to the test” behavior and are under more pressure. However, the most important impact that the OGT has had on geography
instruction is a noteworthy decrease in the amount of time teachers spend with geography in their general social studies curriculum. According to the data, the time devoted to teaching geography is diminishing. Even though geography is one of the social studies subjects tested on the OGT, the decrease in the amount of time to teach geography within the social studies curriculum might imply that the geography portion of the social studies test on the OGT is not as important as the others or that geography is over-shadowed in the social studies curriculum by other subjects—particularly by history. This was evidenced by the finding that teachers consider geography the least emphasized among the social studies content areas tested on the OGT.
As a result, along with recommendations for further research, contributions to the related literature and implications for both policy-making and teaching and learning were discussed in detail.
v
DEDICATION
Dedicated to my wife, Mehtap, and my children, Beyza, Mehmet and Zeynep And my mother and father, Ayşe and Mehmet Ayas
vi
ACKNOWLEDGMENTS
The completion of this dissertation is my dream came true. Yet, I have not been alone through this tough and long journey. I must therefore take this opportunity to recognize many people who were around throughout the process. It is their support, guidance, encouragement and friendship that made this dissertation possible.
First of all, I feel a great indebtedness to my doctoral committee members at The Ohio State University (OSU). I wish to start with Dr. Steven L. Miller, the most fantastic advisor a graduate student could ever have. I simply find no words to express my
appreciation to him. He has provided continuous academic support, guidance and expertise to reach this moment of my doctoral accomplishment. He has always been ready to help and answered all of my questions patiently each time—even at a moment’s notice. Being his apprentice has truly taught me a lot. I wish every student could have an advisor like him. Unfortunately, he is retiring with me, but I am happy for him as he will finally have some time to play golf.
I wish to express my sincere gratitude to Dr. W. Randy Smith. It was my privilege to know and work with him. He always had time for me in his extremely busy schedule as a vice provost for the university. His constant feedback and wisdom genuinely encouraged me to do my best throughout my doctoral study. I learned a great deal from him through our regular conversations concerning the context of school geography around Ohio as well as across the U.S. It was him who inspired me to become a geographically-minded educator.
vii
I wish to extend my gratitude to Dr. Cynthia A. Tyson. She has generously offered genuine and affective support at each step of my graduate studies here at OSU. Her encouraging words, valuable suggestions and kind friendship not only during this hard dissertation process but also throughout my doctoral education renewed my confidence in myself and put me back on track. I cannot thank her enough for her sincerity and enthusiasm for my work.
I also want to thank the other faculty and staff in our department of Social Studies & Global Education, namely Dr. Merry M. Merryfield, Dr. Kent J. Minor, and Carol Barbee for their invaluable contributions to my academic growth and dissertation.
I remain indebted to many great educators for their tremendous contributions to my dissertation. Dr. Tom Peet, Toni Wills, Stanley K. Ray and Frank Wilson are only a few that I could name. Special thanks go to countless and nameless teachers as it was their input and involvement that made this dissertation a success. A particular
acknowledgement is expressed to the Ohio Department of Education and its staff— especially Dwight Groce; to the many researchers from whose studies I benefited; and to those scholars and educators who strive for a higher status given to geography in
secondary schools.
In addition to many people in academia and education, I would like to acknowledge that there also are numerous others whose unconditional support,
encouragement, friendship and love truly made this dissertation possible. I am especially grateful for being part of the Turkish community in Columbus. They provided
extraordinary support and help whenever it was needed. I especially feel very lucky to have such friends who are always there for me. Among them I must recognize Bayram
viii
Yõlmaz, another doctoral candidate in education here at OSU, for his 24/7 friendship. He has helped me enormously from start to finish. I cannot thank him enough for the
conversations and discussions we held for countless days and hours. Additionally, I really appreciate the support and friendship offered by Kerem Dirlikli and Mustafa Namlõ. I also owe a big “thank you” to Osman Topaç, an OSU alumnus, who voluntarily became my voice in Turkey.
My heartfelt appreciation goes to my parents, Ayşe and Mehmet; my brother, Metin and my sisters, Fatma and Esin, for their caring and prayers. It was one of the toughest things for all of us to live separate so many years in two distant parts of the world. I also never forget how generously my uncle, Hüseyin Işõk, supported me financially during the first steps of my academic life.
My deepest gratitude of all goes to my family: my wonderful wife, Mehtap, and my amazing children, Beyza, Mehmet and Zeynep. It has been their support,
understanding, motivation and love that made me believe in myself to complete this tough journey. I could never have come this far without them. I do not know how I could ever repay them. I have now come to understand what the famous saying, “Behind every successful man is a woman,” truly means. It is thus not me, but them, who rightfully deserve the credit for this significant achievement.
I would finally like to express my immeasurable gratitude to my sponsor, the Turkish Ministry of Education, for the tremendous financial support they provided throughout my graduate studies here in the United States. Therefore, I greatly feel indebtedness to serving my country. Thanks to all from the bottom of my heart.
ix
VITA
November 23rd, 1973 ...Born-M. Kemalpasa, Bursa, Turkey 1995 ...B.S. Geography Education
Marmara University, Istanbul, Turkey 1995-1996 ...Geography and Social Studies Teacher Semdinli High School, Hakkari, Turkey
1996-1998 ...Graduate Work, Institute of Social Sciences Marmara University, Istanbul, Turkey
1996-1999 ...Geography Teacher
Halit Armay High School, Istanbul, Turkey
2000-2001 ...English Teacher
Esenkent Elementary School, Istanbul, Turkey 2001-2002 ...M.Ed., Social Studies Education
University of Missouri-Columbia 2004-2006 ...Graduate Teaching Associate Social Studies & Global Education
x
PUBLICATIONS
Ayas, C. (2008). Examining the place of geography in the American social studies curriculum and towards an effective teacher education in K-12 geography. University of Gaziantep Journal of Social Sciences, 7(2), 367-381.
http://www1.gantep.edu.tr/~sosbil/journal/index.php/sbd
Ayas, C. (2006). An examination of the relationship between the integration of
technology into social studies and constructivist pedagogies. The Turkish Online Journal of Educational Technology, 5(1), 14-25.
http://www.tojet.net/volumes/v5i1.pdf
FIELDS OF STUDY
Major Field: Education
Social Studies & Global Education Minor Fields: Geography
xi TABLE OF CONTENTS Page Abstract... ii Dedication ...v Acknowledgments ...vi Vita ...ix
List of Tables ...xiv
List of Figures ...xvi
CHAPTERS 1. INTRODUCTION ...1
Background of the Study...3
No Child Left Behind ...6
The New Ohio Social Studies Academic Content Standards ...7
The New Ohio Graduation Test ...10
Geography Education in the United States...13
Purpose of the Study and Research Questions ...18
Significance and Context of the Study ...19
Overview of the Methodology ...22
Research Method...23 Sampling...23 Instrumentation ...24 Data Collection ...25 Data Analysis ...25 Definition of Terms ...26
Assumptions of the Study ...30
Limitations of the Study...31
Organization of the Study ...32
2. LITERATURE REVIEW ...34
Literature in High-Stakes Testing ...34
xii
Testing for High School Graduation ...36
Impact of High-Stakes Testing ...40
Literature in Geography Education ...46
Geography as a Discipline ...46
History of Geographic Thought: Traditions of Geography ...48
Quantitative Revolution ...52
Geography as a School Subject...53
Renaissance in Geographic Education...55
National Standards 1994: Geography for Life ...62
New Ohio State Standards for Social Studies ...70
Integration of Geography into Social Studies ...75
Conclusion ...80
3. METHODOLOGY ...82
Introduction ...82
Statement of the Research Questions ...83
Research Methods...84 Sampling ...86 Data Collection...89 Data Analysis ...93 Time Schedule ...95 4. RESULTS ...97 Introduction ...97 Background Information...99 Research Sub-Question 1 ...116 Research Sub-Question 2 ...122 Research Sub-Question 3 ...127 Research Sub-Question 4 ...131 Research Sub-Question 5 ...134
Teachers’ Perceptions about Teaching Geography...134
Teachers’ Perceptions about Familiarity with and Incorporation of Selected Curricular Resources ...136
Teachers’ Perceptions about Test Preparation...140
Teachers’ Perceptions about Test Pressure ...142
xiii
5. DISCUSSION ...146
Summary ...146
Interpretations of the Research Findings ...148
Discussions and Contributions to the Literature ...151
Discussion and Contributions to the Literature in Geography Education...152
Discussion and Contributions to the Literature in High-Stakes Testing ...156
Implications of the Study ...159
Recommendations for Further Research...162
APPENDICES APPENDIX A. Recruitment Letter...165
APPENDIX B. Ohio Geographic Alliance Support Letter...167
APPENDIX C. IRB Exemption ...1679
APPENDIX D. Survey Instrument...16771
xiv
LIST OF TABLES
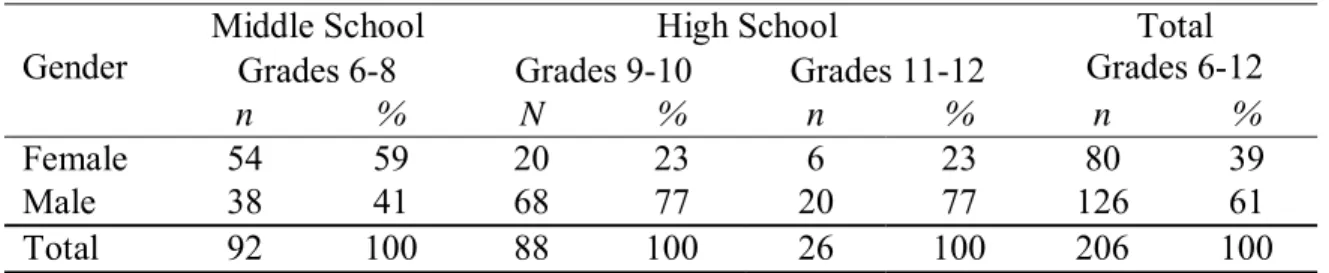
Tables Page Table 2.1: Geography for Life: National Geography Standards 1994 ...68 Table 4.1: Distribution of Frequencies and Percentages for Central Ohio Social Studies
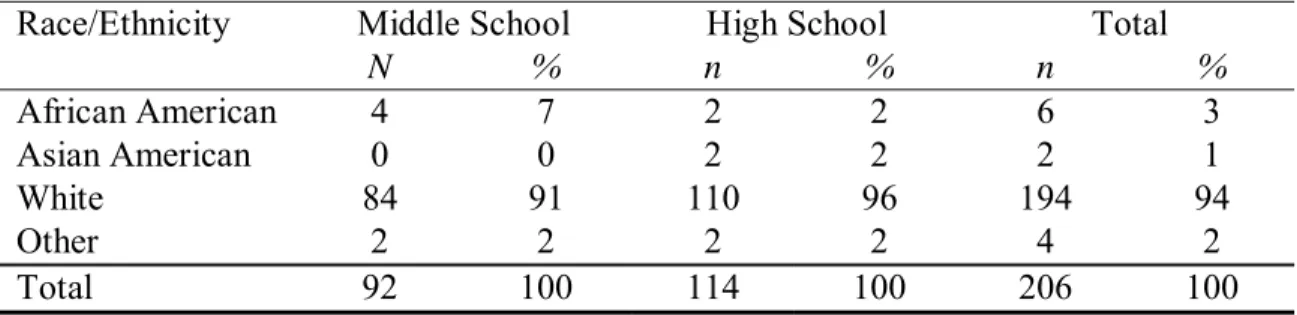
Teachers’ Gender...99 Table 4.2: Distribution of Frequencies and Percentages for Race/Ethnicity of Central
Ohio Social Studies Teachers...100 Table 4.3: Distribution of Frequencies and Percentages for Central Ohio Social Studies
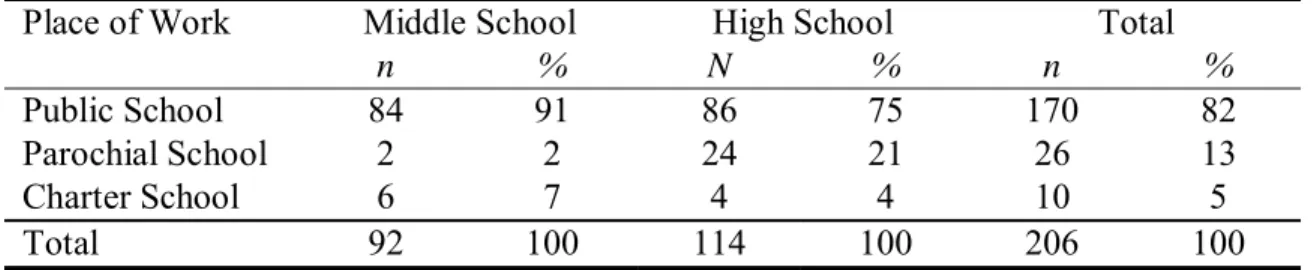
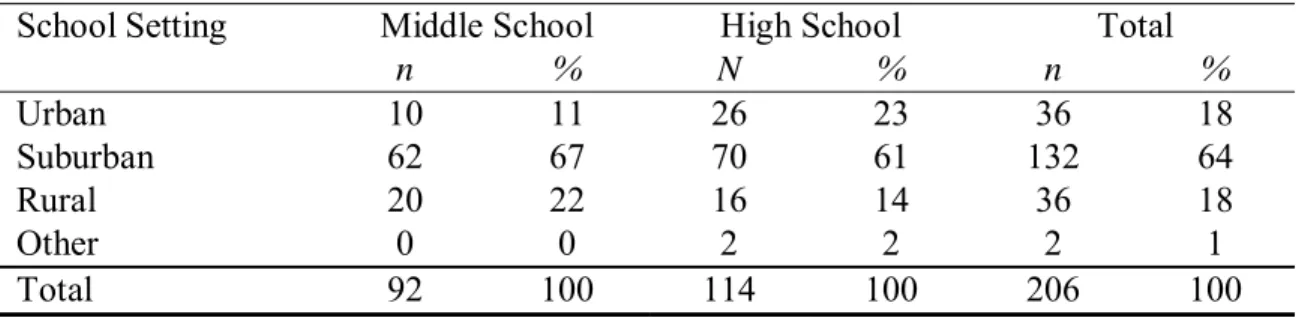
Teachers’ Primary Place of Work...102 Table 4.4: Distribution of Frequencies and Percentages for Central Ohio Social Studies
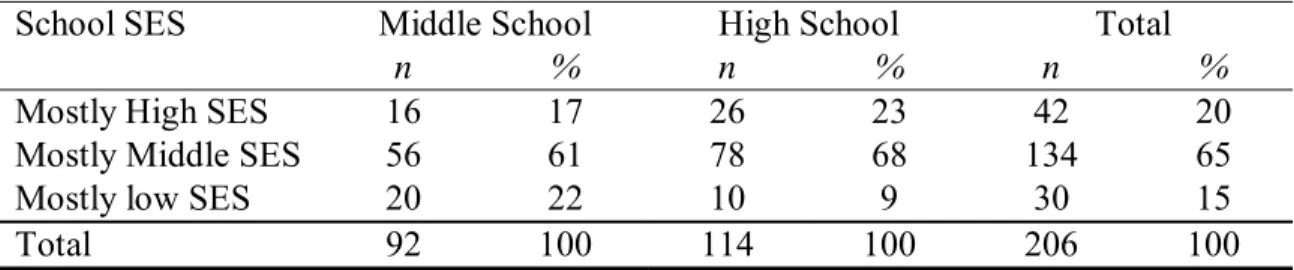
Teachers’ School Setting...103 Table 4.5: Distribution of Frequencies and Percentages for School SES of Central Ohio
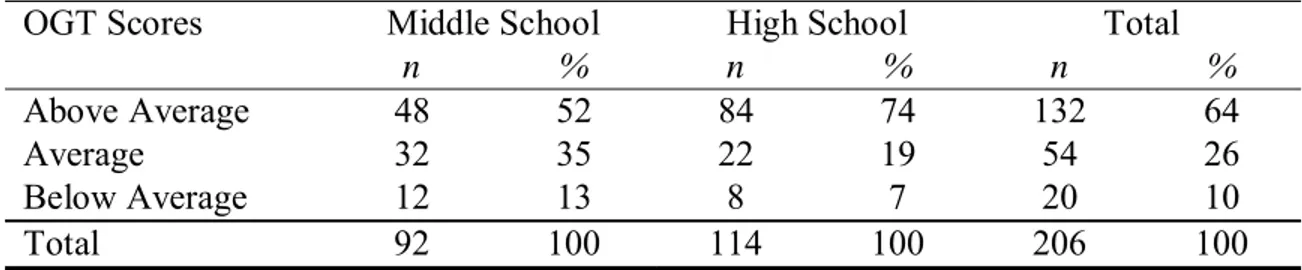
Social Studies Teachers ...104 Table 4.6: Distribution of Frequencies and Percentages of the OGT Scores for Central
Ohio Social Studies Teachers’ Schools ...106 Table 4.7: Distribution of Frequencies and Percentages for Central Ohio Social Studies
Teachers’ Grade Level(s) Currently Taught ...107 Table 4.8: Distribution of Frequencies and Percentages for Central Ohio Social Studies
Teachers’ Licensure Area(s) ...109 Table 4.9: Distribution of Frequencies and Percentages for Central Ohio Social Studies
Teachers’ Highest Academic Degree Completed...110 Table 4.10: Distribution of Frequencies and Percentages for Central Ohio Social Studies
Teachers’ Number of Years of Teaching ...112 Table 4.11: Distribution of Frequencies and Percentages for Central Ohio Social Studies
Teachers’ Number of College-Level Geography Courses Taken ...113 Table 4.12: Distribution of Frequencies and Percentages for Courses Currently Taught by
xv
Table 4.13: Distribution of Frequencies and Percentages for Time Devoted to Teaching Geography ...117 Table 4.14: Ranking Order of Social Studies Content Areas Based on Their Emphasis on
the OGT...118 Table 4.15: Distribution of Frequencies and Percentages for Average Time Spent on
Teaching Geography in a Quarter (Nine Weeks) ...119 Table 4.16: Distribution of Frequencies and Percentages of Change in the Amount of
Time Allocated for Particular Curriculum Items Following the OGT ...121 Table 4.17: Distribution of Frequencies and Percentages of Change in the Amount of
Time Allocated for In-Class Assessments Following the OGT ...123 Table 4.18: Distribution of Frequencies and Percentages of Change in the Amount of
Time Allocated for In-Class Activities Following the OGT...124 Table 4.19: Distribution of Frequencies and Percentages of Change in the Amount of
Time Allocated for Skills Following the OGT...126 Table 4.20: Distribution of Frequencies and Percentages of Change in the Use of
Teaching Resources Following the OGT...129 Table 4.21: Distribution of Frequencies and Percentages of Change in Geography
Content Following the OGT...132 Table 4.22: Distribution of Frequencies and Percentages of Social Studies Teachers’
Statements about Geography...135 Table 4.23: Distribution of Frequencies and Percentages for Secondary Social Studies
Teachers’ Familiarity with Selected Publications on Social Studies and Geography Education...137 Table 4.24: Distribution of Frequencies and Percentages for Secondary Social Studies
Teachers’ Incorporation of Selected Publications into the Social Studies Curriculum ...138 Table 4.25: Distribution of Frequencies and Percentages of Social Studies Teachers’
Statements about OGT Preparation ...141 Table 4.26: Distribution of Frequencies and Percentages of Social Studies Teachers’
Statements about OGT Pressure ...143 Table 4.27: Distribution of Frequencies and Percentages of Social Studies Teachers’
xvi
LIST OF FIGURES
Figure Page
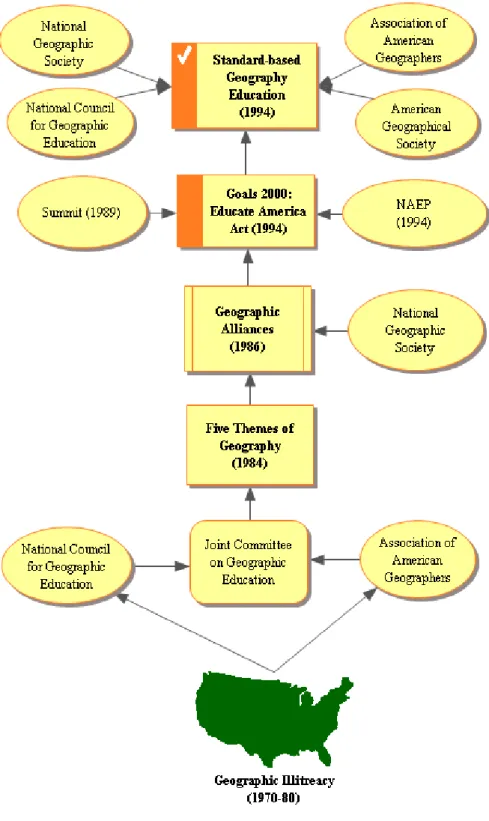
Figure 2.1: The progress of geographic renaissance in the Unites States ...57
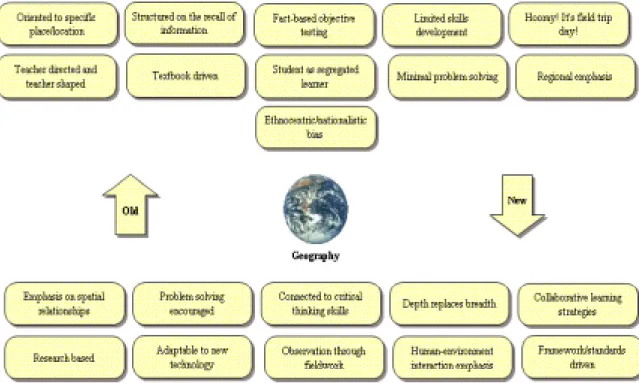
Figure 2.2: Old geography versus new geography...61
Figure 2.3: Geography education ...64
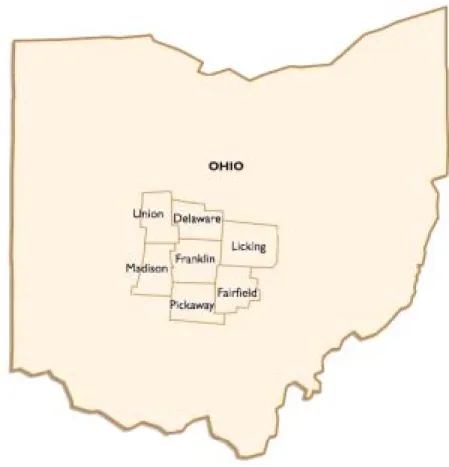
Figure 3.1: Research population map showing the counties of central Ohio included in the study...88
Figure 4.1: A bar graph of social studies teachers’ gender...100
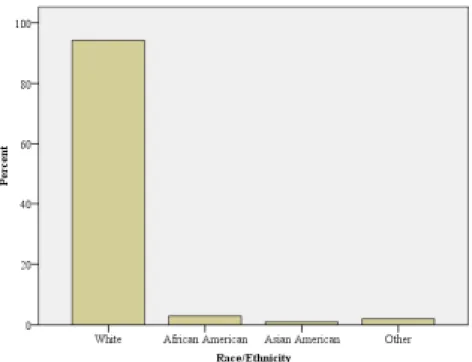
Figure 4.2: A bar graph of social studies teachers’ race/ethnicity ...101
Figure 4.3: A bar graph of social studies teachers’ primary place of work...103
Figure 4.4: A bar graph of social studies teachers’ school setting ...104
Figure 4.5: A bar graph of social studies teachers’ school SES...105
Figure 4.6: A bar graph of the OGT scores for social studies teachers’ schools. ...107
Figure 4.7: A bar graph of social studies teachers’ grade levels currently taught ...108
Figure 4.8: A bar graph of social studies teachers’ licensure ...110
Figure 4.9: A bar graph of social studies teachers’ highest degree completed...111
Figure 4.10: A bar graph of social studies teachers’ experience...113
Figure 4.11: A bar graph of social studies teachers’ number of college level geography courses taken ...114
1
CHAPTER 1
INTRODUCTION
“We are entering the age of the infinite examination and of compulsory objectification.” (Foucault, 1995, p. 189)
The year of 1957 interestingly marks a turning point in American educational history: the successful lunch of the Sputnik—the orbiting Soviet satellite—by the former Soviets in the race for space. For many Americans, this meant that progressive education had failed the American public, leading to an educational reform movement in the United States with a focus on math and science by the U. S. Government at the national level (Dynneson, Gross, & Berson, 2003 & Marschhausen, 2006). In other words, in response to Sputnik, the federal government organized education reforms under the support of the National Science Foundation and the National Defense Education Act, providing funds that spawned the development of innovative curriculum proposals and experimental curriculum designs in order to reform the traditional curricula of the schools (Dynneson, Gross, & Berson, 2003). However, education then became a priority and focus, marking a historical period when how and what was being taught in schools was questioned by politicians (Marschhausen, 2006). Education thus became a political issue. Therefore, over the past decades, public schools in the United States have increasingly experienced an “accountability movement.” That is, policymakers at the federal, state and local levels
2
have worked to increase accountability in the U.S. education system by measuring student performance and raising standards as they believed that if schools raised the expectations for all students by setting rigorous standards, then learning and achievement would increase (Heubert & Hauser, 1999).
Another main phenomenon that pushed the high-stakes testing movement further was the release of the 1983 report, “A Nation at Risk,” by the Reagan administration. In this report the state of American schools was presented as in a massive educational decline in comparison to the other economically well-developed countries such as Germany and Japan (NCEE, 1983). The major argument in A Nation at Risk was that the future economic well-being of the country was linked to the educational performance of the nation’s schoolchildren and their relative standing among students from other nations (Kornhaber & Orfield, 2001). It was therefore assumed that “if the U.S. raised its
educational performance, its economic performance would also rise” (p. 6). Following the publication of this report many states across the U.S. initiated comprehensive educational reforms that heavily emphasized widespread standardized testing.
Consequently, testing was seen as a way to impose standards on schools and students and hold them accountable for achieving higher results (Kornhaber & Orfield, 2001).
More recently, with the passage of the No Child Left Behind Act of 2001, which emphasized the idea of preparing young adults who can compete with the rest of the world in the global marketplace of ideas and talent, this accountability movement gained more speed. States were required to close the achievement gap and make sure that all students—including the disadvantaged—achieve academic proficiency (NCLB, 2001).
3
Education, consequently, turned to scientific methods of measurement to attempt to be in charge of what students were learning in schools (Marschhausen, 2006).
As the opening quote from Foucault (1995) clearly indicates, “today’s widespread implementation of standards-based reform and the federal government’s commitment to test-based accountability ensure that testing will remain a central issue in education for the foreseeable future” of American Education (Abrams & Madaus, 2003, p. 31). As a result, in the 1980’s and 1990’s, many states—including Ohio— mandated the
development of minimum competency standards and required that proficiency tests be administered at various grades levels. For instance, in March of 2005, starting with the graduating class of 2007, the State of Ohio replaced the Ninth-Grade Proficiency Test with the new Ohio Graduation Test to ensure that students were armed with the knowledge they need in this global economy to be successful in the work force and higher education (OGT Guide, 2007). Therefore, in order to contribute to such a vital educational reform in Ohio, the present research explores the impact of the Ohio Graduation Test (OGT) on geography instruction, from the perspectives of secondary social studies teachers in central Ohio.
Background of the Study
High-stakes testing, which refers to state-mandated standardized assessments or testing programs for all school districts with serious consequences for students, educators and schools, became and continues to be a tool for reforming curriculum and instruction (Paris & Urdan, 2000). Along with the standards-based reform movement in the USA, the State of Ohio first developed new educational standards and later set the requirements for
4
high school graduation. The public schools of Ohio are currently subject to a high-stakes accountability program known as the Ohio Graduation Test (OGT).
The federal legislation, and the significant dollars tied to NCLB, has pushed Ohio to act, resulting in the creation of Academic Content Standards in all core subject areas— Math, Language Arts, Social Studies, and Science—as well as a series of assessments which are based on these content standards (Marschhausen, 2006). The OGT thus measures student achievement in Ohio’s new standards. In addition, the OGT serves to meet the 10th grade assessment requirements of the No Child Left Behind Act (NCLB) as well as providing an exit exam for Ohio. Whereas NCLB only requires that math, reading and science (added in 2007) be assessed at present, the OGT also assesses writing and social studies. Basically, the OGT is a “high-stakes” test for both students and schools, with rewards and sanctions attached to it. For students, it is a requirement to be able to graduate from high school by passing all five sections of the OGT, whereas for schools the students’ performance on the OGT serves as the basis for five indicators on the school report card. It is the performance on the State Report Card that determines funding levels, requirements for improvement planning, and public perception regarding the school (Marschhausen, 2006). If a school district fails to perform at satisfactory levels for three consecutive years, the state may then require substantial actions by the school district. A district performing poorly over time may even be taken over by the Department of Education.
Hence, the OGT became a key state reform that has made a major impact on curriculum, instruction, assessment, and school personnel throughout Ohio. The OGT for Ohio is not just a test. It is, according to Rochford (2004), “a political tool meant to
5
accomplish the state’s objectives in determining whether or not students meet state curriculum requirements and pass all tests associated with graduation in order to earn an Ohio high school diploma (p. 56). In this sense, “high stakes exit exams in their current form are not about students. Students, to be sure, must take the tests and suffer the consequences, but the tests are about quantifying school reform and about justifying the expense of education” (Rochford, 2004, p. 56-57). “Ironically, the key lever in this standards-based reform strategy—the use of high-stakes external tests—has unwittingly provided teachers with a rationalization for avoiding or minimizing the need to teach well; that is, to teach for in-depth understanding” (Wiggins & McTighe, 2006, p. 303). Therefore, according to Paris & Urdan (2000), high-stakes tests provide a partial, at best, and distorted, at worst, view of the quality of education in schools and their side effects may actually inhibit effective teaching and erode teachers’ morale.
Moreover, surveys of teachers around the United States reveal that many teachers are anxious about the high-stakes tests as they have such a great influence on the
curriculum and many are concerned that tests are used against them to judge the quality of teaching and learning (Paris & Urdan, 2000). That is why teachers are more involved in high-stakes testing. The test scores also are visible public records of their students, becoming public comparative measures of teacher and school effectiveness (Paris & Urdan, 2000). This makes teachers anxious about high-stakes tests, becoming more involved as they are supposed to be responsible for improving test scores. Likewise, McCain (2005) states that “due to increased importance placed on student performance on these tests, teachers modify their teaching practices to ensure they are covering the materials that will be tested—which is assuring for those in charge of the system and for
6
those who have to pay for it” (as cited in Marschhausen, 2006, p. 25). As a result, as Marschhausen (2006) points out, there are apparent concerns in the education community with the emphasis placed on standardized tests. That is, “state-mandated tests do matter and do influence what teachers say and do in their classrooms” (Cimbricz, 2002, p. 5). However, “the influence state-mandated testing has (or not) on teachers and teaching would seem to depend on how teachers interpret state testing and use it to guide their action” (Cimbricz, 2002, p. 16). In addition, state testing as well as particular
characteristics that teachers possess, such as educational background, teaching
experience, gender, coursework taught, and school characteristics, influence how teachers interpret the state-mandated testing.
Therefore, this study in general attempts to address the interaction between the stakes attached to the state test results and perceived impacts on teaching and learning. In particular, this study focuses on how social studies teachers perceive the effects of a state-wide testing program (OGT), specifically in the area of teaching and learning geography. For a better grasp of the background of the study, it is essential to set the stage by briefly looking at (a) the No Child Left Behind Act, (b) the new Ohio Social Studies Standards as well as describing (c) the Ohio Graduation Test, followed by (d) an overview of geography education in the United States.
No Child Left Behind (NCLB)
The renewal of the Elementary and Secondary Education Act in 2001 as education reform legislation has come to be known as No Child Left Behind. Briefly, NCLB refers to a federal legislation passed in 2001 which requires states to have academic standards and a statewide assessment system to measure student achievement
7
and school effectiveness. As its name indicates, the NCLB aims at closing the
achievement gap among all children regardless of their race, class, ethnicity, disability status and limited English proficiency, and attaches high-stakes consequences to the assessment outcomes (NCLB, 2001).
The Act sets forceful provisions on using state-mandated assessments to hold schools accountable for their students’ attainment of prescribed performance standards. For example, in order to inform parents and community about state and school progress, states must produce annual state and school district report cards. If schools do not make adequate yearly progress, they then have to take corrective actions or otherwise face serious consequences. Although a majority of educators and many researchers oppose the legislation, the Act actually gained overwhelming political and public support, and
mandatory state assessment programs have come to dominate the public school landscape today (Wang, Beckett, & Brown, 2006; Hamilton, Stecher, & Klein, 2002). In fact, the NCLB expands the role of high-stakes testing by legislating their incorporation into states’ school accountability programs, such as the OGT.
The New Ohio Social Studies Academic Content Standards
In December 2002, the State of Ohio adopted “new” social studies content standards for all grades (K-12). The basic philosophy of Ohio’s social studies academic content standards, in the context of a standards-based curriculum, is the belief that
“effective social studies integrates history, geography, economics, political science, other social sciences and humanities in order to prepare students to be participating citizens” (ODE, 2002, p. 24). That is, social studies thus becomes an integrated subject matter in schools. Basically, Ohio’s social studies content standards serve as a basis for what all
8
students should know and be able to do by the time they graduate from high school. The social studies content standards are intended to provide a set of clear and rigorous expectations for all students. Ohio’s social studies content standards consist of seven standards, which clearly define a balanced program of knowledge and skills necessary for active citizenship (ODE, 2002):
1. History
2. People in Societies 3. Geography
4. Economics 5. Government
6. Citizenship Rights and Responsibilities 7. Social Studies Skills and Methods.
In Ohio’s K-12 social studies, students learn knowledge and skills from each of these seven standards at every grade, but the content emphasis varies from grade to grade. For example, the emphasis on geography is greatest in grades five and six and the
emphasis on history is greatest in grades seven through ten.
Unlike Ohio’s previous Model Competency Based Program, the new Ohio social studies content standards include a separate strand on geography. Yet, geography is not seen as a stand-alone subject; rather, it is taught interdisciplinarily with history and other social sciences within the Ohio social studies curricula. Principally, the goal of the geography strand in the new Ohio social studies content standards is to have students be able to “use knowledge of geographic locations, patterns and processes to show the interrelationship between the physical environment and human activity, and to explain
9
the interactions that occur in an increasingly interdependent world” (ODE, 2002, p. 12). Moreover, the new Ohio social studies content standards largely use the national social studies standards as its framework, with respect to other individual subjects that comprise social studies such as history and geography. While the first (Culture, referring to People in Societies), second (Time, Continuity and Change, referring to History) and seventh (Production, Distribution, and Consumption, referring to Economics) are partially addressed, the third (People, Places, and Environments, referring to Geography), eighth (Science, Technology, and Society), and ninth (Global Connections) of the national social studies standards are fully addressed in the geography strand of the new Ohio social studies content standards. As identified in the “social studies curricular model” of Bednarz, Downs, & Vender (2003), geography thus becomes a part of the integrated social studies taught across grade levels by sharing time in a crowded curriculum with history, economics, political science, and other social sciences.
Grades Five, Geography of North America, and Six, World Geography, in Ohio’s integrated K-12 social studies curricula focus particularly on geography as a school subject. Yet, it also seems that the explicit teaching of geography is restricted largely to grades five and six, while an emphasis in geography disappears in high school.
The basic themes around which the geography strand is organized across the grade levels are Location, Places and Regions, Human Environmental Interaction, Movement, and Application of Geography. The teaching of geography in Ohio K-12 social studies curricula progresses from simple to complex, such as home, community, state, nation, and the world. While the early grades (K-5) focus on the introduction of basic geographic concepts, map skills and geography of North America, the middle
10
grades (6-8) center around the themes of location, place, regions, human and environment interaction, movement and world geography. Hence, the upper grades (9-12) focus on identifying and analyzing patterns and processes of geographic knowledge and
application of geographic knowledge to life. As a result, not necessarily in practice but at least in theory, it seems that the new Ohio social studies standards try to cover geography as a complete and discrete discipline. The content of geography in the new Ohio social studies standards is explicitly organized around the elements, skills, and perspectives of the National Geography Standards (Geography for Life 1994), which defined what students should know and be able to do in geography at the conclusion of grades, four, eight, and twelve.
The New Ohio Graduation Test (OGT)
The Ohio Graduation Tests are the new tests that students must pass in order to earn an Ohio high school diploma. They replaced the Ninth-Grade Proficiency Tests starting with the graduating class of 2007 (OGT Guide, 2007 & ODE, 2004).
The OGT is a key part of Ohio’s educational reform to establish an aligned system of standards, assessments and accountability for Ohio schools. The testing requirements were established by the Ohio General Assembly in 2001 based on recommendations by the Governor’s Commission for Student Success (OGT Guide, 2007). The new tests are aligned to Ohio’s new academic content standards, which were adopted by the State Board of Education in English Language Arts, Mathematics, Science and Social Studies. The OGT also meets the requirements of the federal law for high school testing (ODE, 2004).
11
For the first time, sophomores in March 2005 (graduating class of 2007) took the OGT and were required to pass all five tests as a graduation requirement. The OGT measures knowledge and skills as articulated in Ohio’s academic content standards by the end of 10th grade in five content areas: reading, writing, mathematics, science and social studies.
Classroom teachers and other educators, parents, representatives of the business community and other citizens are involved with Ohio Department of Education staff and its testing contractor in developing test items for the OGT. Also, two different
committees, the Content Advisory Committee and the Fairness Sensitivity Review Committee, comprised of parents, educators and others, review all test questions to ensure that they are appropriate and not biased in any way.
Students have multiple opportunities to take the tests during their high school careers. Students take the OGT for the first time in the spring of their sophomore year (10th grade). They may retake the tests in the fall and spring of their junior and senior years and during the summer. Students who do not pass one or more sections on their first attempt will retake the tests they need to pass during their junior and senior years.
Students may graduate and receive a diploma without passing all five tests of the OGT if they meet the following requirements (OGT Guide, 2007):
• Pass four of the five tests and have missed the fifth test by no more than 10 points;
• Have had a 97 percent attendance rate through all four years of high school and must not have had an expulsion in high school;
12
• Have a grade point average of 2.5 out of 4.0 in the subject area missed and have completed the curriculum requirements in the subject area missed;
• Have participated in any intervention programs offered by the school and must have had a 97 percent attendance rate in such a program offered outside the normal school day; and
• Obtain letters of recommendations from each teacher in the subject area not yet passed.
The OGT for social studies is aligned with Ohio’s Academic Content Standards: K-12 Social Studies, using the 20 benchmarks for grades nine and ten. The benchmarks define the content and skills to be assessed. The content emphasis reflects the scope and sequence of the content standards for two grades. Grade Nine focuses on ‘World Studies from 1750 to the Present,” and Grade Ten focuses on “United States Studies from 1877 to the Present.” An example of concepts and skills assessed by the OGT in social studies for the geography benchmark would be:
• Using maps and geographic data to analyze changes brought by human activity, and
• Analyzing the characteristics used to define geographic regions (OGT Guide, 2007).
For each test administration, students are assessed in all seven areas of the social studies content standards. However, although there are seven academic content standards in social studies, for reporting purposes the standards are categorized as follows (ODE, 2004):
13 • History
• People in Societies and Geography
• Economics, Government, and Citizenship Rights and Responsibilities • Social Studies Skills and Methods
On each form of the test, all standard categories will be assessed with multiple-choice items and one short-answer item. The History Standard category will have one of the two extended-response items. The second extended-response item will be used to assess content under the People in Societies and Geography or the Economics,
Government and Citizenship Rights and Responsibilities category. The Social Studies Skills and Methods standard category will not be assessed with an extended-response item.
As a result, it seems that a new wave of the accountability movement in American education is speeding up with consequences for individual states including Ohio. Because of this current movement toward judging Ohio’s schools based solely on their students’ performance on the state mandated “high-stakes” graduation test, it is crucial that a study be conducted on how this test impacts geography instruction as perceived by secondary social studies teachers in Ohio.
Geography Education in the United States
Geography has been part of American education since the 17th century. Yet, over the years, the history of geography has witnessed great changes in terms of its role in the school curricula. After the 1960s, professional geographers as well as geography
educators became concerned with the declining status of geography in American education as media and educational reports were indicating the embarrassingly poor
14
geography knowledge of American students. Therefore, geography educators have always been concerned with improving the status of geography especially in the social studies curriculum in American schools.
As a result of this geographic illiteracy, the United States has experienced a renaissance in geographic education during the past two decades. The recognition of geography as one of the core subjects in the school curricula in Goals 2000 became an important point of time in these reform movements. However, it was not until the early 1990s during which the true renaissance of geography occurred, as educators witnessed the development of the National Geography Standards designed to initiate a grassroots movement for curricula change as a consensus project including all the major players in geographic education.
Defining geography as the “why of where,” Shearer (2003) states that geography is a powerful perspective for examining and understanding our world’s people and places. Although there is no single definition, Taaffe (1974) defines geography through the “three traditions:” (1) the spatial view, stressing maps and spatial analysis; (2) the area study view, stressing synthesis, integration, and concern with place; (3) the man-land or ecological view, stressing relations between man and the natural environment.
Geography thus becomes an integrative discipline that brings together the physical and human dimensions of the world in the study of people, places, and environments (GESP, 1994). Accordingly, geography has historically played a vital role in “citizenship
education” in the United States (Bednarz, 2003a; Harper, 1990; Harper, 1992; James, 1990; Marran, 2003; Stoltman, 1990). Therefore, geography becomes an essential school subject (Marran, 2003) as geographically literate citizens are aware of (1) what is
15
happening in the world, (2) why it is happening, and (3) how it affects other people throughout the world as well as themselves (Stoltman, 1990).
During the last two decades, geography education in the United States has undergone a renaissance to improve the quantity and quality of geography taught in American schools (Bednarz, 2002; Bednarz, Downs, & Vender, 2003; Bettis, 1996; Gandy & Kruger, 2004; Gritzner, 1990; Grosvenor, 1995; Kenreich, 2004; Murphy, 1998; Rediscovering Geography Committee, 1997; Stoltman, 1991; Stoltman & Wardley, 1997). The reason was the geographic illiteracy that was evident on the part of American students in the 1970s and 1980s (Kenreich, 2004; Murphy, 1998; Petersen et al., 1994) during which geography almost disappeared from the K-12 curriculum although it was once a mainstay of the curriculum in the United States (Black, 1996). Upon the
recognition of geography as one of the core subjects in the school curricula in Goals 2000 (Bednarz, 2002; Bednarz, Downs, & Vender, 2003; Bednarz & Petersen, 1994;
Grosvenor, 1995; Schoenfeldt, 2001; Stoltman & Wardley, 1997; Wilbanks, 1994), the publication and release of the national geography standards, Geography for Life 1994, was widely accepted and distributed across the U.S., and became a cornerstone in the history of school geography (Bednarz, 2002; Bednarz, Downs, & Vender, 2003; Bettis, 1996; Grosvenor, 1995; Kenreich, 2004; Schoenfeldt, 2001; Stoltman & Wardley, 1997).
Briefly, Geography for Life defined what students should know and be able to do in geography at the conclusion of grades, four, eight, and twelve. Geography for Life aimed at creating a geographically informed person who understands people, places, and environments from a spatial perspective, someone who appreciates the interdependent worlds in which we all live (GESP, 1994). As a result, geography as a school subject
16
experienced a shift in its pedagogy as it has traditionally been viewed as a place-naming subject, locating historical events but bearing little relationship to the discipline of geography. Therefore, the “new” geography revealed in the standards emphasized the essential nature of the discipline as an integrative and systematic approach to the places, people, and environments of the world (Marran, 1994).
Unlike traditional geography which emphasized the memorization of place names with no real geography in nature (Rossi, 1999), the new geography revealed in
Geography for Life places a strong emphasis on learning to think geographically (Bednarz, 2003). Geography is thus presented as an exceptional discipline with two unique perspectives: (1) the spatial perspective, centering on location and understanding of whereness; and (2) the ecological perspective, considering how humans interact with their physical environment (GESP, 1994). Location has traditionally been an essential component of the geographic perspective; however, to a geographer location is more than just “where;” it is also “why” and “how” and “so what” (Bednarz, 1997). Teachers and students are thus urged to view geography as an approach, a point of view, and a frame of reference (Bednarz, 2003) for asking geographic questions, acquiring, organizing, and analyzing geographic information to answer geographic questions (GESP, 1994).
In addition, it seems that geography has infinite potential for integration across the curriculum. Geography as a discipline uniquely links both natural and social sciences (Taaffe, 1974) by revealing the relationship between people and the environment. In other words, geography also shares an interface with all other social sciences, such as historical geography vs. history, economic geography vs. economics, cultural geography vs. anthropology, social geography vs. sociology, population geography vs. demography,
17
and behavioral geography vs. psychology (Gritzner, 1990). Besides, in some respects, the educational goals of geography and social studies are strikingly similar as both fields connect in many ways (Gritzner, 1990). For example, students in secondary schools are able to apply geographic understanding across a broad range of fields, including the fine arts, sciences, and humanities. Geographic concepts thus become central to learners’ comprehension of global connections as they expand their knowledge of a diversity of historical and contemporary cultures (NCSS, 1994). Therefore, as it seems that
geography lends itself so readily to integration and lacks a separate status in school curricula, it is crucial to integrate geography with other subjects in social studies and across the existing school curricula. Indeed, within the social studies curriculum history and geography complement one another and are taught best together (Bednarz, 1997; Rossi, 1999). As a result, especially today with increasing globalization, geography should be part of every historical study and every study of regions, cultures, international relations and global issues. In fact, as a broad and integrative subject matter, geography can lead students to a better knowledge of themselves and their place in the world through a geographic, spatial perspective that is unavailable elsewhere in the curriculum (Gregg & Leinhardt, 1994).
Furthermore, since the national geography standards have now existed for a decade, one might ask how much those standards have been implemented into state standards and classrooms. Yet, according to very limited research, it seems that
translation of Geography for Life to state standards has produced uneven patterns because geography was considered a single subject in some states, but integrated into social studies in others (Bednarz, 1998; Munroe & Smith, 1998). This means that “despite
18
national standards, states still play a large role in shaping geographic education”
(Bednarz, 1998, p. 87). In line with this, many states across the nation have revised their curricula to move to standards-based education, although the adoption of the national geography standards was voluntary (Bednarz, Downs, & Vender, 2003). The State of Ohio adopted “new” social studies content standards with a separate geography strand for all grades (K-12) in December 2002. For an effective K-12 social studies, Ohio’s social studies academic content standards integrated history, geography, economics, political science, other social sciences and humanities in order to prepare students to be
participating citizens (ODE, 2002). The geography strand principally aimed at showing the interrelationship between the physical environment and human activity, and to explain the interactions that occur in an increasingly interdependent world, by using knowledge of geographic locations, patterns and processes (ODE, 2002).
Purpose of the Study and Research Questions
The purpose of this study is to explore how social studies teachers perceive the impact of the Ohio Graduation Test (OGT) on geography instruction in secondary schools of central Ohio. Specifically, the major research question of the study is as follows:
From the perspectives of social studies teachers in secondary schools of central Ohio, what has been the effect of the Ohio Graduation Test (OGT) on geography instruction?
In addition to the above main research question, the following are the five sub-questions that provide more in-depth focus to the study.
19
1. The research literature in general indicates that high stakes testing has had an impact on the amount of time teachers spend with their subjects in the curriculum. How has the time devoted to teaching geography changed since the
implementation of the OGT?
2. In what ways, if any, have the curriculum and the instructional strategies used by social studies teachers who are teaching geography changed due to the
implementation of the OGT?
3. How has the use of teaching materials changed due to the implementation of the OGT?
4. How has the emphasis of particular geographic concepts/topics changed following the implementation of the OGT?
5. What are the teachers’ perceptions about geography and the impact of the OGT on teaching and learning?
Significance and Context of the Study
The standards-based reform movement during the last decade gave a substantial rise to the state-level accountability systems in the United States (Abrams & Madaus, 2003). This movement also pushed the national disciplinary organizations, such as the National Council for the Social Studies (NCSS), to develop curriculum standards to redefine standards of excellence in the discipline and to redirect the goals of instruction (Taylor, Shepard, Kinner & Rosenthal, 2003). This politically motivated movement later turned into a huge reality as a tool to restructure the American schools: state-mandated standardized testing (Heubert & Hauser, 1999).
20
Although there is a significant body of research on standardized testing, very little focuses specifically on state-mandated graduation testing (i.e., Achieve, 2004; Rochford, 2004; McDermont, 2001; Schiller & Muller, 2000; Heubert & hauser, 1999; Bond & King, 1995; and Catterall, 1989). Again, literature cites considerable research on high-stakes testing in general (i.e., Casbarro, 2005; Diamond & Spillane, 2004; Greene, Winters, & Forster, 2004; Urrieta, 2004; Abrams & Madaus, 2003; Goertz & Duffy, 2003; Gulek, 2003; Gunzenhauser, 2003; Horn, 2003; and Sloane & Kelly, 2003); however, few empirical studies concentrate exclusively on the impact of high-stakes testing on teachers (see, for example, Louis & Schroeder, 2004; Rex & Nelson, 2004; Abrams, Pedulla & Madaus, 2003; Taylor, Shepard, Kinner & Rosenthal, 2003; Grant, 1999 & 2000; Jones et al., 1999; McMillan, Myran and Workman, 1999; Herman & Golan, 1991; and Smith, 1991 ).
When the existing related literature is examined, one easily discovers—as Cimbricz (2002) and Grant (2001, 2000, and 1999) found out— the three aspects of this literature:
• The existing literature is clearly contradictory;
• The bulk of the research is theoretical rather than empirical in nature; and
• Much of the research focused more on the relationship between state-mandated or high-stakes testing and students, not teachers.
Therefore, even though it seems that there is a body of research out there, in fact only a handful of studies specifically exploring teachers’ perceptions of state-mandated high-stakes testing were found. In other words, there is little empirical evidence to suggest how teachers, especially those with different characteristics such as educational
21
background, teaching experience and school setting, respond to changes in
state-mandated tests. Educational accountability, recently fueled by the No Child Left Behind Act, is a particularly hot topic in educational circles today, yet there is surprisingly little research which digs deeply into teachers’ understanding of the import of state-mandated standardized testing (Grant, 1999).
Grant (1999) claims that “many current initiatives seek to raise educational standards and improve student academic performance, yet there is a curious gap in the recent talk about the national and state reforms” (p. 2). That is, he continuous, little attention is given to how teachers should respond to the recent changes in current
accountability systems “while much attention focuses on defining higher expectations for what students will know and be able to do” (p. 2). Grant (1999) also claims that “testing drives much of what teachers do, and so curricular and instructional change will occur if and when state tests change;” that is, “change the test and one changes teachers’
practices” (p. 2). Likewise, many researchers assert that the context of high-stakes testing creates conflicts between what teachers believe is best practice and how they address accountability pressure in real time (Brimijoin, 2005; Abrams, Pedulla & Madaus, 2003; Paris & Urdan, 2000; Grant, 1999; Jones et al., 1999; McMillan, Myran & Workman, 1999; Herman & Golan, 1991; and Smith, 1991). However, regardless of one’s position pro or con in such a debate, it becomes apparent that teachers and their in-class practices are seen to be the central intervening factor which would determine the impact of
standards-based reforms on student learning (Taylor, Shepard, Kinner & Rosenthal, 2003).
22
Consequently, based on the review of the literature in the area of state-mandated high-stakes testing, it is obvious that although the degree and direction of influences are ambiguous, a relationship between state testing and teachers and their beliefs and practices does exist. On the other hand, very little is known about teachers’ perceptions and practices regarding the Ohio Graduation Test (OGT) in social studies. Also, there is no recent study found regarding the impact of the OGT on geography instruction in secondary schools of Ohio. Even less is known about how various factors such as educational background, school characteristics and teacher experiences might influence perceptions and practices of social studies teachers about the issues discussed. Because it has significant implications for educational leaders and policy makers, it is therefore crucial to investigate the perceptions of teachers and how they respond to changes as they are at the center of high-stakes. Therefore, in order to “reduce the conflict between testing every student and teaching every student” (Brimijoin, 2005, p. 260) in Ohio’s schools, this study is carried out with the intention of shedding some light on this ambiguous area of the existing literature. This study, therefore, will add primarily to the current literature on geography education and secondarily to the “high-stakes” testing by exploring the perceived influences of such a high-stakes testing program that Ohio’s schools face today: The Ohio Graduation Test (OGT).
Overview of the Methodology
This study was designed to explore the impact of the Ohio Graduation Test (OGT) on geography instruction as it was perceived by social studies teachers who are currently teaching in secondary schools of central Ohio. My interest in geography education as a social studies educator as well as the “new” phenomenon in an already
23
existing high-stakes testing environment in Ohio—the OGT—dictated the selection of such a topic as my dissertation study.
Research Method
In order to answer the central research question, this study carried out exploratory research that was designed through the utilization of quantitative methods. Among quantitative research approaches, a “survey design” was selected as it responded well to the needs and purposes for which this study was conducted. In this type of research design, the researcher administers a survey or questionnaire to a small group of people— called the sample—in order to describe the attitudes, opinions, behaviors or
characteristics of a large group of people—called the population (Creswell, 2005). That is, from the results of a sample, we can make generalizations or claims about the whole population to which the sample belongs. As emphasized by Creswell (2005), this
advantage of identifying attributes of a large population from a small group of individuals was the major reason behind the selection of such a research method.
Sampling
With regard to sampling, the population of this study consisted of all secondary social studies teachers who are currently teaching in the middle and high schools of central Ohio. However, here the geographic location “central Ohio” refers exclusively to Franklin County, which is the home of the greater Columbus and metropolitan area, and the other contiguous six counties (see Figure 3.1). The most important aspect of sampling is that the sample represents the population (Creswell, 2005; Fraenkel & Wallen, 2003). For the purposes of the study, the most frequently used sampling technique was therefore chosen: (simple) random sampling. That is, the sample was “randomly” selected so that
24
participants will have an equal probability of being selected from the population
(Creswell, 2005), which also helps remove bias on the part of the researcher and allows the researcher to employ probability sampling techniques (Nesbary, 2000).
The school data were requested from the Ohio Department of Education (ODE) and received in a Microsoft Excel sheet. According to the data received from the ODE, the total number of all secondary schools in central Ohio is 326, which includes all public, private, charter and parochial schools. Of these 163 schools were randomly selected by using Microsoft Excel and then 40 schools out of 163 were removed from the sample purposely due to an insufficient number of students. That leaves a total number of 123 schools included in the study, with a student population ranging from 250 to 2,400.
Instrumentation
In order to collect data for this study, a cross-sectional survey instrument as a measurement device was specifically developed, pilot-tested, and administered online to a sample of social studies teachers who are currently teaching in this group of 123
randomly selected secondary schools in central Ohio. First of all, the research instrument was constructed through a “content validity” approach based on expert opinion and then it was pilot tested with 51 individuals: three professors of education, one professor of geography, one professor of statistics, three doctoral students in education, and forty-three middle and high school social studies teachers from around Franklin county. Based on the expert feedback received from the pilot study, the survey instrument was re-constructed and then administered to the research subjects via the Internet. In order to gain access to the population, a support letter from the Ohio Geographic Alliance (OGA) was obtained. This letter encouraged social studies teachers to participate in the study by
25
indicating that this study would help and further the efforts of the OGA to expand geography education across the State of Ohio.
Data Collection
Once an “exemption” was granted by the Human Subjects Institutional Review Board (IRB) of The Ohio State University Research Foundation, an invitation letter on OSU letterhead, along with this support letter, was sent to social studies department chairs requesting their department’s participation. The mailing process was done twice as the second one was mailed out to the department chairs two weeks after from the first one. The form of data collection for this particular research involved creating a web-based or an Internet survey and administering it online. Prior to administration as recommended by Dillman, Smyth, & Christian (2009), the survey hosted by the web server of the College of Education and Human Ecology (EHE) at The Ohio State University was tested numerous times by using different platforms (like PC and Mac computers), connection speeds and browsers (like Internet Explorer, Mozilla Firefox, etc.). As suggested by Nesbary (2000), the web survey included an access password provided within the invitation letter and it also was posted to a hidden directory known only to the survey administrator and respondent. For security purposes again, the web survey was also set to an automatic shut off after a 5-minute inactivity and time expiration after a 15-minute session.
Data Analysis
After the data collection period ended, the online survey was closed to access and then the data gathered from respondents were downloaded from the web server to the survey administrator’s computer as an Excel file. The data collected were first scaled and
26
grouped according to research questions, and then exported to and run through SPSS 16.0. Given the central research question as well as research sub-questions, in addition to the Likert type items on the questionnaire, the basic quantitative data analysis technique utilized in this study is simple descriptive statistics. Since all the variables are categorical in nature, the frequency distributions of the responses were calculated between the
variables involved based on the research questions. This means that the results of the data analyses were presented through contingency tables. In addition, in order to
systematically display the demographic characteristics of respondents, bar graphs as “pictures of frequency distributions” (Sirkin, 1999, p. 101) were drawn by SPSS 16.0.
Definition of Terms
The following are the key terms that most frequently appear in this study and are essential to understanding what the study is about. In fact, many of those terms are inter-related. For a better understanding of the present study, therefore, those terms may need a conceptual clarification to some extent as they may have some other meanings not
intended in this study. In other words, rather than giving their dictionary meanings, I purposefully define the key terms by their operational definitions (Fraenkel & Wallen, 2003), clarifying what they mean specifically for the present study.
Accountability − Accountability refers to school accountability or accountability in education as part of a national movement towards standards-based school reform. That is, the accountability movement is associated with the standards movement—“a related development that has brought together various people who wish to maintain high
standards for school curricula and high expectations for the performance of all students” (Gunzenhauser, 2003, p. 53). The idea behind the school accountability is that public
27
education can be improved through a simple strategy: require all students to take “standardized tests” and attach “high stakes” to the tests in the forms of rewards when test scores improve and sanctions when they do not (Hamilton, Stecher, & Klein, 2002). During the past two decades, many states implemented educational accountability
systems, yet the re-authorization of the Elementary and Secondary Education Act of 2001 (the No Child Left Behind Act) made accountability a requirement for all 50 states. In the State of Ohio, the OGT serves to meet the 10th grade assessment requirements of the NCLB.
Geography − Geography as discipline is “the study of spatial distributions and space relations on the Earth’s surface” (Ad Hoc Committee on Geography 1965, p. 8). In other words, geography in essence is “the study of the Earth as the home of people” (Tuan, 1991, p. 99, as cited in Kenreich, 2000).
Geography education − Although some scholars would argue otherwise, for the purposes of this study, geography instruction and geographic or instruction refer to the same meanings. Essentially, geography education means teaching and learning
geographic concepts and skills, such as those included in Geography for Life: National Geography Standards (Geographic Education Standards Project (GESP), 1994).
High school graduation exam − Graduation exams are tests that are designed to determine if a student has retained the appropriate material (knowledge and skills) necessary in order to complete high school. Throughout the USA, many states, including Ohio, require their high school students to pass a comprehensive test to be able graduate. For instance, the OGT is a state-mandated high school graduation exam applied in the State of Ohio.
28
High-stakes testing − High-stakes testing in general refers to “state-mandated” standardized assessment or testing programs which are mandated by state legislatures or state boards of education for all school districts at selected grade levels carrying serious consequences for students, educators, and schools. In other words, high-stakes testing means the use of standardized testing measures as criteria for determining the quality of schools, promotion of students to the next grade, high school graduation, teacher bonuses or the governance of a school (Gunzenhauser, 2003). Like other standardized testing programs, high-stakes testing utilizes a single statewide testing instrument that is
administered, scored, and interpreted similarly from district to district according to state guidelines. If there are clear sanctions (i.e., grade retention, failure to graduate, loss of funding, labeling for poor performance) or rewards (i.e., promotion to next grade, graduation, teacher bonuses, school funding) associated with test performance, the test then becomes a “high-stakes” test, such as the OGT.
Perception − Perception basically is the “interpretation of the environment” (Ormrod, 2004, p. 237), and serves as a reference point for behavior (Purkey & Novak, 1996 as cited in Peters, 2002). In this present study, perception refers to “teacher
perceptions,” which means the particular beliefs teachers hold about themselves, others, and the teaching profession (Purkey & Novak, 1996 as cited in Peters, 2002). From the perceptual point of view, according to Peters (2002), one must make sense of how the person views oneself, others, and the world in order to understand human behavior. However, even though people develop perceptions that help them make sense of the world, perceptions can change over time as the person encounters new experiences (Peters, 2002). People thus modify their behavior based on their perceptions. For the
29
purposes of this study, through quantitative research methods, social studies teachers’ perceptions about the impact of the OGT on geography instruction as well as changes in their perceptions about the phenomenon over time will be analyzed.
Social studies − “Social studies is the study of humankind from a multitude of perspectives” (Dynneson, Gross, & Berson, 2003, p. 29). Engle & Ochoa (1988) emphasize social studies as education for democratic citizenship. They define social studies at three levels: (1) social studies as the social sciences simplified for pedagogical purposes; (2) social studies as the critical study of the social sciences; and (3) social studies as the examination of social problems. Likewise, the National Council for Social Studies (1994) defines it as follows:
Social studies is the integrated study of the social sciences and humanities to promote civic competence. Within the school program, social studies provides coordinated, systematic study drawing upon such disciplines as anthropology, archaeology, economics, geography, history, law, philosophy, political science, psychology, religion, and sociology, as well as appropriate content from the humanities, mathematics, and natural sciences. The primary purpose of social studies is to help young people develop the ability to make informed and reasoned decisions for the public good as citizens of a culturally diverse, democratic
society in an interdependent world (NCSS, 1994, p. 3).
Standardized testing − Standardized testing is a “state-mandated” assessment or testing program, including standards-based tests that are typically used for high-stakes purposes. Standardized assessments have indeed been a conspicuous part of the education reform landscape throughout American history (Wang, Beckett, & Brown, 2006). For the current study, standardized testing is defined as “a large scale, externally developed and mandated, uniformly administered and scored evaluation of student learning” (Wang, Beckett, & Brown, 2006, p. 307). This means that such assessment (a) is “externally imposed by the state government; (b) assesses state-prescribed content standards; (c)