by Elsevier. This article is free for everyone to access, download and
read.
Any restrictions on use, including any restrictions on further
reproduction and distribution, selling or licensing copies, or posting
to personal, institutional or third party websites are defined by the
user license specified on the article.
For more information regarding Elsevier's open access licenses
please visit:
Effects of an Essen ial Oil Mixture Added to
Drinking Water for Temperature-Stressed Broilers:
Performance, Meat Quality, and Thiobarbituric
Acid-Reactive Substances
E. Tekce
,
∗,1K. C
¸ ınar,
†B. Bayraktar,
‡C
¸ . Takma,
§and M. G ¨ul
#∗
Faculty of Applied Sciences, Bayburt University, Bayburt 69000, Turkey;
†Faculty of
Engıneerıng, Bayburt University, Bayburt 69000, Turkey;
‡Faculty of Health Scıences,
Bayburt University, Bayburt 69000, Turkey;
§Faculty of Agriculture, Department of Animal
Science, Biometry and Genetics Unit, Ege University, ˙Izmir 35100, Turkey; and
#Animal
Nutrition and Nutrition Disease, Atat¨urk University, Erzurum, Turkey
Primary Audience: Researchers, Broiler Breeder Companies, Nutritionists, Veterinarians
and Food ngineers
SUMMARY
This study investigated the effects of an essential oil mixture (EOM; Eucalyptus globulus
labill, Tymus vulgaris, Cymbopogon nardus, and Syzgium aromaticum) added to drinking water
on temperature-stressed broilers. The performance parameters (body weight, average daily
weight, feed intake, and feed conversion ratio), meat quality, and thiobarbituric acid-reactive
substances (TBARS) were evaluated. In a 42-d study, 400 Ross-308 male chickens (1-d-old)
were randomly assigned to 8 different groups (n
= 50), each containing 4 subgroups (n = 8)
(22
◦C Control (C), C
+ 250 mL/1,000 L, C + 500 mL/1,000 L, C + 750 mL/1,000 L), 36
◦C
(stress control (SC), SC
+ 250 mL/1,000 L, SC + 500 mL/1,000 L, SC + 750 mL/1,000 L).
Adding 750 mL/1,000 L at 22
◦C and 250 mL/1,000 L at 36
◦C was more beneficial to the
fattening performance parameters than those in the control group. EOM reduced liver weight
but increased abdominal fat in the SEOM-250 groups but did not affect other organ weights.
EOM had no effect on the TBARS or the b
∗color parameter while it augmented the a
∗and L
∗coordinates of meat color.
Key words: broiler, essential oil mixture, internal organ weight, TBARS
http://dx.doi.org/10.3382/japr/pfz030
DESCRIPTION OF THE PROBLEM
Stress causes physical and chemical changes
in an organism by affecting the homeostatic
balance of the organism [1]. One of the most
important stress factors in poultry breeding
1Corresponding author:Vet emre [email protected]
is temperature. An increase in the ambient
temperature of broilers above 35
◦C increases
mortality and morbidity rates [2]. To this end,
various feed additives have been used to prevent
stress in poultry and to increase the quantity and
quality of the products obtained. Antibiotics
have been used for this purpose for over 50 yr.
However, antibiotics are now banned from
2020 J. Appl. Poult. Res.
29:77–84
E
t
animal feeds by the European Union because
their misuse has led to resistant bacteria, which
has consequences on animal welfare,
environ-ment, food chain, and human health [3].
Conse-quently, research has begun to investigate new
alternative agents that may be helpful to regulate
the intestinal microflora in birds, increase
fat-tening performance, and protect animal health.
Numerous products have been used, but the
increase in consumer preference toward organic
products has increased interest in organic feed
additives [4,
5].
One of these alternative feed sources is
essen-tial fatty acid derived from plants with medical
and aromatic characteristics. These are volatile
fatty acids. It was reported that there was no
accumulation in the tissues of the animals, no
drug resistance, or no risk for human health
af-ter use [6]. Essential fatty acids have antioxidant
effects in monogastric animals [7,
8], as well
as anti-microbial [9–11], anti-inflammatory [12,
13], anti-viral [14,
15], tumoural [15],
anti-fungal [16,
17] and anti-parasitic [18,
19] effects.
In addition, it can be used as growth promoters
in poultry by stimulating endogenous digestive
secretions (enzymes, bile, and mucus) or by hold
on to the intestine to affect epithelial structure in
a beneficial way [20–22].
This
study
investigated
the
nutritional
benefits of an essential oil acidic mixture
(EOM) (Eucalyptus globulus labill, Thymus
vulgaris, Cymbopogon nardus, and Syzygium
aromaticum) added at different levels to the
drinking water of temperature-stressed broilers
(22 and 36
◦C, respectively). The animals’
perfor-mance (live weight, daily live weight gain, feed
consumption, and feed utilization rate), internal
organ weight, and breast meat quality (meat
color parameters and thiobarbituric acid-reactive
substances [TBARS] values) were investigated.
MATERIALS AND METHODS
Birds, Diets, and Management
Four hundred 1-d-old Ross-308 male
chick-ens were utilized in this study. The chickchick-ens were
held in a 110
× 110 × 100 cm pen at the
poul-try unit of the Bayburt University Food,
Agri-culture and Animal Husbandry Application and
Research Centre for 7 d of exercise and 35 d
of fattening. The control, EOM-250, EOM-500,
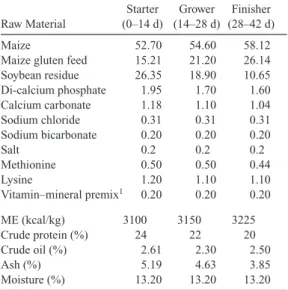
Table 1. Basal Diet Ration Nutrient Content and Analysis (g/kg). Raw Material Starter (0–14 d) Grower (14–28 d) Finisher (28–42 d) Maize 52.70 54.60 58.12
Maize gluten feed 15.21 21.20 26.14 Soybean residue 26.35 18.90 10.65 Di-calcium phosphate 1.95 1.70 1.60 Calcium carbonate 1.18 1.10 1.04 Sodium chloride 0.31 0.31 0.31 Sodium bicarbonate 0.20 0.20 0.20 Salt 0.2 0.2 0.2 Methionine 0.50 0.50 0.44 Lysine 1.20 1.10 1.10 Vitamin–mineral premix1 0.20 0.20 0.20 ME (kcal/kg) 3100 3150 3225 Crude protein (%) 24 22 20 Crude oil (%) 2.61 2.30 2.50 Ash (%) 5.19 4.63 3.85 Moisture (%) 13.20 13.20 13.20
The vitamin–mineral premix provided the following (per kg of diet): vitamin A, 12,000 IU; vitamin D3, 1,500 IU; vitamin E, 35 mg; vitamin K3, 5 mg; vitamin B1, 3 mg; vitamin B2, 4 mg; vitamin B6, 4 mg; vitamin B12, 0.03 mg; calcium-D-pantothenate, 15 mg; folic acid, 1 mg; niacin, 25 mg; D-biotin, 0.115 mg; Mg 80 mg; I, 0.15 mg; Co, 0.2 mg; Cu, 5 mg; Fe, 60 mg; Se, 1 mg; Zn, 60 mg.
and EOM-750 groups at 22
◦C and the SC,
SEOM-250, SEOM-500, and SEOM-750 groups
at 36
◦C were used during the study period [23].
The basal diet feeds given in Table
1
were fed at
the same time every day, and the new feeds were
offered after the animals were weighed.
Drink-ing water was removed at the same time every
day and replaced with fresh water containing the
EOM, which was provided from a commercial
company in Ankara, Turkey. The feed used in
this study was analyzed according to standard
AOAC methods [24].
EOM Composition
The EOM contained 26.70% durenol, 23.89%
eugenol, 16.49% gamma terpinene, 8.35%
hiep-taethylene glycol, 6.42% hexaethylene
col, 3.31% cymene, 3.08% pentaethylene
gly-col, 2.87% caryophyllene, 2.30% D-limonene,
2.18% betapinene, and 0.95% eucalyptol.
Internal Organ Weights
At the end of the experiment, 20
broil-ers were randomly selected from each group
JAPR: Research Report
78
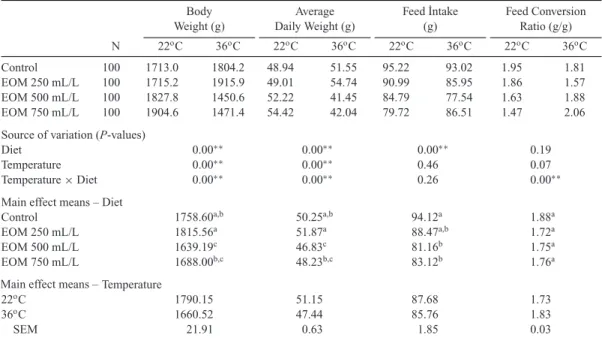
Table 2. Effect of Essential Oil Mixture (EOM) Added to Drinking Water on Fattening Performance of Groups Fed in Stress Conditions. Body Weight (g) Average Daily Weight (g) Feed ˙Intake (g) Feed Conversion Ratio (g/g) N 22oC 36oC 22oC 36oC 22oC 36oC 22oC 36oC Control 100 1713.0 1804.2 48.94 51.55 95.22 93.02 1.95 1.81 EOM 250 mL/L 100 1715.2 1915.9 49.01 54.74 90.99 85.95 1.86 1.57 EOM 500 mL/L 100 1827.8 1450.6 52.22 41.45 84.79 77.54 1.63 1.88 EOM 750 mL/L 100 1904.6 1471.4 54.42 42.04 79.72 86.51 1.47 2.06
Source of variation (P-values)
Diet 0.00∗∗ 0.00∗∗ 0.00∗∗ 0.19
Temperature 0.00∗∗ 0.00∗∗ 0.46 0.07
Temperature× Diet 0.00∗∗ 0.00∗∗ 0.26 0.00∗∗
Main effect means – Diet
Control 1758.60a,b 50.25a,b 94.12a 1.88a
EOM 250 mL/L 1815.56a 51.87a 88.47a,b 1.72a EOM 500 mL/L 1639.19c 46.83c 81.16b 1.75a EOM 750 mL/L 1688.00b,c 48.23b,c 83.12b 1.76a Temperature 22oC 1790.15 51.15 87.68 1.73 36oC 1660.52 47.44 85.76 1.83 SEM 21.91 0.63 1.85 0.03
Means within a column showing different superscripts are significantly different (P< 0.05): least significance difference test was applied to compare means.
∗Significant at 0.05 level,∗∗Significant at 0.01 level, SEM= standard error of the mean.
(total
= 160 broilers) and killed at the
Labora-tory of Bayburt University Food, Agriculture and
Livestock Application and Research Centre. The
liver, spleen, gizzard, and abdominal fat of the
animals were excised and weighed (
±0.001 g).
Meat Quality and Ethanol Antioxidant
Proper-ties
At the end of the trial, 160 animals (2
animals/group) were randomly selected, killed,
and the breast was removed for analysis at
the Bayburt University Department of Food
Engineering. Color intensity (L
∗, a
∗, and b
∗)
was measured in accordance with the
specifi-cations depicted by International Commission
on Illumination CIELAB (Commision
Inter-nationale de L’e Clairage), which specializes
in 3-dimensional measuring of color [25,
26].
According to these criteria, the following values
signified different color intensities: L
∗; L
∗= 0
black, L
∗= 100 white (darkness/fairness); a
∗;
a
∗= +60 red, a
∗= −60 green and b
∗; b
∗= +60
yellow, b
∗= −60 blue. The TBARS values were
determined by a method developed by Tarladgis
et al. [27] and modified by Lemon [28,
29].
Statistical Analysis
The parameters were all normally distributed,
and the data are expressed as means and
stan-dard errors. A univariate general linear model
was used to identify differences in feed intake
[FI], feed conversion ratio [FCR], body weight
[BW], average daily weight gain [ADWG], and
meat color between the 2 temperature and 4 diet
groups. Duncan’s multiple comparison test was
applied to compare differences between means.
A P value
<0.05 was considered significant [
30].
RESULTS AND DISCUSSION
The performance data of the groups (BW,
ADWG, FI, and FCR) and those of the
EOM supplemented groups (250, 500, and
750 mL/1000 L) are given in Table
2. The
groups exposed to temperature and diet stress
effectively fattened in response to the EOM-750
mL/L and the (BW—ADWG and FCR) in the
SEOM-250 mL/L group (P
< 0.05).
In this study, the effect of the EOM mixture
added at different doses (250, 500, and 750
mL/L) to drinking water of broilers under
Main effect means –
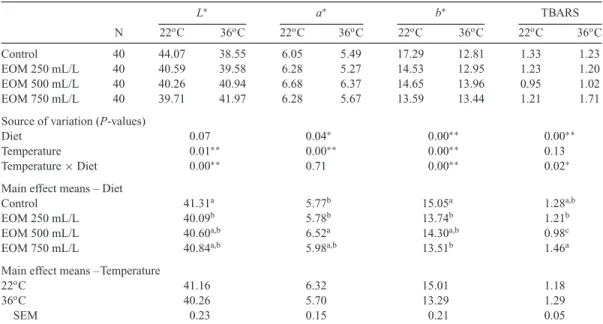
Table 3. Effect of Essential Oil Mixture (EOM) on Meat Color Parameters and TBARS Added to Drinking Water of Groups Fed in Stress Conditions.
L∗ a∗ b∗ TBARS N 22oC 36oC 22oC 36oC 22oC 36oC 22oC 36oC Control 40 44.07 38.55 6.05 5.49 17.29 12.81 1.33 1.23 EOM 250 mL/L 40 40.59 39.58 6.28 5.27 14.53 12.95 1.23 1.20 EOM 500 mL/L 40 40.26 40.94 6.68 6.37 14.65 13.96 0.95 1.02 EOM 750 mL/L 40 39.71 41.97 6.28 5.67 13.59 13.44 1.21 1.71
Source of variation (P-values)
Diet 0.07 0.04∗ 0.00∗∗ 0.00∗∗
Temperature 0.01∗∗ 0.00∗∗ 0.00∗∗ 0.13
Temperature× Diet 0.00∗∗ 0.71 0.00∗∗ 0.02∗
Main effect means – Diet
Control 41.31a 5.77b 15.05a 1.28a,b
EOM 250 mL/L 40.09b 5.78b 13.74b 1.21b
EOM 500 mL/L 40.60a,b 6.52a 14.30a,b 0.98c
EOM 750 mL/L 40.84a,b 5.98a,b 13.51b 1.46a
Temperature
22oC 41.16 6.32 15.01 1.18
36oC 40.26 5.70 13.29 1.29
SEM 0.23 0.15 0.21 0.05
Means within a column showing different superscripts are significantly different (P< 0.05): least significance difference test was applied to compare means.
∗Significant at 0.05 level,∗∗Significant at 0.01 level, SEM= standard error of the mean.
temperature stress on the performance
param-eters was investigated. Exercise was effective
for fattening the groups supplemented with
EOM at a dose of 750 mL/L in the non-stressed
groups and in the 250 mL/L stressed groups.
According to the data obtained, the highest feed
consumption was found in the K (control) group
(95.22) and the lowest feed consumption was in
the EOM-750 group (79.72) (P
< 0.00), while
36
◦C stress group the highest feed consumption
in the SK (control) group (93.02) and the
minimum feed consumption in the SEOM-500
groups (77.54) was determined to be (P
<
0.05). The data obtained for the stress-free and
stressed groups were similar to some previous
studies [31–33] but contrasted with others
[34–37]. These discrepancies were likely due to
differences in the composition, administration
routes, and doses of the essential fatty acid
mixture under study.
The rate of utilization of feed decreased as
heat stress increased, and these negative effects
decreased the benefits of adding the EOM
250 mL/L (1.57) dose to drinking water (P
<
0.01) and the 750 mL/L (1.47) dose increased
the FCR rate compared to the control group
(P
< 0.00). These effects in the stress-free and
stressed groups corroborate some studies [32,
37] but not others [34,
36], which may also
be explained by the effects of the EOM on the
intestinal microflora.
The negative effects of heat stress decreased
in the SEOM-250 group (1915.9 g) when
ADWG (daily live weight gain) (54.74 g)
was added to the drinking water and in the
stressed groups when EOM-750 (1904.6 g) and
ADWG (54.42 g) were added. These results
in the stress-free and stressed groups were
similar to some studies [32], but contrasted with
others [31,
33,
34,
36]. It is thought that these
discrepancies were due to differences in the
composition, administration routes, and doses
of the essential fatty acid mixture under study.
Tables
3
and
4
show the effects of adding
EOM to drinking water of the broilers in the
stressed and non-stressed groups. The
broil-ers exposed to heat stress had reduced liver
weight but normal gizzard, splenic, and visceral
weights. No effects on TBARS or the b
∗color
coordinate of breast meat were observed in the
heat-stressed animals, whereas a
∗and L
∗color
values increased.
The color of meat is affected by lipid
oxida-tion, myoglobin concentraoxida-tion, and hemoglobin
pigment within the muscles. The color change
in the meat depends on the amount of these
JAPR: Research Report
80
Main effect means –
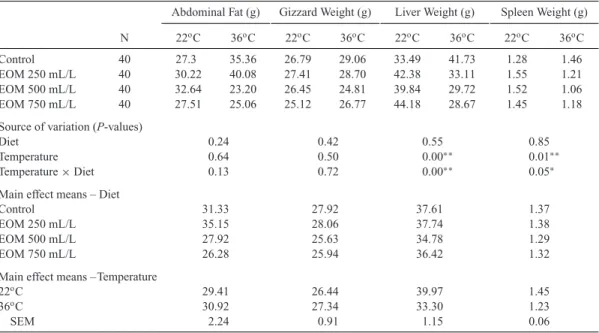
Table 4. Effect of Essential Oil Mixture (EOM) on Internal Organ Weights Added to Drinking Water of Groups Fed in Stress Conditions.
Abdominal Fat (g) Gizzard Weight (g) Liver Weight (g) Spleen Weight (g) N 22oC 36oC 22oC 36oC 22oC 36oC 22oC 36oC
Control 40 27.3 35.36 26.79 29.06 33.49 41.73 1.28 1.46
EOM 250 mL/L 40 30.22 40.08 27.41 28.70 42.38 33.11 1.55 1.21
EOM 500 mL/L 40 32.64 23.20 26.45 24.81 39.84 29.72 1.52 1.06
EOM 750 mL/L 40 27.51 25.06 25.12 26.77 44.18 28.67 1.45 1.18
Source of variation (P-values)
Diet 0.24 0.42 0.55 0.85 Temperature 0.64 0.50 0.00∗∗ 0.01∗∗ Temperature× Diet 0.13 0.72 0.00∗∗ 0.05∗ Control 31.33 27.92 37.61 1.37 EOM 250 mL/L 35.15 28.06 37.74 1.38 EOM 500 mL/L 27.92 25.63 34.78 1.29 EOM 750 mL/L 26.28 25.94 36.42 1.32 22oC 29.41 26.44 39.97 1.45 36oC 30.92 27.34 33.30 1.23 SEM 2.24 0.91 1.15 0.06
∗Significant at 0.05 level,∗∗Significant at 0.01 level, SEM= standard error of the mean.
pigments in the meat. It has been reported that
poultry exposed to stress exhibit high
post-cutting pH values [38,
39]. Broiler breast meat
constitutes 5% of live broiler weight and is very
susceptible to color deterioration [40]. In our
study, there was an increase in the a
∗color
coor-dinate but no difference in the b
∗color parameter
of the breast meat in the stressed groups
com-pared to the control group. Previous studies have
reported that this difference is a consequence of
reduced myoglobin oxidation by-products
result-ing from lipid oxidation [38,
39]. The brightness
(L
∗) of the breast meat decreased in the
stress-free groups but increased in the stressed groups.
This difference is due to the fact that the
EOM-containing compounds added to drinking water
have antioxidants with lipid oxidation inhibiting
properties, which can change the luminal
bright-ness value [41].
Because poultry meat is rich in highly
unsat-urated fatty acids, it has a higher rate of
oxida-tive deterioration than other types of meat. The
TBARS method is used to define the scale of
rancidity (souring) that occurs as a result of
au-toxidation in fat and fatty parts of meat. TBARS
values increase in parallel with the accumulation
of short-chain fatty acids, which cause rancidity
[42]. In our study, the phenolic compounds in
the EOM mixture added to the drinking water
have antioxidant properties [43,
44]. The
phe-nolic hydroxyl (OH) groups of these phephe-nolic
compounds inhibit oxidation of unsaturated fatty
acids leading to the formation of hydrogen
per-oxide, aldehydes, and ketones in the fatty
tis-sues of the meat. Thus, it is possible to
pre-vent changes in the pungency or taste of meat
[45]. Studies have shown that some of the
phe-nolic compounds in the EOM added to drinking
water act like synthetic antioxidants [41] and
reduce the amount of TBARS in tissues [42],
thereby increasing antioxidant enzyme activities
and inhibiting lipid oxidation [45]. We
deter-mined no difference between the TBARS values
in the stressed groups and the control group after
adding 750 mL/1000 L EOM to the broiler
drink-ing water of the stressed groups. Although the
meat color parameters and TBARS values were
similar to some previous data [46], other authors
have reported different findings [39,
43], which
was thought to be due to the essential fatty acid
contents administered to the animals.
Table
4
provides the weights of the
in-ternal organs of the chickens used in our
study, including the intra-group and inter-group
Main effect means – Diet
Temperature Main effect means –
statistical comparisons. Some studies have
eval-uated the effect of adding essential fatty acids
at different feed concentrations to broilers under
heat stress and found no effects [47–50]. In
con-trast, adding essential fatty acids to the feed of
broilers under heat stress increases liver weight
[51], highlighting the influence of the different
EOM compounds. In our study, the EOM in the
broiler drinking water decreased liver weight, but
increased the abdominal fat in the 250 mL/1000
L group. The EOM had no effect on gizzard or
splenic weights. The reason for this difference is
thought to be caused by the effects of different
compounds in the EOM mix, which is included
in broiler rations.
CONCLUSION AND APPLICATIONS
1. The EOM had positive effects on the broiler
performance parameters (BW, FI, and FCR).
2. Broiler liver weight decreased and
abdom-inal fat increased in the SEOM-250 groups
without affecting gizzard or spleen weight.
3. The TBARS and b
∗color parameter of the
breast meat were not affected by the added
EOM, while it augmented the effect on a
∗and L
∗meat color coordinates.
˙In order to achieve production at low costs,
feed to increase performance and high quality
furthers studies are required on anti-stress and
antiooxidant features carrying EOM for the
de-velopment of better nutritional strategies.
REFERENCES AND NOTES
1. Selye, H. 1938. Experimental evidence supporting the conception of “adaptation energy”. Am. J. Physiol. 123:758–765.
2. Karslı, M. A., and H. H. D¨onmez. 2007. Effects of plant extract on growth performance and villi of the small bowel in heat stressed broiler, Atat¨urk ¨Universitesi Vet. Bil. Derg. 2:143–148.
3. Dibner, J. J., and J. D. Richard. 2005. Antibiotic growth promoters in agriculture: history and mode of ac-tion. Poult. Sci. 84:634–643.
4. Burt, S. 2004. Essential oils: their antibacterial prop-erties and potential applications in foods—a review. Int. J. Food Microbiol. 94:223–253.
5. Bu˘gdaycı, K. E., and A. Erg¨un. 2011. The effects of supplemental essential oil or probiotic on performance, im-mune system and some blood parameters in broilers. Ankara
¨
Universitesi Veteriner Fak¨ultesi Dergisi. 58:279–284.
6. Feizi, A., P. Bijanzad, and K. Kaboli. 2013. Effects of thyme volatile oils on performance of broiler chickens. Eur. J. Exp. Biol. 3:250–254.
7. Dezsi, S., A. S. B˘ad˘ar˘au, C. Bischin, D. C. Vodnar, R. Silaghi-Dumitrescu, A. Gheldiu, A. Mocan, and L. Vlase. 2015. Antimicrobial and antioxidant activities and phenolic profile of Eucalyptus globulus Labill. and Corymbia ficifolia (F. Muell.) K.D. Hill & L.A.S. Johnson Leaves. Molecules. 20:4720–4734.
8. Botsoglou, N. A., E. Christaki, P. Florou-Paneri, I. Giannenas, G. Papageorgiou, and A. B. Spais. 2004. The effect of a mixture of herbal essential oils or ´a-tocopheryl acetate on performance parameters and oxidation of body lipid in broilers. SA J. An. Sci. 34:52–61.
9. Daroui-Mokaddem, H., A. Kabouche, M. Bouacha, B. Soumati, A. El-Azzouny, C. Bruneau, and Z. Kabouche. 2010. GC/MS analysis and antimicrobial activity of the essential oil of fresh leaves of Eucalytus globulus, and leaves and stems of Smyrnium olusatrum from Constantine (Algeria). Nat Prod Commun. 5:1669–1672.
10. Dorman, H. J. D., and S. G. Deans. 2000. Antimicro-bial agents from plants: antibacterial activity of plant volatile oils. J Appl Microbiol. 88:308–316.
11. Ultee, A., M. H. J. Bennik, and R. Moezelaar. 2002. The phenolic hydroxyl group of carvacrol is essential for ac-tion against the food-borne pathogen Bacillus cereus. Appl. Environ. Microbiol. 68:1561–1568.
12. Karpouhtsis, I., E. Pardali, E. Feggou, S. Kokkini, Z. G. Scouras, and P. Mavragani-Tsipido. 1998. Insecticidal and genotoxic activities of oregano essential oils. J. Agric. Food Chem. 46:1111–1115.
13. Guimar˜aes, A. G., J. S. S. Quintans, and L. J. Quintans-J´unior. 2013. Monoterpenes with analgesic activity-a systematic review. Phytother. Res. 27:1–15.
14. Bishop, C. D. 1995. Antiviral activity of the essential oil of melaleuca alternifolia (Maiden & Betche) cheel (tea tree) against tobacco mosaic virus. J. Essent. Oil Res. 7:641– 644.
15. Silva, C. F., F. C. Moura, M. F. Mendes, and F. L. P. Pessoa. 2011. Extraction of citronella (Cymbopogon nardus) essential oil using supercritical co2: experimental data and mathematical modeling. Braz. J. Chem. Eng. 28:343–350.
16. Al-Ja’fari, A. H., R. Vila, B. Freixa, F. Tomi, J. Casanova, J. Costa, and S. Ca˜nigueral. 2011. Composition and antifungal activity of the essential oil from the rhizome and roots of Ferula hermonis. Phytochemistry. 72:1406– 1413.
17. Fu, Y., Y. Zu, L. Chen, X. Shi, Z. Wang, S. Sun, and T. Efferth. 2007. Antimicrobial activity of clove and rosemary essential oils alone and in combination. Phytother. Res. 21:989–994.
18. Kpoviessi, S., J. Bero., P. Agbani, F. Gbaguidi, B. Kpadonou-Kpoviessi, B. Sinsin, G. Accrombessi, M. Fr´ed´erich, M. Moudachirou, and J. Quetin-Leclercq. 2014. Chemical composition, cytotoxicity and in vitro antitry-panosomal and antiplasmodial activity of the essential oils of four Cymbopogon species from Benin. J. Ethnopharmacol. 151:652–659.
19. Monzote, L., M. Garc´ıa, A. M. Montalvo, R. Scull, M. Miranda, and J. Abreu. 2007. In vitro activity of an essential oil against Leishmania donovani. Phytother. Res. 21:1055– 1058.
20. Chowdhury, S., G. P. Mandal, A. K. Patra, P. Kumar, I. Samanta, S. Pradhan, and A. K. Samanta. 2018. Different essential oils in diets of broiler chickens: 2. Gut microbes and
JAPR: Research Report
morphology, immune response, and some blood profile and antioxidant enzymes. Anim. Feed Sci. Technol. 236:39–47.
21. Platel, K., and K. Srinivasan. 2000. Influence of di-etary spices and their active principles on pancreatic diges-tive enzymes in albino rats. Nahrung. 44:42–46.
22. Jang, I. S., Y. H. Ko, S. Y. Kang, and C. Y. Lee. 2007. Effect of a commercial essential oil on growth perfor-mance, digestive enzyme activity and intestinal microflora population in broiler chickens. Anim. Feed Sci. Technol. 134:304–315.
23. On day 7 of the experiment, the animals were ran-domly assigned to 8 groups (n= 50) (22◦C (K (control), EOM-250 (250 mL/1,000 L), EOM-500 (500 mL/1,000 L), EOM-750 (750 mL/1,000 L)), 36◦C (SK (Stress Control), SEOM-250 (250 mL/1,000 L), SEOM-500 (500 mL/1,000 L), SEOM-750(750 mL/1,000 L)), each containing 5 sub-groups (n= 10).
24. AOAC. 2005. Official Methods of Analysis of AOAC International. 18th ed. Association of Official Analytical Chemists, Rockville, MD.
25. The color intensities were scaled CR-400 (Minolta Co, Osaka, Japan) calorimeter device.
26. Ohkawa, H, N. Ohishi, and K. Yagi. 1979. Assay for lipid peroxides in animal tissues by thiobarbituric acid reaction. Anal. Biochem. 95:351–358.
27. Tarladgis, B. G., A. M. Pearson, and L. J. R. Dugan. 1962. The chemistry of the 2-thiobarbituric acid test for the determination of oxidative rancidity in foods. I. Some important side reactions. J. Am. Oil Chem. Soc. 39:34–39.
28. Lemon, DW. 1975. An improved TBA test for rancid-ity new series circular. No:51. Halifax-Laboratory, Halifax, Nova Scotia.
29. Six ml of TCA solution (7.5% TCA, 0.1% EDTA and 50.1 1-Propil Gallat) was added to a 1-g ground sam-ple of breast fillet. The mixture was homogenized with an Ultro-turrax for 20–30 s and was filtered through Whatman filter paper. A 1 mL aliquot of 0.02 M thiobarbituric acid was added to the filtered mixture. The mixture was held in a hot water bath for 40 min. Once cooled, the mixture was cen-trifuged for 5 min at 2,000 rpm, and absorbance values were measured at 532 nm (UV 160; Shimadzu, Tokyo, Japan). The TBARS values were reported inμmol malondialdehyde/kg. 30. IBM SPSS statistics 20.0 software (IBM Corp., Armonk, NY, USA) was used for the analyses.
31. Bozkurt, M., K. K¨uc¸¨ukyılmaz, A. U. C¸ atlı, M. C¸ ınar, E. Bintas¸, and F. Coven. 2012. Performance, egg quality, and immune response of laying hens fed diets supplemented with mannan-oligosaccharide or an essential oil mixture un-der moun-derate and hot environmental conditions. Poult. Sci. 91:1379–1386
32. Ghazi, S., T. Amjadian, and S. Norouzi. 2015. Single and combined effects of vitamin C and oregano essential oil in diet, on growth performance, and blood parameters of broiler chicks reared under heat stress condition. Int. J. Biometeorol. 59:1019–1024.
33. Khosravinia, H., S. Ghasemi, and E. A. Rafiei. 2013. The effect of savory (Satureja khuzistanica) essential oils on performance, liver and kidney functions in broiler chickens. J. Anim. Feed Sci. 22:50–55
34. Akbarian, A., J. Michiels, A. Golian, J. Buyse, Y. Wang, and S. De Smet. 2014. Gene expression of heat shock protein 70 and antioxidant enzymes, oxidative status, and meat oxidative stability of cyclically heat-challenged finish-ing broilers fed Origanum compactum and Curcuma xanth-orrhiza essential oils. Poult. Sci. 93:1930–1941.
35. Lee, K. W., H. Everts, H. J. Kappert, M. Frehner, R. Losa, and A. C. Beynen. 2003. Effects of dietary essential oil components on growth performance, digestive enzymes and lipid metabolism in female broiler chickens. Br. Poult. Sci. 44:450–457.
36. Khosravinia, H. 2015. Effects of Satureja khuzistan-ica essential oils in drinking water on mortality, produc-tion performance, water intake, and organ weights in broiler chickens reared under heat stress condition. Int J Biometeo-rol. 59:1711–1719.
37. Tekce, E., and M. G¨ul. 2016. Effects of Origanum syriacum essential oil added in different levels to the diet of broilers under heat stress on performance and intestinal histology. Eur. Poult. Science. 80:1–11.
38. Lac¸in, E., ¨O. C¸ oban, M. ˙I. Aksu, N. Sabuncuo˘glu, and H. Das¸. 2013. The effect of different photoperiod and stocking density on colour, pH and TBARS values in broilers meat. Atat¨urk ¨Universitesi Veteriner Bilimler Dergisi. 8:192– 201.
39. Sharbati, A, M. Daneshyar, A. Aghazadeh, J. Aliakbarlu, and F. Hamian, 2015. Effects of Rhus coriaria on nutrient composition, thiobarbituric acid reactive substances and colour of thigh meat in heat-stressed broilers. SA J. An. Sci. 45:49–55.
40. Yetis¸ir, R, M. Karakaya, F. ˙Ilhan, M. T. Yılmaz, and B. ¨
Ozalp. 2008. Effects of different lighting programs and sex on some broiler meat quality properties affecting consumer preference. Anim. Prod. 49:20–28.
41. Kanani, P. B., M. Daneshyar, J. Aliakbarlu, and F. Hamian. 2017. Effect of dietary turmeric and cinnamon pow-ders on meat quality and lipid peroxidation of broiler chicken under heat stress condition. Vet. Res. Forum. 8:163–169.
42. G¨okalp, H. Y., M. Kaya, Y. T¨ulek, and ¨O. Zorba. 2001. Guidelines for quality control and laboratory practice in meat and meat products. 4. Edition. Erzurum, Atat¨urk
¨
University Published, 133–135.
43. Luna, A., M. C. L´abaque, J. A. Zygadlo, and R. H. Marin. 2010. Effects of thymol and carvacrol feed supplementation on lipid oxidation in broiler meat. Poult. Sci. 89:366–370.
44. Tavarez, M. A., D. D. Boler, K. N. Bess, J. Zhao, Y. Yan, C. Dilger, F. K. Mckeith, and J. Killefer. 2011. Effect of antioxidant inclusion and oil quality on broiler performance, meat quality, and lipid oxidation. Poult. Sci. 90:922–930.
45. Nakatani, N. 1997. Antioxidants from spices and herbs. Pages 64–69 in Natural Antioxidants: Chemistry, Health Effects, and Applications. 3rd ed. Shahidi F, ed. AOCS, California.
46. Parvar, R., H. Khosravinia, and A. Azarfar. 2013. Effect of Satureja khuzestanica essential oils on postmortem pH and antioxidative potential of breast muscle from heat stressed broiler chicken. Asian J. Poult. Sci. 7:83–89.
47. Hashemipour, H., H. Kermanshahi, A. Golian, and T. Veldkamp. 2013. Effect of thymol and carvacrol feed sup-plementation on performance, antioxidant enzyme activities, fatty acid composition, digestive enzyme activities, and im-mune response in broiler chickens. Poult. Sci. 92:2059–2069. 48. Berrama, Z., S. Temim, S. Souames, and H. Ainbaziz. 2017. Growth performance, carcass and viscera yields, blood constituents and thyroid hormone concentrations of chronic heat stressed broilers fed diets supplemented with cumin seeds (Cuminum cyminum L.). Kafkas Univ Vet Fak Derg. 23:735–742.
49. Akbarian, A., A. Golian, H. Kermanshahi, R. Farhoosh, A. R. Raji, S. De Smet, and J. Michiels. 2013.
Growth performance and gut health parameters of finish-ing broilers supplemented with plant extracts and exposed to daily increased temperature. Span. J. Agric. Res. 11:109– 119.
50. Habibi, R., G. H. Sadeghi, and A. Karimi. 2014. Ef-fect of different concentrations of ginger root powder and its essential oil on growth performance, serum metabolites and antioxidant status in broiler chicks under heat stress. Br. Poult. Sci. 55:228–237.
51. Masouri, B., S. Salari, H. Khosravinia, S. T. Vakili, and T. Mohammadabadi. 2015. Effects of dietary Satureja khuzistanica essential oils andα-tocopherol on productive
performance, organ weights, blood lipid constituents and antioxidative potential in heat stressed broiler chicks. Eur. Poult. Sci. 79:1–14.
Acknowledgments
This study was funded and supported by the scientific research projects commission of Bayburt University, Bayburt, Turkey (Project code: 2017/02–69001-01). This study was approved by the ethics committee of Atat¨urk University Veterinary Faculty (22.02.2018/2/24).