(wileyonlinelibrary.com) DOI: 10.1002/asl2.495
Flux potentials of aerosols and their spatial variations
in a coastal metropolis
Nihan Uygur,1,2,3Arslan Saral,1Kaan Yetilmezsoy,1Selami Demir,1S. Levent Kuzu,1Hakan Celikten1,4and
Sabah Ahmed Abdul-Wahab5
1Faculty of Civil Engineering, Department of Environmental Engineering, Yildiz Technical University, Istanbul, 34220, Turkey 2Multiphase Chemistry Department, Max Planck Institute for Chemistry, Mainz, 55128, Germany
3Faculty of Engineering and Architecture, Department of Environmental Engineering, Kahramanmara¸s Sütçü ˙Imam University, Kahramanmaras, 46100, Turkey
4Faculty of Engineering, Department of Environmental Engineering, Ardahan University, Ardahan, Turkey
5Department of Mechanical and Industrial Engineering, College of Engineering, Sultan Qaboos University, Muscat, 123, Sultanate of Oman
*Correspondence to:
N. Uygur, Max Planck Institute for Chemistry, Multiphase Chemistry Department, Mainz 55128, Germany. E-mail: [email protected]; [email protected] Received: 2 May 2013 Revised: 20 February 2014 Accepted: 25 February 2014 Abstract
Contribution of marine aerosols to marine boundary layer was investigated in Istanbul, Turkey. Average fluxes of Na+and Cl−were determined to be 49.0 and 64.9 mg (m2day)−1, with
the highest values being 510.8 and 825.2 mg (m2day)−1, respectively. Monthly fluxes of other
parameters (flouride, chloride, bromide, phosphate, lithium, sodium, potassium, ammonium, nitrite, nitrate, sulfate, magnesium, calcium, zinc, lead, cobalt, cadmium, nickel, manganese, chromium, vanadium, copper, iron, aluminum and boron) were also studied. Contribution of sea salt aerosols from Black Sea was of great importance along the Bosphorous line, while other sources are also effective along the coasts of Marmara Sea.
Keywords: aerosol; chloride flux; sodium flux; wet candle; wind rose analysis
1. Introduction
Marine aerosols are of great importance in the aspect of air quality management as they contribute to atmo-spheric aerosol concentrations as well as halogen species in marine boundary layer (Clarke et al., 2006). This is the case especially for coastal regions where anthropogenic sources are less effective.
Following the formation and re-entrainment to the atmosphere, marine aerosols are dispersed as salt solutions or they form salt crystals depending on atmo-spheric humidity and temperature. These reactions include both physical and chemical conversions. For instance, marine aerosols react with atmospheric nitric acid to form sodium nitrate which, in turn, accumu-lates on particulate matter owing to its nonvolatile characteristics (Tamm and Schulz, 2003).
Marine aerosols with their effects on global climate change (Laskin et al., 2003) are the fundamental com-ponents of regional and global atmospheric models (Gong et al., 1997). Considering the fact that annual mass flux of marine aerosols is reported to be rang-ing from 3.3 billion tons (Takemura et al., 2000) to 6.5 billion tons (Grini et al., 2002), it is not surprising that they have become a great topic of concern for sci-entists owing to their effects on physical and chemical cycles in the atmosphere. For these reasons, research is carried out, in order to determine physical and chemi-cal properties of atmospheric aerosols as well as their sources.
Marine aerosols are continuously under the effect of meteorological conditions such as wind, humidity,
and temperature both during and after their formation. Therefore, the size distribution of marine aerosols is a function of not only the formation mechanism and the source but also the atmospheric conditions as well (Gong et al., 1997; Lewis and Schwartz, 2004). In addition to size distribution, characteristics of atmospheric aerosols change as a result of several physical and chemical processes during their travel from source to the receptor site (Seinfeld and Pandis, 2006).
Several other parameters that trigger formation of marine aerosols and determine their characteristics are sea traffic and biochemical activities. Research has shown that marine aerosols include certain fractions of organic carbon in addition to sea salt and sulfate (Cavalli et al., 2004; Sorensen et al., 2005). The organic fraction of marine aerosols is especially higher in spring and in autumn when the phytoplankton activity is higher (O’Dowd et al., 2004).
Formation and transport of marine aerosols are espe-cially important for air quality in Istanbul atmosphere, as Istanbul is located on two peninsulas. Being a metropolis, aerosol compositions, concentrations, and dispersion as well as transport in Istanbul atmosphere are greatly dependent upon natural sources especially marine-originated aerosols and anthropogenic sources such as traffic and industrial emissions. The aim of the current study is to determine the marine-originated con-tribution to the atmospheric aerosols along coastline and their variations depending on wind velocity and wind direction; and to estimate the source characteris-tics of atmospheric aerosols.
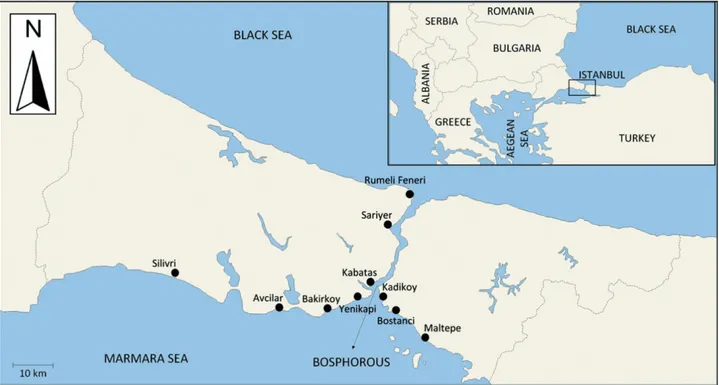
Figure 1. Sampling stations and map of Istanbul (adapted from Uygur, 2012).
2. Methodology
2.1. Sampling site
Marine aerosol samples were collected at ten stations along the coasts of Marmara Sea (Silivri, Avcilar, Bakirkoy, Yenikapi, Bostanci, Maltepe), Black Sea (Rumeli Feneri), and along the Bosphorous (Kabatas, Sariyer, and Kadikoy), which connects Black Sea and Marmara Sea, from April to October in the year 2011. Figure 1 shows the sampling points. Special care was taken in determining sampling points. First of all, the samplers were installed at points closest to the shore-line with easy access. Besides, the sampling points were chosen from the areas of least traffic and other anthro-pogenic emissions. Finally, the samplers were located on open areas to ensure free air movements and wind currents. Meteorological data were obtained from offi-cial web site of Turkish State Meteorological Services (available at http://www.mgm.gov.tr/index.aspx).
2.2. Sampling method
Marine aerosol samples were collected according to the standard ASTM-G140 Wet Candle method. Samplers were produced as given in the standard method and a picture of a sampler is shown in Figure 2.
The samplers consisted of a passive sampling surface and a cage that protects the sampler. The cage is con-structed by iron bars and painted to prevent corrosion. The sampling surface is a tourniquet of 16 cm × 150 cm enfolded around a glass tube partially submerged in a 500-ml High-density polyethylene bottle. The bottle is kept full with ultra-deionized water during the sampling period.
Figure 2. A picture of a ASTM-G140 wet candle setup at a
sampling station.
The sampling by ASTM-G140 method is based on collection by direct impaction of aerosols onto the sam-pling surface. The aerosol content then diffuses into the liquid (a mixture of water and glycerine) in the bot-tle. Installed on an open area, the samplers were able to collect aerosol samples with minimal interference owing to wind fluctuations. Besides, the roof-top of the sampler (Figure 2) protected it from direct precipita-tion. Because the samplers were installed 2 m above the ground, it provides some extra security measures. Sam-ples were collected on a monthly schedule and the con-tents were analyzed for their chemical compositions.
Marine aerosol not only consist of sodium and chlo-ride ions, but it may also contain SO42−, NO3−, NH4+,
Ca++ and Mg++ up to different factors such as chem-ical composition of sea water, biologchem-ical activity on sea surface, seasonal temperature difference, air pol-lution level, traffic density, distance from sea and so on. ASTM-G140 is used in order to measure these ions in the same way with sodium and chloride. The sam-pling points were chosen from the areas far as possible from traffic and other anthropogenic emissions, but the effects of these emission sources can not be ignored because of the sampling system wet candle which is settled according to the specifications determined by American Society for Testing Materials (ASTM) G140. As a result, these ions are not assumed to be only marine-originated. Anthropogenic source contributions could be very possible. Aerosol samples were analyzed by ion chromatography (Dionex ICS-3000) for deter-mination of SO42−, NO3−, NH4+, Ca++ and Mg++ ion fluxes.
2.3. Evaluation of aerosol fluxes
Marine aerosol fluxes were estimated using the anal-ysis of monthly samples collected from April 2011 to October 2011. Fluxes were estimated using the mea-sured concentrations of aerosol contents in liquid phase. The aim was to estimate the seasonal variations of dominant marine-aerosol-forming and transport mech-anisms. For this purpose, measurement results from ten stations along Marmara Sea, Black Sea and the Bospho-rus coasts were employed in the evaluation process. Besides, the measurement results could reveal tempo-ral and spatial distribution of fluxes. The variations are mainly due to the changes in ambient temperature, atmospheric humidity, wind speed and direction. The
fluxes were calculated in terms of mg (m2day)−1 and
μg( (m2day)−1) using the following formula: Fij =
Cij× Vi
Aiti (1)
where Fijis the flux of jth species in the ith aerosol
sam-ple in mg (m2day)−1, C
ijis the measured concentration
of jth species in the ith sample in mg l−1, V
i is the
vol-ume of the ith sample in liters, Ai is the active surface
area of the ith wet candle in m2, and t
iis the sampling
period of the ith sample in days.
3. Results and discussion
A total of 70 monthly samples were collected at ten sampling stations from April 2011 to October 2011. Twenty-five species were analyzed in these samples and results of the two, sodium and chloride ions, are reported here.
3.1. Fluxes of sodium and chloride ions
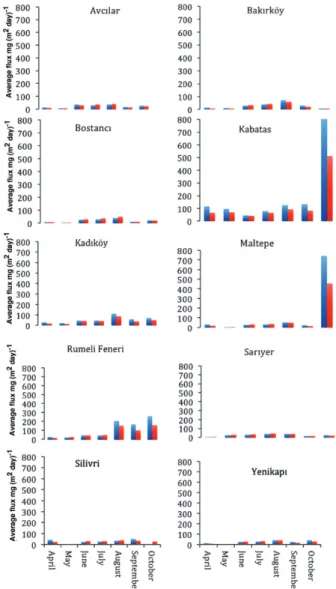
Average monthly fluxes of sodium and chloride ions are shown in Figure 3. Average fluxes of these ions
were determined to be 64.9 and 49.0 mg (m2day)−1,
Figure 3. Sodium and chloride fluxes between April and
Octo-ber 2011 at ten sampling stations. Blue bars represent chloride ion fluxes and the magenta ones stand for sodium ion fluxes. respectively, during this period with maximum values
of 825.2 and 510.8 mg (m2day)−1. Maximum fluxes
were observed at Kabatas, Maltepe and Rumeli Feneri stations in October 2011. The highest precipitation was 52.6 mm and the highest average wind speed was
38.6 km h−1 with highest wind gust of 51.5 h−1 in
October 2011, The fluxes at the same stations were rel-atively higher in August 2011 too.
Classification of the stations according to their corre-sponding shoreline is also shown in Table I. Although Maltepe station’s profile somewhat differs from other Marmara Sea stations, all Marmara Sea stations show the same increasing trend during the summer months. Higher temperature differences between day and night during June, July and August (18.3, 15.7 and 14.2 ∘C, respectively) are the most probable reasons for high aerosol fluxes during summer months. For the Black Sea station (Rumeli Feneri), higher fluxes were observed during August, September and October 2011. The reason for this may be long-range trans-port of Black Sea aerosols by northwesterly winds. Kabatas, Sariyer and Kadikoy stations were classified
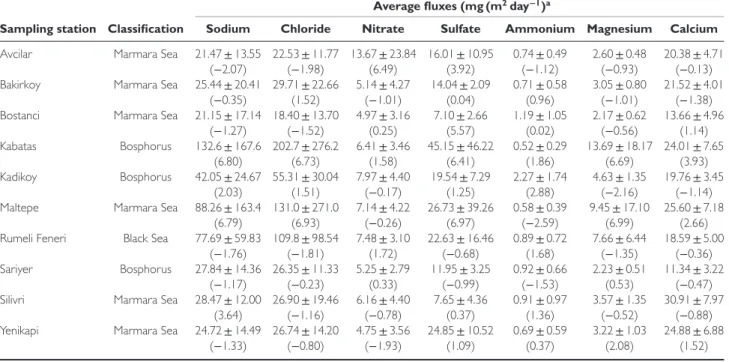
Table I. Average monthly fluxes of the major pollutants at each station.
Average fluxes (mg (m2day−1)a
Sampling station Classification Sodium Chloride Nitrate Sulfate Ammonium Magnesium Calcium
Avcilar Marmara Sea 21.47 ± 13.55 22.53 ± 11.77 13.67 ± 23.84 16.01 ± 10.95 0.74 ± 0.49 2.60 ± 0.48 20.38 ± 4.71 (−2.07) (−1.98) (6.49) (3.92) (−1.12) (−0.93) (−0.13) Bakirkoy Marmara Sea 25.44 ± 20.41 29.71 ± 22.66 5.14 ± 4.27 14.04 ± 2.09 0.71 ± 0.58 3.05 ± 0.80 21.52 ± 4.01
(−0.35) (1.52) (−1.01) (0.04) (0.96) (−1.01) (−1.38) Bostanci Marmara Sea 21.15 ± 17.14 18.40 ± 13.70 4.97 ± 3.16 7.10 ± 2.66 1.19 ± 1.05 2.17 ± 0.62 13.66 ± 4.96
(−1.27) (−1.52) (0.25) (5.57) (0.02) (−0.56) (1.14) Kabatas Bosphorus 132.6 ± 167.6 202.7 ± 276.2 6.41 ± 3.46 45.15 ± 46.22 0.52 ± 0.29 13.69 ± 18.17 24.01 ± 7.65
(6.80) (6.73) (1.58) (6.41) (1.86) (6.69) (3.93) Kadikoy Bosphorus 42.05 ± 24.67 55.31 ± 30.04 7.97 ± 4.40 19.54 ± 7.29 2.27 ± 1.74 4.63 ± 1.35 19.76 ± 3.45
(2.03) (1.51) (−0.17) (1.25) (2.88) (−2.16) (−1.14) Maltepe Marmara Sea 88.26 ± 163.4 131.0 ± 271.0 7.14 ± 4.22 26.73 ± 39.26 0.58 ± 0.39 9.45 ± 17.10 25.60 ± 7.18
(6.79) (6.93) (−0.26) (6.97) (−2.59) (6.99) (2.66) Rumeli Feneri Black Sea 77.69 ± 59.83 109.8 ± 98.54 7.48 ± 3.10 22.63 ± 16.46 0.89 ± 0.72 7.66 ± 6.44 18.59 ± 5.00
(−1.76) (−1.81) (1.72) (−0.68) (1.68) (−1.35) (−0.36) Sariyer Bosphorus 27.84 ± 14.36 26.35 ± 11.33 5.25 ± 2.79 11.95 ± 3.25 0.92 ± 0.66 2.23 ± 0.51 11.34 ± 3.22
(−1.17) (−0.23) (0.33) (−0.99) (−1.53) (0.53) (−0.47) Silivri Marmara Sea 28.47 ± 12.00 26.90 ± 19.46 6.16 ± 4.40 7.65 ± 4.36 0.91 ± 0.97 3.57 ± 1.35 30.91 ± 7.97
(3.64) (−1.16) (−0.78) (0.37) (1.36) (−0.52) (−0.88) Yenikapi Marmara Sea 24.72 ± 14.49 26.74 ± 14.20 4.75 ± 3.56 24.85 ± 10.52 0.69 ± 0.59 3.22 ± 1.03 24.88 ± 6.88
(−1.33) (−0.80) (−1.93) (1.09) (0.37) (2.08) (1.52) aGiven as average value ± standard deviation and with Kurtosis value in the parenthesis.
as the Bosphorus stations. All these stations showed the same increasing trends during summer months, except the October values at Kabatas station, when the highest temperature differences between day and night are observed. Of these, highest fluxes were observed for Kabatas station; probable reason for this may be the increased sea traffic activities at this station. One final note on these stations is the wind directions. In the Bosphorus line, northwesterly winds prevailed in June 2011, northerly winds in July 2011 and north-northeasterly winds in August 2011. Figure 3 clearly shows that the summertime fluxes were the low-est in June 2011, as the prevailing winds during this period were from terrestrial regions, leading to reduced effects of marine aerosols at Bosphorus stations.
Average monthly fluxes of the all major pollutants are summarized in Table I. As shown in Table I, average fluxes of sodium and chloride ions ranged
from 21.15 to 132.6 mg (m2day)−1 and from 18.40 to
202.7 mg (m2day)−1. Highest average fluxes of sodium
ion were observed at Kabatas, Maltepe and Rumeli Feneri stations, whereas the lowest values were at Bostanci, Avcilar and Yenikapi stations. For chloride ion fluxes, highest fluxes were calculated for Kabatas, Maltepe and Rumeli Feneri stations with lowest values at Bostanci, Avcilar and Sariyer stations.
Because the Kurtosis characterizes the relative peakedness or flatness of a distribution compared to the normal distribution, it is easy to conclude that very high fluctuations were observed in fluxes calculated at Kabatas and Maltepe stations. Combining the Kurtosis data with the fact that sodium and chloride emission profiles of any sea body remain relatively constant, it can be concluded that the aerosol concentrations at sta-tions whose product of Kurtosis values for sodium and
chloride ions are negative might probably be under the effect of more than one sources of aerosols, although positive products do not necessarily mean that only one source is effective at sites. Therefore, Bakirkoy and Silivri stations are said to be under the effect of more than one source.
3.2. Contributions of fluxes of major ions and trace elements
In the present work, monthly fluxes (specifically their percentage of contributions) of other parameters (nat-ural, anthropogenic and natural or anthropogenic) were also studied together with monthly fluxes of
sodium (Na+) and chloride (Cl−) ions (marine aerosol
markers). Besides sea salt aerosols, it is also aimed to explore the influence and the behavior of other sources in the urban atmosphere of Istanbul. First, all param-eters were divided into two main groups according to
their measurement scales such as mg (m2day)−1 and
μg (m2day)−1. Thereafter, for each scale, the
parame-ters were allocated into different subgroups according to their potential sources such as natural, anthropogenic and natural or anthropogenic. Finally, the influence of each source was assessed as the percentage of contribution with respect to total aerosol fluxes using their individual flux values. In this study, percentage of contributions of seven natural parameters (flouride, chloride, bromide, phosphate, lithium, sodium and potassium), four anthropogenic parameters (ammo-nium, nitrite, nitrate and sulfate) and two natural or anthropogenic parameters (magnesium and calcium) were calculated according to their monthly average
fluxes in terms of mg (m2day)−1Moreover, percentage
of contributions of nine anthropogenic parameters (zinc, lead, cobalt, cadmium, nickel, manganese,
AVCILAR (a) FlourideChlorideBromide Phos phat e LithiumSodi um Pota ssiu m FlourideChlor ide Brom ide Phos phateLithium
Sodium Pota ssiu m FlourideChlor ide Brom ide Phos phateLithium
Sodium Pota ssium Flour ide ChlorideBrom ide Phos phate
LithiumSodium Pota ssium Flour ide Chlor ide Brom ide Phos phat e LithiumSodium
Pota ssiu m FlourideChlorideBromide Phos phat e LithiumSodi
um Pota ssium FlourideChlorideBromide Phos phat e
LithiumSodi um Pota ssiu m FlourideChlor ide Brom ide Phos phat e LithiumSod ium Pota ssiu m FlourideChlor ide Brom ide Phos phat e LithiumSodium
Pota ssium FlourideChlorideBromide Phos phat e
LithiumSodium Pota ssiu m Lo g -scale p ercen tag e s 0.001 0.01 0.1 1 10 100 BAKIRKOY (b) Lo g -scale p e rcen tag es 0.001 0.01 0.1 1 10 100 BOSTANCI (c) Lo g -scal e p e rcen tag e s 0.001 0.01 0.1 1 10 100 KABATAS (d) L o g-scale percen tag es 0.0001 0.001 0.01 0.1 1 10 100 1000 KADIKOY (e) L o g -scale percen tag e s 0.0001 0.001 0.01 0.1 1 10 100 MALTEPE (f) L o g -s cale percen tag es 0.0001 0.001 0.01 0.1 1 10 100 1000 RUMELI FENERI (g) L o g-scale percen tag es 0.0001 0.001 0.01 0.1 1 10 100 1000 SARIYER (h) L o g-scale percen tag es 0.0001 0.001 0.01 0.1 1 10 100 SILIVRI (i) L o g-scale percen tag es 0.0001 0.001 0.01 0.1 1 10 100 YENIKAPI (j) Lo g -scale p e rcen tag e s 0.0001 0.001 0.01 0.1 1 10 100 a b c d e f g h i j
Sampling stations along the coasts of Marmara Sea
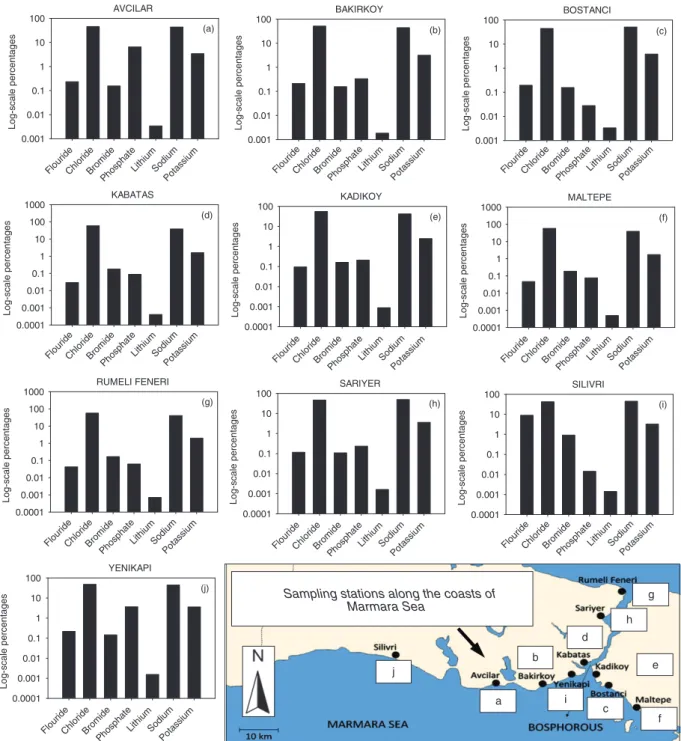
Figure 4. Percentage of contributions (log-scale) of natural parameters (flouride, chloride, bromide, phosphate, lithium, sodium
and potassium) calculated according to monthly average fluxes [mg (m2day)−1] in the period April to October 2011.
chromium, vanadium and copper) and natural or anthropogenic parameters (iron, aluminum and boron) were determined according to their monthly average fluxes in terms of mg (m2day)−1.
As seen in Figure 4, the percentage of contributions
of Na+and Cl−flux values, which are higher than those
of other detected parameters, were determined between 38.8–51.2% and 42.2–59.3% respectively, for all
sta-tions. The percentage of contribution of K+ flux for
all stations was determined between 1.62 and 3.85% specifically. It is clear from Figure 4 that the high-est percentages of phosphate flux were observed in Avcilar 6.5% and Yenikapi 3.7%. The high percentage of phosphate flux in the Avcilar and Yenikapi during the
study period may be generally attributed to the effect of continental air masses and agricultural activity. In the same way, the highest flux percentage of fluoride was observed in Silivri during study period with a percent-age value of 8.96%.
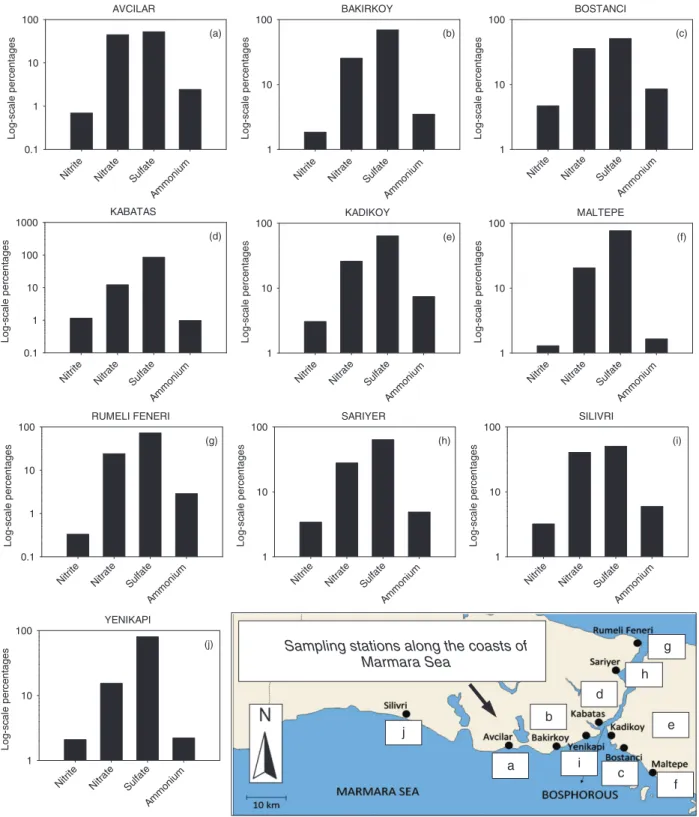
The percentages of contributions of ammonium, nitrite, nitrate and sulfate ions (anthropogenic param-eters) are given in Figure 5. As seen in Figure 5, flux percentage of sulfate (50.3–85.7%) is the highest when compared with other parameters in this group. The main sources of sulfate in the atmosphere are anthropogenic (traffic, industrial activity, etc.) and its corrosive effects on materials are well known. Visually, it is difficult to talk about a seasonal trend in the graph.
AVCILAR (a) Nitrite Nitr ate Sulfate Ammonium Nitrite Nitr ate Sulfate Ammonium Nitrite Nitr ate Sulfate Ammonium Nitrite Nitr ate Sulfate Ammonium Nitrite Nitr ate Sulfa te Ammonium Nitrite Nitr ate Sulfate Ammonium Nitrite Nitr ate Sulfate Ammonium Nitrite Nitr ate Sulfate Ammonium Nitrite Nitr ate Sulfate Ammonium Nitrite Nitr ate Sulfate Ammonium Log -sc a le pe rce nta ges 0.1 1 10 100 BAKIRKOY (b) Log -sc a le pe rce n ta ges 1 10 100 BOSTANCI (c) Log -sc a le pe rce n ta ges 1 10 100 KABATAS (d) L o g -scal e p e rcen ta g e s 0.1 1 10 100 1000 KADIKOY (e) Log -sc a le pe rce n ta ges 1 10 100 MALTEPE (f) Log -sc a le pe rce n ta ges 1 10 100 RUMELI FENERI (g) Log -sc ale pe rce n ta ges 0.1 1 10 100 SARIYER (h) Log -sc ale pe rce n ta ges 1 10 100 SILIVRI (i) Log -sc ale pe rce n ta ges 1 10 100 YENIKAPI (j) Log -sc ale pe rce n ta ges 1 10 100 a b c d e f g h i j
Sampling stations along the coasts of Marmara Sea
Figure 5. Percentage of contributions (log-scale) of anthropogenic parameters (ammonium, nitrite, nitrate and sulfate) calculated
according to monthly average fluxes [mg (m2day)−1)] in the period April to October 2011.
In some parts of study area (Yenikapi, Kabatas, Rumeli
Feneri, Kad𝚤koy), the sulfate ion fluxes of the samples
were observed to have increased. On the other hand, the percentages of contribution of nitrate flux were also observed to be between 12.2 and 44.6% at all sampling stations. In the study period, the maximum percentages of contribution of nitrate flux were observed to be 44.6 and 40.5% in Avcilar and Silivri, respectively. The high flux percentages of nitrate can be as a result of the agricultural activities in these regions in Istanbul.
During the study period, Bostanc𝚤 is the only sampling
station having higher percentage flux values of ammo-nium with a percentage value of 8.5%. This is a typical agricultural activity product of the rapid hydrolysis of urea excreted by livestock. For that reason, this episodic situation can be explained by the suburban structure of Bostanci station.
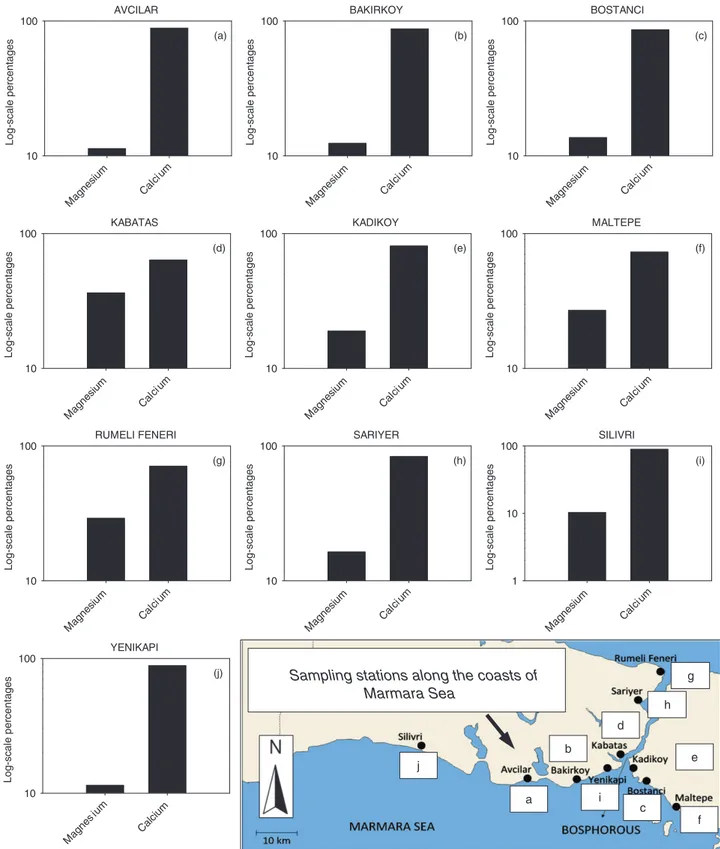
As shown in Figure 6, the highest percentages of con-tribution of calcium and magnesium fluxes are observed in Silivri and in Kabatas with percentage values of
AVCILAR (a) Magne sium Cal cium L og-sca le pe rc ent a ge s 10 100 BAKIRKOY (b) Magne sium Cal cium L og-sca le pe rc ent a ge s 10 100 BOSTANCI (c) Magne sium Calci um L og-sca le pe rc ent a ge s 10 100 KABATAS (d) Magne sium Cal cium Log-sca le pe rc en tage s 10 100 KADIKOY (e) Magne sium Cal cium L og-sca le pe rc ent a ge s 10 100 MALTEPE (f) Magne sium Cal cium Log-sca le pe rc en tage s 10 100 RUMELI FENERI (g) Magne sium Cal cium L o g-sca le pe rc ent a ge s 10 100 SARIYER (h) Magn esiu m Cal cium L o g-sca le pe rc ent a ge s 10 100 SILIVRI (i) Magne sium Calci um L o g-sca le pe rc ent a ge s 1 10 100 YENIKAPI (j) Magne s ium Calc ium L o g -s c a le p e rc en ta g e s 10 100 a b c d e f g h i j
Sampling stations along the coasts of Marmara Sea
Figure 6. Percentage of contributions (log-scale) of natural or anthropogenic parameters (magnesium and calcium) calculated
according to monthly average fluxes [mg (m2day)−1] in the period April to October 2011.
89.7% and 36.3%, respectively. Alagha and Tuncel (2003) have reported that both are known as typical crustal elements and their neutralizing effects on wet deposition samples are well known. The highest per-centage of contribution of calcium flux in Silivri station may be ascribed to some natural activities and cal-cite mines, which provide raw materials for the cement factory situated about 7 km from the Silivri station.
Moreover, meteorological factors such as wind speed and direction, and local and long-range back trajecto-ries of air parcels, can be the most significant effects on calcium enriched aerosol events. Figure 6 clearly shows that magnesium is a following parameter. Its possible sources are crustal and some industries (i.e. metal, medicine, airplane, etc.). For the present case, the observed percentage of contribution of Mg flux may be
AVCILAR (a) Lo g-s c a le pe rc e ntage s 0.01 0,1 1 10 100 1000 BAKIRKOY (b) Log-scale percentages 0.1 1 10 100 BOSTANCI (c) Log-scale percentages 0.1 1 10 100 KABATAS (d) Log-scale percentages 0.1 1 10 100 KADIKOY (e) Log-scale percentages 0.1 1 10 100 MALTEPE (f) Log-scale percentages 0.1 1 10 100 RUMELI FENERI (g) Log-scale percentages 0.1 1 10 100 SARIYER (h) Log-scale percentages 1 10 100 SILIVRI (i) Log-scale percentages 0.1 1 10 100 YENIKAPI (j) ZincLea d Coba lt Cadmium Nickel Man gan ese Chro mium Van adiu m Copper ZincLea d Coba lt Cadmium Nickel Man gan ese Chrom ium Van adiumCopper Zi nc Lea d Coba lt Cadmium Nickel Ma ngan ese Chr omium Van adiumCopper Zi nc Lea d Coba lt Cadmium Nickel Man gan ese Chrom ium Van adiumCopper ZincLea d Coba lt Cadmium Nickel Man gan ese Chrom ium Vana dium Copper ZincLea d Coba lt Cadmium Nickel Ma ngan ese Chr omium Vana dium Copper ZincLea d Coba lt Cadmium Nickel Man gan ese Chro mium Vana dium Copper ZincLea d Coba lt CadmiumNickel Man gan ese Chro mium Vana dium Copper Zi nc Lea d Coba lt Cadmiu m Nickel Man gan ese Chro mium Van adiumCopper Zi nc LeadCoba lt Cadmiu m Nickel Ma ngan ese Chro mium Van adiumCopper Log-scale percentages 0.1 1 10 100 a b c d e f g h i j
Sampling stations along the coasts of Marmara Sea
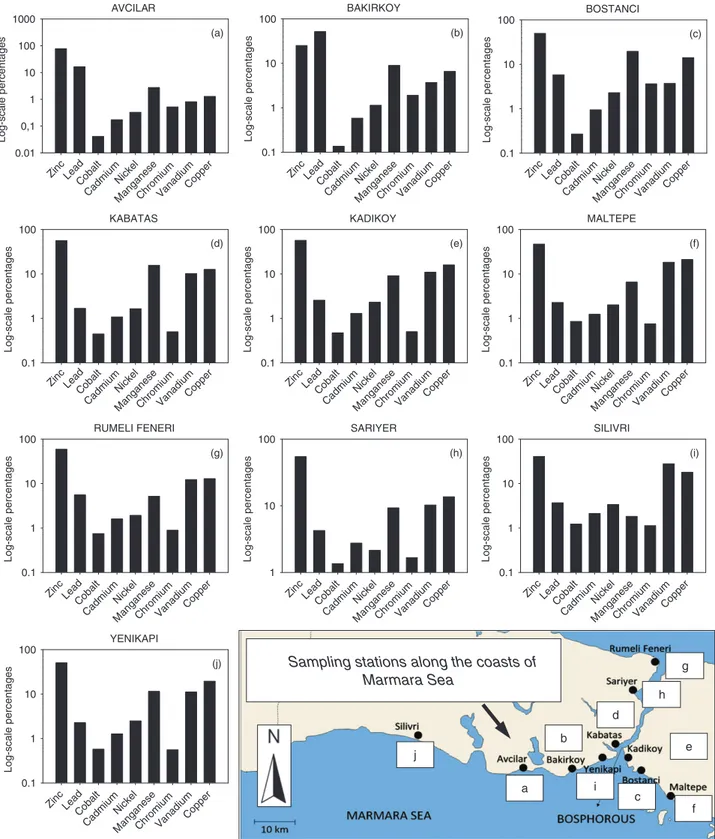
Figure 7. Percentage of contributions (log-scale) of anthropogenic parameters (zinc, lead, cobalt, cadmium, nickel, manganese,
chromium, vanadium and copper) calculated according to monthly average fluxes [mg (m2day)−1] in the period April to October
2011.
expected to be higher in Kabatas station because these elements could be partly from soil.
As seen in Figure 7, the highest anthropogenic parameter measured in all coastal stations of Marmara Sea is zinc. This element is typically generated from anthropogenic-related sources, which may account for its high flux value. The percentages of contribution of Zn flux in all coastal stations were between 25.1 and
77.7%, but the highest was observed in Avci𝚤lar with a value of 77.7% (Figure 7). This is probably due to the traffic and industrial activity with respect to other coastal stations. The highest percentage of contribution
of Pb flux were observed to be 51.9% at Bak𝚤rkoy. This
can be correlated with traffic (sea and land), industries
and coal combustion at the Bak𝚤rkoy station which
AVCILAR (a) Iron Aluminum Boron Iron Aluminum Boron Iron Aluminum Boron Iron Aluminum Boron Iron Aluminum Boron Iron Aluminum Boron Iron Aluminum Boron Iron Aluminum Boron Iron Alumi num Boron Iron Aluminum Boron L o g -scal e p e rcen tag e s 1 10 100 BAKIRKOY (b) L o g -scal e p e rcen tag e s 1 10 100 BOSTANCI (c) L og-s c a le per c e nt a g es 1 10 100 KABATAS (d) L o g -scal e p e rcen tag e s 1 10 100 KADIKOY (e) L o g -scal e p e rcen tag e s 1 10 100 MALTEPE (f) L o g -scal e p e rcen ta g e s 1 10 100 RUMELI FENERI (g) Log -s c a le pe rce n ta ge s 1 10 100 SARIYER (h) Log -s c a le pe rce n ta ge s 1 10 100 SILIVRI (i) Log -s c a le pe rce n ta ge s 1 10 100 YENIKAPI (j) Log -s c a le pe rce n ta ge s 1 10 100 a b c d e f g h i j
Sampling stations along the coasts of Marmara Sea
Figure 8. Percentage of contributions (log-scale) of natural or anthropogenic parameters (iron, aluminum and boron) calculated
according to monthly average fluxes [mg (m2day)−1] in the period April to October 2011.
Meteorological factors like wet deposition may also be effective on this event. As seen in Figure 7, the percentages of contribution of Mn, V and Cu were
observed as 19.6, 27.8 and 21.1% at Bostanc𝚤, Silivri
and Maltepe, respectively. All these episodic events are generally related to traffic and local industries. In particular, the high percentage of V flux at Silivri may indicate anthropogenic sources-like incineration (cement factory). It should be noted that these elements could be enriched via long-range transportation.
As seen in Figure 8, boron has a higher percentage of flux (60–82.2%) in all the stations during the sampling period. The highest percentages of boron flux were determined at Maltepe and Kabatas stations with the percentage values of 82.2 and 80.3%, respectively. The possible sources of this element are motor oil, cement factory and boron industries in these regions. This sit-uation may also be a result of the increase in some sea bus activities during the study period. For Maltepe sta-tion, it may also be attributed to the emission of Tuzla
APRIL MAY (a) (b) JUNE (c) (d) JULY AUGUST (e) (f) SEPTEMBER OCTOBER (g)
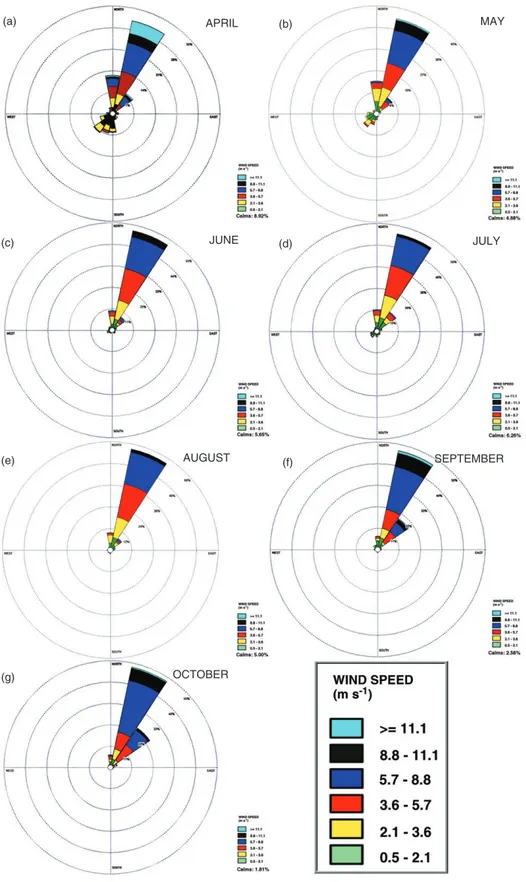
Figure 9. Wind roses of whole campaign period for (a) April 2011, (b) May 2011, (c) June 2011, (d) July 2011, (e) August 2011,
(f) September 2011 and (g) October 2011.
Industrial region. The variability of Al, which is known as crustal or anthropogenic element, was found to be very high with a value of 30.2% at Bostanci station, as similarly described for the highest percentages of Cr
and Mn fluxes at Bostanc𝚤 in Figure 7. This situation
confirmed that the emissions and transports of these ele-ments came from the common sources.
3.3. Relationship between sea salt aerosol fluxes and wind direction
Wind direction and speed values were collected by one of the Turkish Government weather stations, which is located at the same place as one of the sampling sta-tions. The wind rose analysis were performed using a
fully operational wind rose program WR-PLOT Ver-sion 7.0.0. In Figure 9, we show that wind roses of the whole campaign period from April 2011 to October 2011.
During April 2011, dominant air motion was from the north and northeast directions; south and southwesterly winds were of negligible frequencies. In May 2011, frequencies of southwesterly winds were still lower while winds from north and northeast prevailed. Com-paring the wind roses with the flux data in Figure 3, it is obvious that the fluxes at the stations near the coasts of Marmara Sea were lower than they were in April 2011. This can be explained by the decreased frequencies of southwesterly winds in May 2011. As expected, the sea salt aerosol fluxes at stations along the Bosphorous line increased in May 2011 owing to the transport of marine aerosols over the Black Sea. In contrast, increasing frequency of north and northeasterly winds lead to a decrease in Kabatas fluxes as a result of increased transport of terrestrial aerosols in June 2011. During this period, all the stations along the Marmara coast showed an increasing trend of sea salt aerosol fluxes. The frequencies of northwesterly winds also decreased in July 2011 and prevailing winds were from north to east-northeast. The fluxes at all of the Marmara stations remained constant during this period. On the contrary, Bosphorus stations showed slight increases. This increases probably occur as a result of artificial formation of marine aerosol mechanic turbulence because of Bosphorus ship traffic in this period which is a tourism season.
In August 2011, the prevailing winds changed direc-tion to north through northeast. As a result, the sea salt aerosol fluxes at Rumeli Feneri station showed a great increase in this period. The slight increases in fluxes at Bakirkoy, Bostanci, Maltepe and Yenikapi sta-tions (Marmara stasta-tions) point out another source of sea salt aerosol fluxes at these stations. Further, Kabatas and Kadikoy stations also showed a considerable flux increase. This can be explained by sea transportation activities at these stations.
North-northeasterly winds prevailed during Septem-ber 2011. A sharp decrease in the fluxes at Marmara stations (Avcilar, Bakirkoy, Bostanci, Kadikoy, Mal-tepe and Yenikapi) was expected. Again, contrary observations at Silivri station was explained by another source affecting the sampling station. The slight decrease in Rumeli Feneri station was probably a rela-tive drop against the northeasterly winds especially for
3.6–5.7 m s−1 wind speed in August 2011. Being
rela-tively constant during the August–September period, fluxes at Kabatas station pointed out the increased sea traffic here. Finally, it was difficult to interpret a dominant direction for October 2011 winds, although the frequency of northeasterly winds was slightly higher. As a result of increasing northeasterly wind fre-quency, the fluxes at Rumeli Feneri station increased as expected. The increase at Kabatas station is explained by dense sea traffic in October 2011. Sharp increase in Maltepe station, however, is probably due to the
transport of sodium and chloride over Marmara Sea by southerly winds or due to a mechanical disturbance around the sampling site.
4. Conclusions
This paper summarized formations of marine aerosols from different sea surfaces, contribution to aerosol com-position and transportation of marine aerosols, based on sodium and chloride fluxes, and other ions and trace elements on the atmosphere of Istanbul through sam-pling from April to October 2011. The results showed that the contribution of marine aerosols to total ambi-ent aerosols varies spatially and depends on wind speed and direction, the temperature differences between day and night, and density of sea transportation activities. Evaluations were made using the calculated fluxes of sea salt aerosols as well as wind rose analyses. As a conclusion, marine aerosol contribution to aerosol con-centration in Istanbul atmosphere possesses the highest share through long and short-range transport mecha-nisms as well as sea transportation activities. On the other hand, flux percentages of other ions and trace elements originating from the natural, anthropogenic and natural or anthropogenic show a strong correla-tion with the specific properties of each sampling sta-tion such as locasta-tion, distance from the (sea, traffic, industrial activity), population, type of industrial activ-ity. These parameters also affect atmospheric aerosol amount and composition. Namely PM/aerosol concen-tration increases via contribution of natural and anthro-pogenic events. On the basis of the analysis performed during the 7 months, it was determined that, especially in coastal cities such as Istanbul, sea surfaces are largely responsible for natural contribution. Thereafter, effects of natural and anthropogenic sources may cause climate changes. The other critical conclusion of this study is that north and north easterly winds cause marine aerosol concentrations along the Bosphorus line, while the tem-perature differences between day and night are another major contributor to ambient marine aerosol concentra-tions in Istanbul atmosphere.
Acknowledgements
The authors would like to acknowledge the financial support of the Scientific and Technological Research Council of Turkey (TUBITAK) under the contract no. 110Y179. The authors would also like to thank Istanbul Deniz Otobusleri A.S. for providing a place to install the samplers. Over all, the authors would also acknowledge Dr Ferruh Erturk, beloved professor of Yildiz Technical University, due to his most valuable contributions in the early stages of the project. The authors declare that they have no conflict of interests.
References
Alagha O, Tuncel G. 2003. Evaluation of air quality over the black sea: major ionic composition of rain water. Water, Air and Soil Pollution,
Cavalli F, Facchini MC, Decesari S, Mircea M, Emblico L, Fuzzi S, Ceburnis D, Yoon YJ, O’Dowd CD, Putaud JP, Dell’Acqua A. 2004. Advances in characterization of size resolved organic matter in marine aerosol over the North Atlantic. Journal of Geophysical Research 109: 215–229.
Clarke AD, Owens SR, Zhou J. 2006. An ultrafine sea-salt flux from breaking waves: implications for cloud condensation nuclei in the remote marine atmosphere. Journal of Geophysical Research 111: D06202.
Gong SL, Barrie LA, Blanchet JP. 1997. Modeling sea salt aerosols in the atmosphere. 1. Model development. Journal of Geophysical
Research – Atmospheres 102: 3805–3818.
Grini A, Myhre G, Sundet JK, Isaksen ISA. 2002. Modeling the annual cycle of sea salt in the global 3D model Oslo CTM2: concentrations, fluxes, and radiative impact. Journal of Climate 15: 1717–1730. Laskin A, Gaspar DJ, Wang W, Hunt SW, Cowin JP, Colson SD,
Finlayson-Pitts BJ. 2003. Reactions at interfaces as a source of sulfate formation in sea-salt particles. Science 301: 340–344.
Lewis R, Schwartz E. 2004. Sea salt aerosol production: mechanisms, methods, measurements, and models – a critical review. Geophysical
Monograph Series 152: 413.
O’Dowd CD, Facchini MC, Cavalli F, Ceburnis D, Mircea M, Decesari S, Fuzzi S, Yoon YJ, Putaud JD. 2004. Biogeni-cally driven organic contribution to marine aerosol. Nature 431: 676–680.
Seinfeld JH, Pandis SN. 2006. Atmospheric chemistry and physics:
from air pollution to climate change, 2nd ed. John Wiley &
Sons: Hoboken, NJ.
Sorensen LL, Pryor SC, de Leeuw G, Schulz M. 2005. Flux divergence of nitric acid in the marine atmospheric surface layer. Journal of
Geophysical Research 110: 15306–15318.
Takemura T, Okamoto H, Maruyama Y, Numaguti A, Higurashi A, Nakajima T. 2000. Global three-dimensional simulation of aerosol optical thickness distribution of various origins. Journal of
Geophys-ical Research 105: 17853–17873.
Tamm S, Schulz M. 2003. Open-ocean aerosol composition obtained during 15 months on a North Sea Ferry. Atmospheric Environment
37: 133–143.
Uygur N. 2012. Investigation of the effects of marine aerosol on the particulate matter (PM) pollution in urban atmosphere: a case study in Istanbul (In Turkish). PhD Thesis, Yildiz Technical University, Institute of Natural Sciences, Istanbul, Turkey.