DOI No: http://dx.doi.org/10.14225/Joh1251
Geliş Tarihi: 27.02.2018 Kabul Tarihi: 29.03.2018
A STUDY ON THE RELATIONSHIP AMONG THE BRAND PERSONALITY, CONSUMER ETNOCENTRISM AND PURCHASE
INTENTION
Zührem YAMAN
Nurgül SELEK
Abstract
Brand personality is a concept indicating that a brand is also a living entity with characteristics just as humans have. Ethnocentrism can be defined as a perspective in which a particular ethnic and cultural group is given much more importance compared to other ethnic groups and cultures and other groups are evaluated from the point of view of a specific group, hereby accepting groups and cultures that are close to this specific group and rejecting others on the same basis. Consumer ethnocentrism is a tendency to buy local products rather than the imported ones in terms of socio-psychological, political, economical etc. reasons.
In this study, the concept of brand personality, consumer ethnocentrism, purchase intention are mentioned and the relationship among them is examined. The concepts of brand personality, purchase intention and consumer ethnocentrism have been the subject of many studies in the literature, but a study in which these three concepts were investigated together was not enough in the Turkish literature. It has been decided to consider that there was a relationship among these concepts and to conduct a research on the relationship between these three concepts and their effects on each other.
In the study, brand personality scale developed by Geuens et. al. in 2009, consumer ethnicity scale developed by Shimp and Sharma in 1987, purchase intention scale developed by Dodds et al. in 1991 were used in this study. Additionaly, questions regarding demographic variables were added into the survey. As a result of the
Selcuk University Faculty Of Health Sciences Healthcare Administration. Selcuk University.
questionnaire conducted to the students of Selçuk University, the tea brands of Didi and Lipton brands were separately measured and the results were evaluated for two brands seperately. As a result of the survey, a significant positive relationship was found between Didi brand and consumer ethnocentrism, no siginificant relationship between Lipton brand and consumer ethnocentrism was found in the research.
Keywords: Consumer Ethnocentrism, Brand Personality, Purchase Intention.
Marka Kişiliği, Tüketici Etnosentrizmi ve Satın Alma Niyeti Arasındaki İlişki Üzerine Bir Araştırma
Öz
Marka kişiliği markanın da insan özellikleri gibi özelliklere sahip canlı bir varlık olduğunu gösteren bir kavramdır. Etnosentrizm ise bireyin içinde yer aldığı etnik ve kültürel grubu dünyanın merkezi olarak görüp diğer grupları kendi grubunun bakış açısıyla değerlendirip kültür olarak kendine yakın olan grupları kabul edip diğerlerini reddetmesi olarak tanımlanabilir. Tüketici etnosentrizmi ise sosyo-psikolojik, politik, ekonomik vb. nedenlerden dolayı yerli ürünlerin yabancı ürünlere tercih edilmesidir.
Bu çalışmada marka kişiliği, tüketici etnosentrizmi, satın alma niyeti kavramlarına değinilerek aralarındaki ilişki incelenmiştir. Marka kişiliği, satın alma niyeti ve tüketici etnosentrizmi kavramları literatür de birçok çalışmaya konu olmuş fakat bu üç kavramın birlikte incelendiği bir çalışmaya Türkçe literatürde rastlanamamıştır. Bu kavramlar arasında bir ilişkinin olduğunun düşünülmesi ve bu üç kavram arasındaki ilişkinin ve birbirlerine etkisinin ölçülmesine üzerine bir araştırma yapmaya karar verilmiştir.
Çalışmada Geuens ve arkadaşları tarafından 2009 yılında geliştirilen marka kişiliği ölçeği, Shimp ve Sharma, tarafından 1987 yılında geliştirilen tüketici etnosentrizmi ölçeği, satın alma niyeti ölçeğinde ise Dodds ve arkadaşları tarfından 1991 yılında geliştirilen ölçek kullanılmştır. Ayrıca anket formunda demografik sorulara da yer verilmiştir. Selçuk Üniversitesi öğrencilerine yapılan anket sonucunda didi ve Lipton markalarının marka kişilikleri ayrı ayrı ölçülmüş olup iki marka içinde sonuçlar değerlendirilmiştir. Uygulanan anket sonucunda didi markası ile tüketici etnosentrizmi pozitif yönlü bir ilişkiye ulaşlırken lipton markası ve tüketici etnosentrizmi arasında anlamlı bir ilişkiye ulaşılmamıştır.
Anahtar Kelimeler: Tüketici Etnosentrizmi, Marka Kişiliği, Satın Alma Niyeti.
1.Introduction
A brand is a concept representing a product and formed by the combination of many things such as symbol name, shape or smell, taste and so on. This concept which is subject to many researches in marketing still attracts
many researchers and to be examined in many ways. The reason why it is ivenstigated so much is that the brand is a living entity and influenced from daily life. In the brand personality, there is a principle of separating that brand from all other brands by attributing the a specific human characteristics into a brand.
Before explaining the consumer ethnocentrism, the concept of ethnocentrism should be explained and the origin of the concept should be emphasized and addressed. The concept of ethnocentrism refers that a nation should see its own race superior to other nations. In the consumer ethnocentrism, a nation can express its products as superior to the products produced by other nations and consume the product by nationalistic sentiments.
In this context, this study was concuted to examine how brand personality affects consumer ethnocentrism and purchase intention, and how brand personality influences consumer ethnocentrism. By using survey design, brand personality scale was conducted to the students of Selçuk University for the Didi and Lipton cold teas brands, and ethnocentrism and purchase questions were asked for the Didi brand. In the study, literature was examined first and then research findings and conclusion were given.
2.Literature Review 2.1.Brand Personality
The brand personality, which is defined as a sequence of human characteristics associated with a brand, provide a symbolic or self-expressing function rather than product-related characteristics that serve a useful function for consumers (Aaker, 1997: 347). Brand personality, is an important factor for companies to locate their brands in order to differentiate themselves from their competitors and make differences (Özgüven & Karataş, 2010: 144).
The perception of the brand personality is influenced directly or indirectly by the communication that the brand establishes with its consumers. In this sense, the personality of a brand is shaped by marketing communication practices such as product related attributes, associations, brand name, symbol, advertising style, price and distribution channels (Borca, 2013: 105).
Brand personality is both distinguishable and durable just as human personality is. Brand personality is not only important because it ensoul to the brand, but it is also effective for the differentiation of the brand, for the creation
of emotional characteristics and for personal meaning for the consumer. Brand personality influences how people feel about the brand, not what the brand is or what they think about a brand (Ergün, 2011: 16).
Surveys reveal that consumers give importance to the physical characteristics of the product and the harmony between the personalities of the brands and their own personalities. The success of advertising and creating brand personality and image is related to the consumer's understanding and perception of the message (Öztürk, 2010: 33).
2.2. Consumer Ethnocentrism
The concept of "ethnocentrism" is defined in Turkish as " biz
merkezcilik- we-feelin "ırk merkezcilik-race centralism " or " etnosentrizm- ethnocentrism". Ethnosentrism is the combination of the words ethnos in Greek meaning "nation, race" and "kentron" meaning centre (Uyar, 2014: 4). Ethnocentrism expresses the tendency of a person to find his or her own culture and lifestyle superior to the other people (Aykaç, 2015: 4).
When the literature is examined, the term consumer ethnocentrism was firstly used by Shimp and Sharma on the basis of general definition of the concept of ethnocentrism. The basic nuance that should be considered in the concept of consumer ethnocentrism is that it is based on the product in the context of ethnocentrism. General ethnocentrism covers many areas from culture to politics whereas consumer ethnocentrism deals only with product (Eroğlu & Sarı, 2011: 43).
Since the product is the main object of ethnocentrism, it is inevitable that consumers are the key factors for the product category on ethnocentrism levels. Product properties at some points can affect product preferences more strongly than ethnocentrism (Arı, 2007: 24).
The effects of consumer ethnocentrism to prefer domestic products instead of imported products varies from technological / economically developed countries to underdeveloped countries. Research conducted in this regard; show that consumers in developed countries tend to perceive domestic products at higher quality than imported products (Akın, Çiçek, Gürbüz, & İnal, 2009: 493).
The best example of ethnocentric buying behavior can be given as the slogan in Turkey, which is popular in the 1980s, as " home made products, motherlands’producs, every Turk should buy national bias".
2.2. Purchase Intention
"Marketing is in every phase of life." (Okay, 2016: 15) If marketting are taking place at any moment, then purchasing is always taking place also. Of course, these purchases sometimes take place on an unplanned basis. Pre-purchase planning, in other words, intention expresses the determination of product and brand, the determination of product category, the determination of product class, the determination of general necessity. The purchase made in this way is a planned purchase. However, if a purchase is made during shopping without specifying a need and intending to buy, this is defined as an unplanned purchase (Odabaşı & Barış, 2016: 375-376).
Consumers are influenced by individual, psychological and social factors as well as from the information they receive from communication activities in marketting when they make decisions regarding purchasing (Yağcı & İlarslan, 2010: 139). Decision-making, affected by these factors, begins long before the buy-in and affects a great deal afterwards. It is emphasized that decision makin in purchasing should focus on the actual buying decision process rather than the sales itself (Mucuk, 2014: 83).
3.Methodology
3.1. Procedure of the Study and Study Sample
Survey model was used as research design of this study. The questionnaire consists of four parts, which contain the following information. The first part consists of the demographic information, the second part is the brand personality, the third part is the consumer ethnocentrism and the fourth part is the purchase intention scale. The brand personality scale used in the Survey Form was prepared by the scale developed by Geuens et al. (Geuens, Weijters, & De Wulf, 2009). The scale consists of 5 dimensions and 12 expressions. Another scale included in the questionnaire was the consumer ethnocentrism scale developed in 1987 by Shimp and Sharma. The scale is a one-dimensional scale consisting from 17 statements. A one-dimensional 5-point scale developed by Dodds et al. (Dodds, Monroe, & Grewal, 1991) is used in the purchase intention scale included in the fourth part of the questionnaire form.
The study was conducted to determine the relationship among the brand personality, consumer ethnocentrism and purchase intentions. Students of Selçuk University constitute the population group of the research. The table of sample errors was used for a known population prepared in the book of SPSS Applied Scientific Research Methods written by Yazicioglu & Erdoğan (2014). According to Selçuk University 2016 data, the number of students is 95.000. Sample error for a sample with a known number of main masses of 95,000 students in this frame is ± 0. 5 and probability of realization p= .5 and probablity of not happen is q=.5 hence the sample should be reached in this regard is 383. In the study, 400 surveys were distributed and the number of 387 samples were available and it can be said that these 387 individuals can statistically represent the main mass. Due to time and cost constraints in the study, all the data were obtained when the course intensity was high in the first week of April 2017 and on Mondays, Tuesdays and Wednesdays.
The data in the research was transferred to the computer environment so that the collected data could be evaluated statistically. SPSS 23.0 package program has been used for coding and statistical analysis of these data. Reliability (Cronbach Alpha), correlation, regression and factor analysis were performed. The statistical tests were performed with careful entry of the questionnaire data. The Independent Samples T test and the One-Way Anova test were used to determine whether there is a significant difference or not.
The Cronbach alpha coefficient was used to measure the reliability of the scales included in the survey. Altunışık et al. stated (2012) that this method is the most used method for internal consistency measurement and it is stated that the alpha value is between 0 and 1 and the acceptance rate should be at least 0,70. Table 1 gives information about the scale items used in the research and the cronbach alpha coefficient.
Table 1: Cronbach Alpha (Reliability) Coefficient of Scales
Scale Measurement Range Item Numbers
Cronbach Alpha Constant
Brand Personality (didi) 5 Likert Scale 12 0.67
Brand Personality (Lipton) 5 Likert Scale 12 0.68
Consumer Ethnocentrism 5 Likert Scale 17 0.83
Purchase Intention 5 Likert Scale 5 0.90
It has been observed that in the brand personality, the reliability of both Lipton and Didi is lower than the acceptance rate of 0.70. In Lipton, it is seen
Brand Personality
that the realistic expression reduces the reliability ratio, while the reliability of this expression is removed it becomes 0.71 and the reliability of the ordinary expression decreases the reliability and the removal of this expression make its reliability to 0.70 in this case. As shown in Table 1, consumer ethnocentrism and purchase intention are well above the acceptance rate of scale reliability.
3.2.Model of the Research and Hypothesis
Figure 1: Research Model
Hypothesis 1: As for Didi brand there is a positive relationship between
brand personality and consumer ethnocentrism.
Hypothesis 2: There is a positive relationship between brand personality
and consumer ethnocentrism for the Lipton brand.
Hypothesis 3: There is a positive relationship between brand personality
and purchase intention.
Hypothesis 4: There is a positive relationship between consumer
ethnocentrism and purchase intention.
4. Findings
4.1. Properties of the Sample
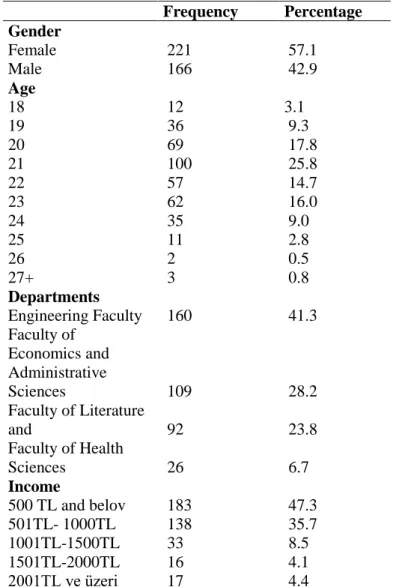
The demographic characteristics (age, gender, section and income situation) of the students participating in the survey are given in the tables below. The average age of 387 students participating in the survey is 21.46. Table 2 contains the demographic information of the participants. 57.1% of them are female and 42.9% of them are male students. While 41.3% of the students participating in the research are Engineering Faculty students, the remaining 58.7% are Faculty of Economics and Administrative Sciences, Faculty of Literature and Faculty of Health Sciences. The students who participated in the survey were asked about their monthly incomes and it was found to be 500 TL or less on average.
Consumer Ethnocentrism
Table 2: Demographic Information Frequency Percentage Gender Female 221 57.1 Male 166 42.9 Age 18 12 3.1 19 36 9.3 20 69 17.8 21 100 25.8 22 57 14.7 23 62 16.0 24 35 9.0 25 11 2.8 26 2 0.5 27+ 3 0.8 Departments Engineering Faculty 160 41.3 Faculty of Economics and Administrative Sciences 109 28.2 Faculty of Literature and 92 23.8 Faculty of Health Sciences 26 6.7 Income 500 TL and belov 183 47.3 501TL- 1000TL 138 35.7 1001TL-1500TL 33 8.5 1501TL-2000TL 16 4.1 2001TL ve üzeri 17 4.4
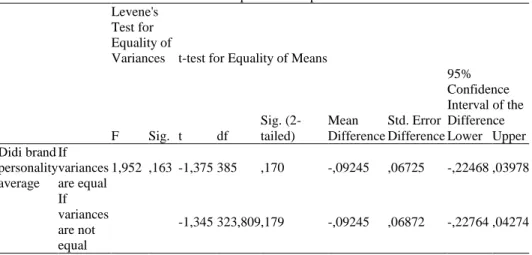
The Independent Samples T test was used to determine whether there was a significant difference between the demographic characteristics and the brand personality for didi brand in terms of gender. As the leneve value of 0.163 at the 5% level of significance is greater than 0.05, it is concluded that there is no significant difference between the variances of these two groups. As a result, brand personality perception was found to have a value of p> 0,05 (sig.
(2-tailed) = 0.170) in the T test, so that students' perception of brand personality did not show any significant difference according to gender
Table 3: Independent Samples Test Levene's
Test for Equality of
Variances t-test for Equality of Means
F Sig. t df Sig. (2-tailed) Mean Difference Std. Error Difference 95% Confidence Interval of the Difference Lower Upper Didi brand personality average If variances are equal 1,952 ,163 -1,375 385 ,170 -,09245 ,06725 -,22468 ,03978 If variances are not equal -1,345 323,809 ,179 -,09245 ,06872 -,22764 ,04274
Independent Samples T was used to determine whether there is a significant difference between the brand personality scale for Lipton brand and gender. T test results are given in Table 4.
There is no difference between the two groups' variances because the 0.956 value at the 5% significance level is greater than the 0.05 value.
Table4:Independent Samples Test Levene's
Test for Equality of
Variances t-test for Equality of Means
F Sig. t df Sig. (2-tailed) Mean Difference Std. Error Difference 95% Confidence Interval of the Difference Lower Upper The average value of brand personality scale for Lipton brand and If variances are equal ,003 ,956 -2,199 385 ,028 -,14856 ,06756 -,28140 -,01573 If variances are not equal -2,250 379,003 ,025 -,14856 ,06604 -,27841 -,01872
Therefore, it is seen that the value of sig (2-tailed) which is equal to the variances is 0.028. The Liptonun brand personality perception shows significant difference because it is less than 0.05, varies according to the gender. It can be said that men's brand personality perception is higher because the group with a large average belongs to males.
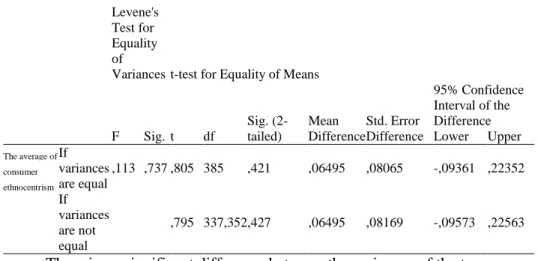
Independent Samples T test was used to determine whether there was a significant difference between gender and consumer ethnocentrism, and t-test results were included in Table 5. There is no difference between the two groups' variances, as the 0.737 value of the levene value at the 5% significance level is greater than 0.05. Therefore, it is seen that the value of sig (2-tailed) which is equal to the variances is 0.421. Since this value is greater than 0.05, the tested consumer ethnocentrism perception does not differ by gender.
Table 5: Independent Samples Test
Levene's Test for Equality of
Variances t-test for Equality of Means
F Sig. t df Sig. (2-tailed) Mean Difference Std. Error Difference 95% Confidence Interval of the Difference Lower Upper The average of consumer ethnocentrism If variances are equal ,113 ,737 ,805 385 ,421 ,06495 ,08065 -,09361 ,22352 If variances are not equal ,795 337,352 ,427 ,06495 ,08169 -,09573 ,22563
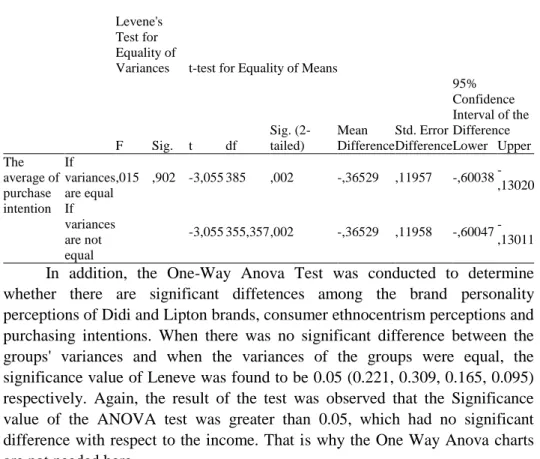
There is no significant difference between the variances of the two groups in terms of gender because the levene value is 0.902, at the 5% significance level, is greater than 0.05. Therefore, it is seen that the value of sig (2-tailed) which is equal to the variances is 0.002. Purchase intention differs according to the gender because it has a value less than 0.05. It can be said that men have a higher intention to buy cold tea for didi brand since they are the group having more higher average. The results are given in Table 6.
Tablo 6: Independent Samples Test
In addition, the One-Way Anova Test was conducted to determine whether there are significant diffetences among the brand personality perceptions of Didi and Lipton brands, consumer ethnocentrism perceptions and purchasing intentions. When there was no significant difference between the groups' variances and when the variances of the groups were equal, the significance value of Leneve was found to be 0.05 (0.221, 0.309, 0.165, 0.095) respectively. Again, the result of the test was observed that the Significance value of the ANOVA test was greater than 0.05, which had no significant difference with respect to the income. That is why the One Way Anova charts are not needed here.
4.2. Measurement of the Relationship among Brand Personality, Consumer Ethnocentrism and Purchasing Intention
In this study, it was aimed to investigate whether there is any relationship among the perceptions of the brand personality of the students with the consumer ethnocentrism and purchase intention, and to determine how they affect each other if such a relationship exists. In this context, the relationships between brand personality and consumer ethnocentrism perceptions and brand personality and purchasing intention is calculated by using Pearson correlation coefficient. Regression analysis was also used to measure causality between them.
Levene's Test for Equality of
Variances t-test for Equality of Means
F Sig. t df Sig. (2-tailed) Mean Difference Std. Error Difference 95% Confidence Interval of the Difference Lower Upper The average of purchase intention If variances are equal ,015 ,902 -3,055 385 ,002 -,36529 ,11957 -,60038 -,13020 If variances are not equal -3,055 355,357 ,002 -,36529 ,11958 -,60047 -,13011
Table 8: Didi's Brand Personality and Purchasing Intention Test
Model Sum of squares sd
Averages the of
squares F Sig.
1 Regression 42,903 1 42,903 33,605 ,000b
Remaining 491,529 385 1,277
Sum 534,432 386
In Table 7 and Table 8, brand personality of Didi and consumer ethnocentrism scales as well as brand personality and purchasing intention were tested to determine their significance and the following linear models were proposed.
Consumer Ethnocentrism = a + b Didi's Brand Personality + £ Purchase Intention = a + b Didi's Brand Personality + £
According to this model, brand personality is independent variable consumer ethnocentrism also can be regarded as a dependent variable which depends on brand personality and constant number. £ specifies the error term. The results of the regression analysis carried out on the above model are given in Table 9.
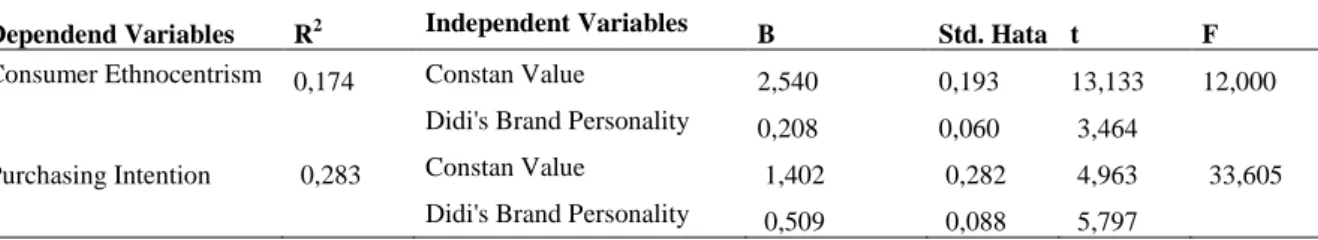
Table 9: Regression Analysis of Didi's Brand Personality, Consumer Ethnocentrism and Purchasing Intention
Dependend Variables R2 Independent Variables B Std. Hata t F
Consumer Ethnocentrism 0,174 Constan Value 2,540 0,193 13,133 12,000
Didi's Brand Personality 0,208 0,060 3,464
Purchasing Intention 0,283 Constan Value 1,402 0,282 4,963 33,605
Didi's Brand Personality 0,509 0,088 5,797
Furthermore, it can be said that the correlation coefficient should be between -1 and +1 and that this correlation is a potent correlation with 0.174.So when the brand personality increases, the consumer ethnocentrism will increase by 0.174. The hypothesis 1, which states that for the Didi brand a positive relationship is established with consumer ethnocentrism.
Table 7: Didi’s Significance Test for Brand Personality and Consumer Ethnocentrism
Model Sum of squares sd
Averages the
of squares F Sig.
1 Regression 7,187 1 7,187 12,000 ,001b
Remaining 230,579 385 ,599
The correlation coefficient is positive or negative indicating the direction of the relationship between the variables. Furthermore, it can be said that the correlation coefficient should be between -1 and +1, and this correlation is a positive because of the value 0.174. So when the brand personality increases, the consumer ethnocentrism will increase by 0.174. The hypothesis 1, which states that for the Didi brand there is a positive relationship with consumer ethnocentrism, is accepted
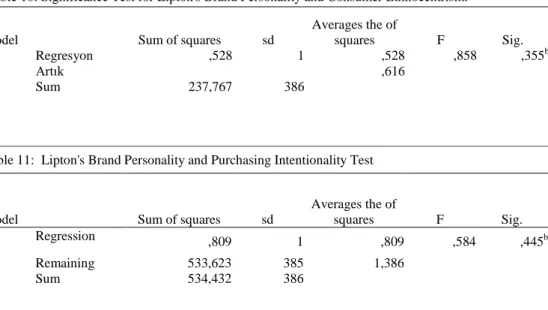
Table 10: Significance Test for Lipton's Brand Personality and Consumer Ethnocentrism.
Model Sum of squares sd
Averages the of
squares F Sig.
1 Regresyon ,528 1 ,528 ,858 ,355b
Artık ,616
Sum 237,767 386
Table 11: Lipton's Brand Personality and Purchasing Intentionality Test
Model Sum of squares sd
Averages the of
squares F Sig.
1 Regression ,809 1 ,809 ,584 ,445b
Remaining 533,623 385 1,386
Sum 534,432 386
Bu modele göre marka kişiliği bağımsız değişkeni tüketici etnosentrizmi de marka kişiliğine ve sabit sayıya bağlı olan bağımlı değişkeni göstermektedir. £ hata terimini belirtir. Yukarıdaki model üzerinden yürütülen regresyon analizi sonuçlarına Tablo 12’de yer verilmiştir.
In Table 10 and Table 11, the significance of the Lipton brand personality and consumer ethnocentrism scales and brand personality and purchase intention were tested to determine their significance and the following linear models were proposed.
Consumer Ethnocentrism = a + b Lipton's Brand Personality + £ Purchase Intention = a + b Lipton's Brand Personality + £
According to this model, brand personality is independent variable consumer ethnocentrism is a dependent variable which depends on brand personality and constant number. £ specifies the error term. The results of the regression analysis conducted on the above model are given in Table 12.
Yapılan regresyon analizi sonucunda, öne sürülen modelin tüketici etnosentrizmine ait sig. değerinin (0,355) ve satın alma niyetine ait sig. Değerinin (0,445) 0,05 değerinden büyük olduğu için anlamlı olmadığı sonucuna varılmıştır.
4.3 Consumer Ethnocentrism in Relation with Purchase Intention
The main purpose of the research is to investigate the relationship between brand personality, consumer ethnocentrism and purchase intention. But it is thought that there is a relationship between consumer ethnocentrism and purchase intention. Therefore, the relationship between these two variables is included in the research model. The relationship between consumer ethnocentrism and purchase intention was measured by correlation analysis and regression analysis was performed to look at whether there is any causality between those variables.
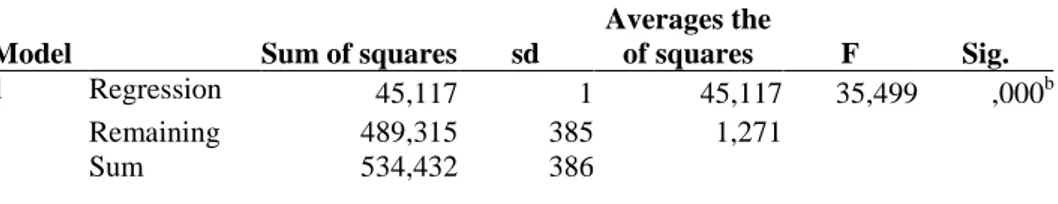
Table 13: Consumer ethnocentrism and purchase intention test
Model Sum of squares sd
Averages the
of squares F Sig.
1 Regression 45,117 1 45,117 35,499 ,000b
Remaining 489,315 385 1,271
Sum 534,432 386
It can be seen that there is a significant relationship between consumer ethnocentrism purchase intention, bythe correlation coefficient and because the significant value (Table 13) is less than 0.05
Table 14: Regression Analysis for the consumer ethnocentrism and purchase intention
Table 12: Regression Analysis of Lipton's Brand Personality, Consumer Ethnocentrism and Purchasing Intention
Bağımlı Değişken R2 Bağımsız Değişkenler B
Std.
Hata t F
Consumer
Ethnocentrism. 0,047 Sabit Terim 3,372 0,193 17,435 0,858
Lipton Marka Kişiliği -0,056 0,060 -0,926
Purchasing Intention 0,039 Sabit Terim 3,221 0,290 11,107 0,584
Dependent Variables R 2 Independent Variables B Std. Hata t F
purchase intention 0,291 Constant Value 1,612 0,241 6,700 35,499
Consumer
Ethnocentrism 0,436 0,073 5,958
According to the established model, Table 14 was examined and the causality was found to be statistically significant. Consumer ethnocentrism affects 0.084 percent of purchasing intentions. Hypothesis 4 is accepted even it is too low value for the model.
RESULTS
Whether it is planned or unplanned, purchasing is a condition that develops due to many factors such as product specifications, brand, where and how the product is produced, the ethnocentric feelings of the consumer, and so on. Especially in today's competitive environment, companies are trying to survive in this competitive environment by increasing the image and reliability of the brands they produce.
Though the effects of trust and image is great in these competition conditions, sometimes the consumer's ethnocentric feelings are more effective on some brands and consumers may feel guilty about buying other imported brands and think that it is a infidelity to their country and their nation in a ethnocentric sense.
In this study, the relationship between the brand personality, which is one of the important components of the brand, and consumer ethnocentrism and purchase intention were examined. In the study, brand personality was specifically analyzed for lipton and didi brands seperatelyThe results obtained can be explained as follows. Didi is an indigenous cold drink brand, and as a result of the research, it is said that the students bought it with ethnocentric feelings and that the brand personality is also an important contribution to this, but even though Lipton is a cold beverage brand with a foreign origin, the brand personality is high, Didi brand has been seen to be preferred rather than Lipton. The relationship between consumer ethnocentrism and purchasing is also found to be a positive and meaningful relationship.
However, the study was conducted only in the cold beverages sector and in developing countries like our country, especially in electronic products, automobile, white goods industry and so on. these nationalist sentiments are
also expected to dominate but this study was restricted by the cold beverages sector because some of these areas are not productive in a global sense and it is thought that it would be costly and time consuming to conduct such research in other production areas.
REFERENCES
Aaker, J. (1997). Dimensions of Personality. Journal of Marketing
Research, Vol: XXXIV, 347-356.
Akın, M., Çiçek, R., Gürbüz, E., & İnal, E. (2009). Tüketici Etnosentrizmi ve Davranış Niyetleri Arasındaki Farklılığın Belirlenmesinde Cetscale Ölçeği. Ege Akademik Bakış, Cilt:9, Sayı:2, 489-512.
Altunışık, R., Coşkun, R., Bayraktaroğlu, S., & Yıldırım, E. (2012).
Sosyal Bilimlerde Araştırma Yöntemleri. Sakarya: Sakarya yayıncılık.
Arı, E. (2007). Satın Alma Kararlarında Tüketici Etnosentrizmi ve Menşe Ülke Etkisinin Rolü, Yüksek Lisans Tezi, Çukurova Üniversitesi, Sosyal Bilimler Enstitüsü. Adana.
Aykaç, Ö. S. (2015). Tüketici Etnosentrizminin Pazarlama Faaliyetlerinin Algılanması Üzerine Etkisi: Sakarya Üniversitesi Örneği, Yüksek Lisans Tezi, Sakarya Üniversitesi, Sosyal Bilimler Enstitüsü. Sakarya.
Borça, G. (2013). Marka ve Yönetimi. Eskişehir: Anadolu Üniversitesi. Dodds, W., Monroe, K., & Grewal, D. (1991). Effects of Price, Brand and Store Information on Buyers' Product Evaluations. Journal of Marketing
Research, Vol. XXVIII, 307-319.
Ergün, İ. (2011). Marka Yönetimi; Markalaşma Aşamalarının İncelenmesi ve Bir Uygulama, Pamukkale Üniversitesi, Mühendislik Fakültesi. Denizli.
Eroğlu, A., & Sarı, S. (2011). Tüketici Etnosentrizmi ve Marka Bağlılığı Arasındaki İlişki. Akdeniz Üniversitesi Uluslararası Alanya İşletme Fakültesi
Dergisi, C.3, S.2, 39-55.
Geuens, M., Weijters, B., & De Wulf, K. (2009). A New Measure of Brand Personality. Intern. J. of Research in Marketing, Vol:26, 97-107.
Mucuk, İ. (2014). Pazarlama İlkeleri. İstanbul: Türkmen Kitabevi. Odabaşı, Y., & Barış, G. (2016). Tüketici Davranışı. İstanbul: Mediacat. Okay, H. (2016). İyi Satıcı Olmak . İstanbul: MediaCat.
Özgüven, N., & Karataş, E. (2010). Genç Tüketicilerin Marka Kişiliği Algılamalarının Cinsiyete Göre Değerlendirilmesi: Mcdonald’s ve Burger King.
Süleyman Demirel Üniversitesi Sosyal Bilimler Enstitüsü Dergisi, Sayı 11,
139-163.
Öztürk, N. (2010). Marka Yönetimi, Yüksek Lisans Tezi, Kadir Has Üniversitesi, Sosyal Bilimler Enstitüsü. İstanbul.
Shimp, T., & Sharma, S. (1987). Consumer Ethnocentrism: Construction and Validation of the CETSCALE. Journal of Marketing Research, Vol. XXIV , 280-289.
Uyar, K. (2014). Tüketici Etnosentrizmi ve Marka İsmi Değerlendirmeleri: Kayseri’de Bir Uygulama, Doktora Tezi, Erciyes Üniversitesi, Sosyal Bilimleri Enstitüsü. Kayseri.
Yağcı, M., & İlarslan, N. (2010). Reklamların ve Cinsiyet Kimliği Rolünün Tüketicilerin Satın Alma Davranışları Üzerindeki Etkisi. Doğuş
Üniversitesi Dergisi,Cilt: 11, Sayı:1, 138-155.
Yazıcıoğlu, Y., & Erdoğan, S. (2014). SPSS Uygulamalı Bilimsel