IC
ON
A
RP
ICONARP
International Journal of Architecture and Planning
Volume 1, Issue 2, pp:152-163
ISSN: 2147-9380
available online at: www.iconarp.com
Jour na l of A rc hite cture a nd Pl an ni ng
Abstract
Due to social, economic and political reasons, informal settlements are considered as a challenging problem in the third world countries. These create problems to the society and to the local government. The present study aims to discuss informal settlements of Latakia city (Syria) during 1970 and 2005 using satellite data. Where based on all the information available, until today the present study is the first one carried out in Syria concerning the development of informal settlements. In this study, we put a headline to solve the informal settlement problem in Latakia city by achievement 4 goals:
• INCORPORATION: This goal requires that the inhabitants of an informal settlement are recognized as full citizens of the city, town or village with which they are associated.
Modelling of Informal
Settlement Growth with
Satellite Data in Latakia
City,Syria
Yahya GHASSOUN
Manfred BUCHROITHNER
Keywords:
Syria, Informal Settlements, Change Vector Analysis, Post Classification
Yahya GHASSOUN* Institute for Geodesy
and Photogrammetry in Braunschweig University of Technology, Germany. *Corresponding Author
Email: [email protected]
Prof. Eur.-Ing. Dipl.-Geol. Dr.phil.habil. Manfred F. BUCHROITHNER is Director
of the Institute for Cartography, Dresden University of Technology E-mail: [email protected]
Int er na ti on al Jour na l of A rc hite cture a nd Pl an ni ng
• IMPROVEMENT: This goal requires an integrated approach to development, that seeks to meet the most important needs of the whole community. It also requires that those needs and priorities are determined by all the stakeholders. The choice of strategies also requires an inclusive process that takes all factors into account.
• DEVELOPMENT: The vital elements of this goal are the provision of opportunities and encouragement.
• PLANNING: This goal includes, Anticipate the future. Identification and addressing the implications for the informal settlements in a comprehensive manner.
We suggested 4 guiding principles to achieve the previous goals: • Integration: Considering the informal settlements as a part of the whole city, is a very important point in the integration process.
• Participation: Participation of people and groups of people with the local authority effectively in a process.
• Communication: communication is the exchange of thoughts, messages, information and meeting between people and the authority. • Minimum relocation: is to provide the people with opportunities to stay and settle, because every move is disruptive and costly.
Also in the present study, dynamics of change in land use/land cover and their impact have been studied. The satellite data (Landsat, IRS, and CORONA) have been used.
This study shows significant classes (Trees, Grass, Buildings, Water, Vacant, Roads) in the land use/land cover which are found to change significantly during 1970 and 2005. Also rapid growth of informal settlements have been observed.
Remote sensing images have been handled using GIS system to visualize the dynamics of the changes in land use/land cover. Finally the physical situation of the informal settlement has been studied and has been organized in three categories (Good, Medium and bad).
INTRODUCTION
Industrial and commercial centralization of cities cause an increase of immigration from rural areas to the cities and also a deterioration of the urban environment. The expansion of the big cities, which are witnessing developments of informal settlements, has to be considered a major problem in Syria where 209 informal settlements exist. They cover an area of 26,600 km². Approx. 30% of the population in urban environments live in these regions. The informal settlements have a high density and are considered overpopulated. The average amounts to about 400 person/km² compared to the population density of 216 person/km² in the formal regions. The major reason for the growth of informal settlements is the migration from rural regions to the cities. This, again, is due to the following facts:
The cost of land in the formal regions is higher than in the surroundings or in the agricultural areas.
Keywords:
“Türk Evi” Kavramı; Sedad Hakkı Eldem, İdealleştirme, Celal Esad. Uğur TUZTAŞI, A Historiographic
Analysis of Idealized Turkish House Idea.
Yrd. Doç.Dr. Cumhuriyet Üniversitesi Mimarlık Fakültesi, Mimarlık Bölümü, Sivas.
eposta: [email protected]
Jour na l of A rc hite cture a nd Pl an ni ng
Most of the people are poor and can therefore not buy land or houses within the formal regions.
Regional planning and economic activities in the rural regions are missing.
The organizational plans, which are requested to arrange the expansion in the cities, and especially in informal settlements, are either absent or they lack updating. In the present study, the authors are concentrating on the growth of Latakia City from 1970 to 2005. Every year the informal settlements grow as fast as the formal settlements.
MATERIALS AND METHODS
In order to achieve the aforementioned goals, suitable and complete data for an integrated analysis of the situation in the urban development are very important. They comprehend satellite data, the topographic map of Latakia City at a scale of 1:50,000 and other secondary data.
The change-detection was carried out using both digital image processing techniques (e.g. post-classification and Change Vector Analysis) and visual interpretation (digitization).
i. In the post-classification technique, two images from
different dates are independently classified. Preliminary classifications are performed on the Landsat TM, 1987 and Landsat ETM, 2000 images.
The classified images are combined to create a new change image classification, which indicated the changes “from” and “to” that took place. The post-classification was carried out using ‘’ERDAS IMAGINE’’ and the change matrix was calculated.
Results:
Figure 1, shows the post-classification (supervised classification) of the two Landsat images. The change matrix based on classified images revealed that significant changes in land use/ land cover classes occurred Table 1.
It was obvious, that buildings and trees classes had increased and the other classes had decreased, especially grass class and that is normal due to the successful agriculture of the orange trees upon the count of grass area (Agriculture & recreational value).
Int er na ti on al Jour na l of A rc hite cture a nd Pl an ni ng Figure 1. Table 1.
Change matrix of image 1987 and 2000.
Where the numbers refer to trees (1), grass (2), water (3), buildings (4), vacant (5) and roads (6).
1987 1 2 3 4 5 6 Total 1987 (Ha) 2000 1 2527.64 675.22 7.15 581.08 28.75 9.91 3829.76 2 1637.49 1744.6 1.22 1512.97 109.57 14.38 5020.27 3 14.70 1.78 54.66 21.36 0.41 6.74 99.66 4 513.26 1168.17 12.26 3839.34 365.84 121.18 6020.07 5 26.64 171.22 4.22 672.38 362.51 15.11 1252.08 6 74.40 47.84 12.18 243.99 8.69 29.40 416.52 Total 2000 (Ha) 4794.14 3808.88 91.70 6871.15 875.76 196.73 Figure 1. Post-classification of Latakia (1987-2000).
155
Jour na l of A rc hite cture a nd Pl an ni ng
It was obvious, that buildings and trees classes had increased and the other classes had decreased, especially grass class and that is normal due to the successful agriculture of the orange trees upon the count of grass area (Agriculture & recreational value).
ii. Change Vector Analysis, Change Vector Analysis (CVA) is
defined as the computation of radiometric differences between two dates in the spectral feature space. CVA uses any number of spectral bands from multi-temporal satellite data to produce change image that yield information about both the magnitude and direction of differences pixel values.
The magnitude of a change vector (CM) is calculated as the Euclidean distance between the two positions. It is a measure for the intensity of the change. The direction of the change is given by the direction angle (CD) of the change vector. It provides information about the nature of change.
CMi = √ ΔI1,i2 + ΔI2,i2 [1]
CDi = arccos ΔI1,I / CMi [2]
CDi = arcsin ΔI2,I / CMi [3]
Results
The CVA was carried out also by using two models in ERDAS Imagine to derive two images representing the direction of change and magnitude of change. The magnitude ranges from 13 to 255o while the angel of direction ranges from 1 to 89o. It was obvious that the direction change was positive.
The supervised classification for both, magnitude of change and direction of change produced five change classes, especially slight, low, medium, high, extreme changes (Figure 2). After calculating the CD and CM, we chose random area inside two of informal settlement regions to plot the charts of CD and CM (Figure 3, 4). It is noticed that the CVA in the first area (Ugarit) was found to be positive in both CD and CM but in the second area (Al Quds) the CM was found to be more than the CD. this is normal because the second area is approximately considered as the closed area in comparison to the first area.
iii. Digitization:
The second method is based on the visual interpretation, which is used for the analysis of three satellite images (Corona 1970, Landsat 1990, IRS 2005). Due to the increase of population of Latakia, construction operation and city expansion increased. MURBANDY method of the analysis of the development of the settlement area has been followed to calculate the settlement area using IRS image of the year 2005. Following equation has been used:
Int er na ti on al Jour na l of A rc hite cture a nd Pl an ni ng A=1/4√B A=1/4√4553956= 1067 m
Where A : the studied area and B : the area of the continuous settlements.
Figure 2.
Figure 3. Figure 2. Change pattern of change
vector analysis (1: Magni tude of change, 2: Direction of change).
Figure 3. Change Vector Analysis
diagram for the Ugari neighborhood.
Jour na l of A rc hite cture a nd Pl an ni ng Figure 4 Results
1. Degree of Urbanization: Following Murbandy method, we have found the urban area within the buffer during 1970 where the residential area were centered in a small area and all the activities (commercial, industrial) were inside the city. The agriculture area was found to be surrounding the residential area.
The rapid growth of population caused regular and irregular rapid growth of residential area upon the account of the agriculture area (Figure 5).
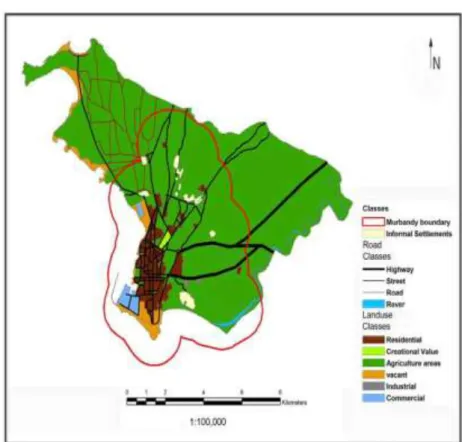
2. Informal Settlements in Latakia: (Figures 6, 7, 8) also show
distribution of the informal settlements areas since 1970 into 2005. It has been noticed that the informal settlements during 1970 were not connected to the formal settlements but due to the rapid development in the formal and informal settlements during 35 years became this areas connected an telescopic together.
CONCLUSION AND RECOMMENDATION
In this study we aim in to investigate the phenomenon of informal settlements in Latakia City and its development from 1970 to 2005 by means of remote sensing and GIS.
At the beginning a method to solve the informal settlements problem has been explaned. This method depends on the communication and participation in decision-making. This is for making a suitable decision to develop and rehabilitating the informal settlements. Also, we stress the importance of using the GIS techniques for decision-making, especially GIS and remote sensing.
Then we concentrated on the informal settlements and their development between 1970-1990-2005, where the results showed a high-speed growth of the buildings class.
Figure 4. Change Vector Analysis
diagram for Al Quds neighborhood
Int er na ti on al Jour na l of A rc hite cture a nd Pl an ni ng 0.000 10,000,000.000 20,000,000.000 30,000,000.000 40,000,000.000 50,000,000.000 60,000,000.000 1970 1990 2005 Residential Creational Value Agriculture areas Vacant Industrial Commercial
Consequently, the informal settlements increased in area, especially on the account of the grass class. In resume, this study showed the following:
Remote sensing techniques offer reasonable classification accuracies for the study area.
There exist a remarkable pattern of change in land use/land cover classes between 1970 and 2005.
GIS present powerful tools to query and analyze the remote-sensing and change-detection results for the study area.
Figure 5.
Figure 6.
Figure 5. Land use classification.
Figure 6.The informal settlements
in Latakia City in 1970 based on classification of Corona Satellite image
al Jour na l of A rc hite cture a nd Pl an ni ng Figure 7. Figure 8.
Figure 7. The informal settlements
in Latakia 1990 based on classification of Landsat TM image.
Figure 8. The informal settlements
in Latakia Ci ty in 2005 based on classification of IRS satellite image
Int er na ti on al Jour na l of A rc hite cture a nd Pl an ni ng REFERENCES
Abbott, J . ITC Sessions 22 – 26 March 2004. Informal Settlement
Upgrading.
Abdalla, N. 2001. “Socio-economic Dimensions of the Habitation
Problem. Syrian Economic Society”.
Adlard, G. Barry, M. Bekker, S. Boshoff, K. Esterhuizen, L. Fourie, A. Hugo, D. Kaschula, N. Kedzieja, M. Keuler, J. Kuhn, J. Lamohr, C. Lotze, H. Louw, T. Muller, N. Muller, W. Nicks, S. Nombembe, M. Olivier, D. Paton, H. Smit, W. Bedderson, S. Boshoff, K. Esterhuizen, L. Fourie, A. Hugo, D. Kedzieja, M .Lamohr, C. Muller, N. Nombembe, M. Paton, H. Smit, H. Walker, N, Adlard, G. (2003). “A Quick Guide to Dealing with
Common Informal Settlement Problems”.
Barry, M. Rüther, H: “Data Collection and Management for
Informal Settlements Upgrades”. International Conference on
Spatial Information for Sustainable Development. Nairobi, Kenya 2–5 October 2001.
Buchroithner, M.(1997). Multimediale Kartographie, “Data
Integration und Information Fusion”. Karographische
Schriften. 2/1997: 31-35.
Cohen, W.B. Fiorella, M., Gray, G., Helmer, E. Anderson,K. (1998). “An efficient and accurate method for mapping forest clearcuts
in the Pacific Northwest using Landsat imagery”. Photo
grammetric Engineering and Remote Sensing, 64: 293-300. European Environment Agency, European Commission/Joint
Research Centre, “Urban sprawl in Europe. The ignored
challenge”, EEA Report No 10/2006.
Foody, G. M. (2001). “Monitoring the Magnitude of Land-Cover
Change around the Southern Limits of the Sahara”.
Photogrammetric Engineering and Remote Sensing, 67(7): 841-847.
Geun-Won Yoon. Young Bo Yun, Jong-Hyun Park. (2003). “Change Vector Analysis: Detecting of areas associated with
flood using Landsat” TM. Spatial Information Technology
Center, Electronics and Telecommunications Research Institute, 161 Gajeong-dong, Yusong-Gu, Daejon, 305-350, KOREA.
Groß, D. (2003). “Development of a semi-automated approach to
map wetland changes in (semi)arid regions, using satellite data”.
Jensen, J. R. (1981). “Urban Change Detection Mapping Using
Landsat Digital Data”. The American Cartographer,
8(2):127-147.
Jensen, J.R ., D. L. Toll. (1982). “Detecting Residential Land-Use
Development at the Urban Fringe”. Photo grammetric
Engineering and Remote Sensing, 48(4): 629-643.
Jour na l of A rc hite cture a nd Pl an ni ng
Hayes, D.J., Sader, S. A. (2001). “Change Detection Techniques for
Monitoring Forest Clearing and Regrowth in a Tropical Moist Forest”. Maine Agricultural and Forest Experiment Station
Misc. Publications, 2463.
Kraus, K., (1999). “Photogrammetry”, Volume II, Ümmler, Bonn. Lambin, E. F., Strahler, A.H. (1994). “Change-vector analysis in
multitemporal space: a tool to detect and categorize land-cover change processes using high temporal-resolution satellite data”. Remote Sensing of Environment 48: 231-244.
Malila, W. A. (1980). “Change vector analysis: An approach for
detecting forest changes with landsat”. In Machine Processing Engineering & Remote Sensing 65(11): 1303-1310.
Pamuk, A. (2006) . “Mapping Global Cities. GIS Methods in Urban
Analysis”.
Payne G (ed.) (1999), “Making Common Ground: Public-private
partnerships in land for housing”, Intermediate Technology
Publications Ltd, London.
Salih Dafalla Mohamed, M. (2006). Mapping Assessment of Land
Use/Land Cover Using Remote Sensing and GIS North Kordofan State, Sudan”.
Singh, A. (1989). “Digital change detection techniques using
remotely-sensed data”. International Journal of Remote
Sensing, 10: 989-1003.
State Planning Commission in Syria.
http://www.planning.gov.sy/en/index.php
UNCHS (1996). “New Delhi Declaration”, Global conference on access to land and security of tenure as a condition for sustainable shelter and urban development. New Delhi, 17-19 January, 17-1996.
UNCHS (Habitat). (1995). “Monitoring the shelter sector. Housing
Indicators review”. Nairobi: United Nations Centre for Human
Settlements.
United Nations Conference on Environment & Development Rio de Janerio, Brazil, 3 to 14 June 1992
United Nations: AGENDA 21
Wesmiller, R. A., S. J. Kristof, D. K. Scholz, P. E. Anuta, and S. A. Momin. (1977). “Change Detection in Coastal Zone
Environments”*, Photo grammetric Engineering and Remote
Sensing, 43(12): 1533-1539.
Wickware, G. M., Howarth P. J. (1981). “Change Detection in the
Peace-Athabasca Delta Using Digital Landsat Data”. Remote
Sensing of Environment, 11: 9-25.
Winkler, M. (2002). “GIS – based, comparative analysis of the
development of five European cities Bilbao – Bratislava – Dresden – Lyon – Palermo”.
Int er na ti on al Jour na l of A rc hite cture a nd Pl an ni ng
Yuan, D. Elvidge,C (1998). “NALC Land Cover Change Detection
Pilot Study”: Washington D.C Area Experiments. Remote Sensing
of Environment, 66: 166-178.
RESUME
Yahya Ghassoun, born in 12 February 1978 in Latakia, is a Civil Engineer and Topographer. He is PhD student as Institute for Geodesy and Photogrammetry in Braunschweig University of Technology, Braunschweig, Germany.
Prof. Eur.-Ing. Dipl.-Geol. Dr.phil.habil. Manfred F. Buchroithner (Born 17 December 1950 in Vienna) is an Austrian cartographer, geologist, and alpine research. Director of the Institute for Cartography, Dresden University of Technology.