Fırat Üniversitesi Sosyal Bilimler Dergisi Fırat University Journal of Social Science Cilt: 22, Sayı: 2, Sayfa: 250-259, ELAZIĞ-2012
A STUDY ON UNIVERSITY STUNDENTS’ PERCEPTION OF SERVICE
QUALITY WITH SERVQUAL MEASUREMENT MODEL
SERVQUAL Ölçüm Modeli İle Üniversite Öğrencilerinin Hizmet Kalitesi Algısı Üzerine Bir
Araştırma
Vural CAGLIYAN
Asir GENC
Tarik YILMAZ
ABSTRACT
Using SERVQUAL (SERVice QUALity) measurement model, this study aims to examine the relations between expectation and perception of university students at Department of Statistics, Faculty of Science Selçuk University with regard to quality of the services university offer to them. SERVQUAL measurement model is a method which is frequently used in literature to measure service quality and the validation of the scale used in this method have been determined in many previous studies. SERVQUAL measurement model and perception of service quality will be examined by Structural Equation Modeling (SEM) and the results will be compared to the results of the previous studies in literature. This study was also undertaken to lay basis for further studies which are going to carried out in different departments at Selçuk University.
Key words: SERVQUAL Scale, Service Quality, Structural Equation Modeling ÖZET
Bu çalışmada Selçuk Üniversitesi Fen Fakültesi İstatistik Bölümü öğrencilerinin, üniversitenin kendilerine sunduğu hizmetlerle ilgi olarak beklenen hizmet ile algılanan hizmet kalitesi arasındaki ilişkilerin SERVQUAL ölçüm modelinden yararlanılarak incelenmesi amaçlanmaktadır. SERVQUAL ölçüm modeli literatürde hizmet kalitesi ölçümünde oldukça sık başvurulan bir yöntem olup yöntemde kullanılan ölçeğin güvenilir ve geçerliliği olan bir ölçek olduğu daha önce yapılan birçok çalışmada ispatlanmıştır. SERVQUAL ölçüm modeli ile algılanan hizmet düzeyi yapısal eşitlik modeli yardımıyla irdelenecek ve elde edilen sonuçların literatürle uyumlu olup olmadığı değerlendirilecektir. Bu çalışma aynı zamanda Selçuk Üniversitesinin ön lisans ve lisans düzeyindeki farklı bölümlerinde yapılacak olan bazı araştırmalara bir temel oluşturması bakımından hazırlanmıştır.
Anahtar kelimeler: SERVQUAL Ölçeği, Hizmet Kalitesi, Yapısal Eşitlik Modeli
INTRODUCTION
The importance of service sector has increased in the world and in Turkey as well. The idea that success in service sector can be obtained by focusing on the basic characteristics of services is common. In other words, service quality is an indication of success. Concordantly, enhancement of service quality is a significant and strategic element which can give competitive edge to corporations.
The sectors with high rate of service are health, entertainment, tourism and education. Concordantly, the aim of this study is to examine the relations between expectations and perceptions of students at statistics department of Science Faculty, Selçuk University which is one of the significant service providers in education sector by using SERVQUAL measurement model.
Corresponding Author: [email protected], Assitance Proffesor Dr., Selcuk University, School of Tourism and Hotel Management, 42075 Konya, Turkey. Phone: +90 332 223 44 27, Fax: +90 332 241 70 47.
Prof. Dr., Selcuk University, Faculty of Science, Statistics, Konya, Turkey. [email protected].
REVIEW OF LITERATURE
While there are various studies in literature on service quality measurement, it can be argued that the first model was proposed by Grönroos (1984). Later on Parasuraman et al. (1988) proposed SERVQUAL model (A Multiple-Item Scale for Measuring Consumer Perceptions of Service Quality) and Cronin and Taylor (1992) proposed SERPERF model and these models are widely accepted in literature. In this context, the model proposed by Parasuraman et al. (1988) was used.
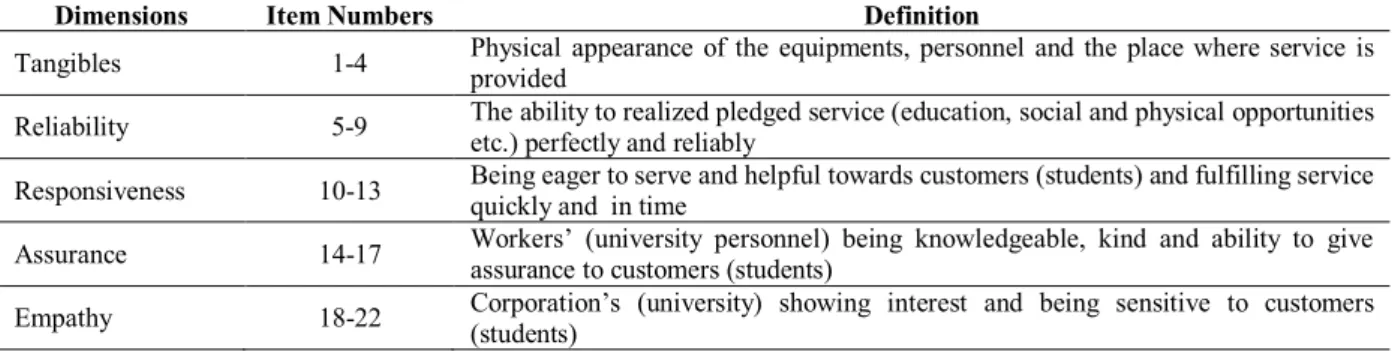
SERVQUAL service quality scale developed by Parasuraman et al. (1988; 1991; 1993) is examined under five basic dimensions and these five dimensions are measured using 22 items. The study is based on the assessment of service quality as a function composed of expectations and perceptions. Therefore, SERVQUAL measurement model is based on the difference between expected quality and perceived quality. Concordantly, five basic dimensions of SERVQUAL scale and their explanations are given in Table 1 below. Authors consider that these dimensions and thus the questions used in the measurement of these dimensions define the basic areas of service quality and that they can be adapted to various service factors.
Table 1. SERVQUAL Scale and Dimensions
Dimensions Item Numbers Definition
Tangibles 1-4 Physical appearance of the equipments, personnel and the place where service is provided
Reliability 5-9 The ability to realized pledged service (education, social and physical opportunities etc.) perfectly and reliably
Responsiveness 10-13 Being eager to serve and helpful towards customers (students) and fulfilling service quickly and in time
Assurance 14-17 Workers’ (university personnel) being knowledgeable, kind and ability to give assurance to customers (students)
Empathy 18-22 Corporation’s (university) showing interest and being sensitive to customers (students)
Source: Parasuraman et al.,1988.
METHODOLOGY OF THE STUDY
In this section of the study, information about the aim, hypotheses, method and findings of the study carried out on university students using SERVQUAL measurement model is given. Besides, the statistical significance of the results of the study will be assessed and the hypotheses accuracy will be tested.
The method of the Study and Sample
In this study, questionnaire method was used to collect data set and the questionnaire was administrated to the students of Statistics Department at Faculty of Science at Selçuk University.
In the study, data was collected via face-to face interviews with respondents (students) using a standard questionnaire form based on SERVQUAL scale. The scale form is composed of two parts. In the first part of the questionnaire, there are questions to determine demographic characteristics of the respondents. In the second part, there are questions prepared considering SERVQUAL scale. The responds of the items in the scale were designed in 5 point Likert type where ‘1’ means ‘I completely disagree’ and ‘5’ means ‘I completely disagree’.
In the study, convenience sampling method which was also used in similar studies (Cui et al., 2003; Zhou, 2004) was used to determine the students to participate the study. Convenience sampling is preferred as it allows reaching large amount of information rapidly (Nakip, 2003).
EFA (Exploratory Factor Analysis) and CFA (Confirmatory Factor Analysis) which were employed in data analysis are very sensitive to the number of sample and their fundamental assumption is that data show multiple normal distributions. In the calculation of adequate size of
sample for data to show normal distribution, each item in the scale is to be answered by at least ten respondents (Hair et al., 1998). In this context, as the number of parameters in the measurement model is 22, sample size is to be at least 220. On the other hand, Hoyle (1995) stated that minimum sample size is to be 250 for confirmatory factor analysis. When these two rules are considered, it can be said that the sample which is composed of 592 people (There are a total of 642 students in the Statistics Department, 592 questionnaire form equals to 92% return rate) is adequate.
The Hypotheses of the study
In order to realize the aims of the study, EFA and CFA were used in the study. Jöreskog and Sörbom (1993) state that using EFA and CFA together will increase the reliability of results. Besides, CFA is becoming increasingly popular in social sciences as it tests more hypotheses than explanatory approach in data analysis (Byrne, 2001). As CFA allows testing hypothesis about a certain factor construction, in line with literature the aims of the study were converted into following hypotheses:
H1 : “SERVQUAL is five-dimension scale.”
H2 : “SERVQUAL is statistically valid and reliable scale.”
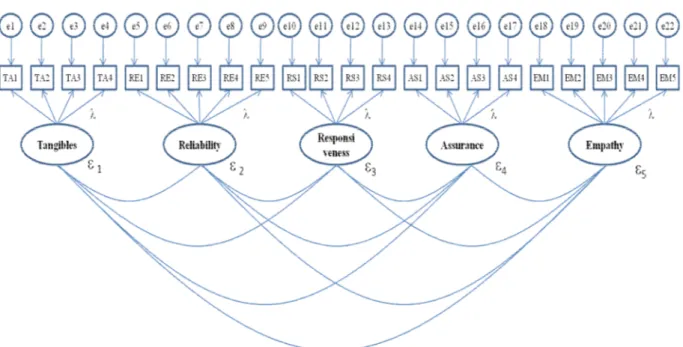
The model developed for CFA to test hypotheses is shown in Figure 1. According to SERVQUAL measurement model (Figure 1.), the scale is composed of five dimensions, namely; tangibles, reliability, responsiveness, assurance and empathy. There are significant correlations between all structures. In this model, shows regression weight and n shows latent variable errors.
Figure 1. SERVQUAL Measurement Model
FINDINGS OF THE STUDY
The Characteristics of the Sample
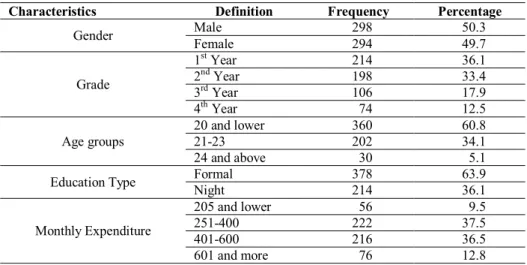
In this part of the study, first of all the demographic characteristics of the students in the scope of the study are assessed with the help of Table 2.
Table 2. Demographic Characteristics of the Sample
Characteristics Definition Frequency Percentage
Gender Male 298 50.3 Female 294 49.7 Grade 1st Year 214 36.1 2nd Year 198 33.4 3rd Year 106 17.9 4th Year 74 12.5 Age groups 20 and lower 360 60.8 21-23 202 34.1 24 and above 30 5.1
Education Type Formal 378 63.9
Night 214 36.1 Monthly Expenditure 205 and lower 56 9.5 251-400 222 37.5 401-600 216 36.5 601 and more 76 12.8
It is seen that the distribution of the participating students in terms of gender is very close to each other. When education levels are considered, it can be said that the more students from formal education group participated to the study (63.9%). 36.1% of the first-year students participated into the study and 33.4% of the second-year students participated to the study. The participation rate of the third and fourth years students is 30.4%. When age groups of the students are considered, it is seen that 60.8% of the participants are 20 or lower than 20 years old. The monthly expenditures of the students vary and the largest group of the students spend 251-400 TL (37.5%) and 401-600 TL (36.5%).
Analysis Results with Regard to the Model
In the analysis of the data in the study, firstly EFA and then One Order Confirmatory Factor Analysis-CFA was employed to confirm the dimensions determined with EFA and to test the validity and reliability of the measurement model. This study was carried out using SPSS 15.0 and AMOS 6.0.
EFA
The procedure used in EFA to determine dimensions of the measurement model identified in the theory is given below.
Before starting EFA, KMO value which shows the appropriateness of sample size for factor analysis was calculated. KMO value is 0.958, which is above 0.50 (Chong and Rundus, 2004). This indicates that our sample is adequate for factor analysis. Besides, according to Bartlett’s Sphericity Test which determines the appropriateness data for factor anaylsis, it was calculated that 2=8859.83 and p<0.05 (Table 3). Bartlett’s test value which shows the relation between variables for the scale is high. It signifies a significant relation between variables at significance level of α=0.05. These results indicate that data is appropriate for EFA.
Basic components analysis and varimax rotation method was applied in EFA, factors with eigen value higher than 1 and with factor load higher than 0.50 were chosen to find the most appropriate solution (Nunnally, 1978; Sakakibara et al., 1993). When Table 3 is examined, it is seen that all dimension in the scale have eigen value higher than 1 and their factors loads are higher than 0.50. According to these results, it can be said that the model which seeks to measure service quality is composed of five dimensions and each scale in the model measures a certain structure and thus the scale has constructive validity. When total explained variance are examined, it was determined that measurement model accounts for 69.94% of service quality.
In Table 3, Cronbach alpha coefficients (α) which shows inner consistency of each construct and the variances(VE) they explain are given. In the assessment of the validity (inner consistency), the most common method is Cronbach alpha test and it is preferred that the coefficient be higher than 0.70 (Cronbach, 1951; Reynaldo and Santos, 1999; Gliem and Gliem, 2003). When alpha coefficients in all dimensions in the model are examined, it is seen that inner consistency of scales is high. This result indicates that sub-dimensions of measurement model are reliable and that it most probably measures the feature it is intended for. According to these results, it was determined that SERVQUAL model has five dimensions as mentioned in the theory.
Table 3. EFA Results SERVQUAL
Factors Item No Factor
Loads Empathy
(α=.89; VE=16.735%; Eigen value=3.682)
School directors show individual care for students. 0.666 School workers show individual care for students. 0.703
School workers know student needs. 0.713
School workers take sincere care for customers. 0.720 School provides service to all students at appropriate hours. 0.544
Reliability
(α=.87; VE=15.432%; Eigen value=3.395)
School keeps its word when it promises to provide a service in a certain period of time. 0.705 When students come across a problem, school solves this problem. 0.788
School is reliable. 0.678
School provides every kind of service in time. 0.691
School keeps records correctly. 0.544
Responsiveness
(α=.85; VE=13.246%; Eigen value=2.914)
School informs students about the time they will provide service. 0.601 School workers provide service immediately. 0.697 School workers are always ready to help students. 0.681 School workers are not too busy to hamper student requests 0.626
Assurance
(α=.88; VE=12.522%; Eigen Value=2.755)
School workers give assurance to students. 0.583 When students receive service from a school, they feel secure. 0.694
School’s workers are kind. 0.697
School’s workers have adequate level of knowledge. 0.627
Tangibles
(α=.84; VE=12.001%; Eigen Value=2.640)
School has modern materials and technology. 0.541 The physical environment of the school is visually attractive. 0.693
School’s workers are well groomed 0.646
School’s physical appearance is suitable for the service it provides. 0.636 N = 592; KMO = 0.958; Bartlett’s Sph. 2= 8859.825; p = 0.000; Total explained Variance = 69.94%;
Factor Loads ≥ 0.50
The method with three steps is used for the analysis of the data which is collected by SERVQUAL scale. These steps are as being follows (Aydın, 2005):
1. Item-Item Analysis: Let be P=Perception and E=Expectation, by using the method (P1-E1, P2-E2,
P3-E3,….), the difference between each perception and expectation is found. The level of the quality of the service is determined by this method for each expression. If the result is positive, then it means the customers are happy, but if the result is negative, then it means the customers are not happy which means the service being given is not enough and quality one.
2.Factor-Factor Analysis: With the application of [(P1+P2….P22)/22 –(E1+E2….E22)/22] for both
perception and expectation, every answers which are given for all level expressions are added and the sum is divided to the number of expressions, therefore the average can be found for each level. The quality of the service level can be determined by taking the difference between average points of the levels.
3. Servqual GAP: With the application of [(P1+P2….P22)/22 –(E1+E2….E22)/22], the sum of points
for both perception and expectation is divided by the sum of the number of the expressions. The average of the service quality level can be determined by doing this procedure.
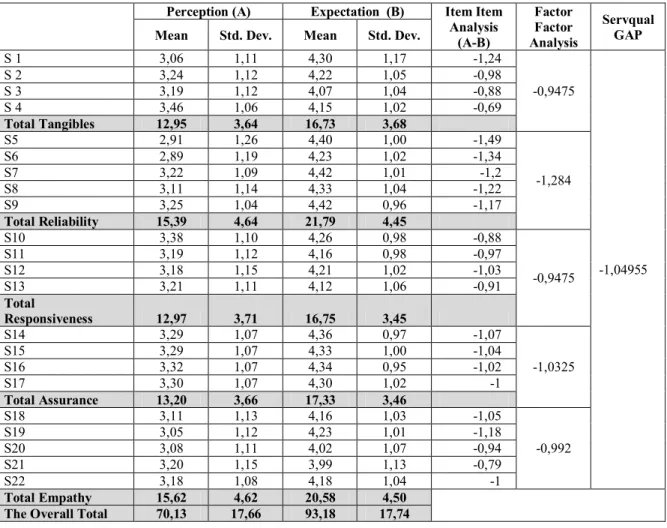
Table 4 is the summary of the data which is collected from Selcuk University, Faculty of Science, Department of Statistic students. This research is aimed to find out level of satisfaction of the students about the quality of the service which is provided by the university. The data in the Table X is found by using SERVQUAL method. For the evaluation of the student responses, Likert scale is used such as ‘1’=‘strongly disagree’ ve ‘5’=‘strongly agree’
Table 4. The Measurement Results on Levels of Perception and Expectation of Students
Perception (A) Expectation (B) Item Item
Analysis (A-B) Factor Factor Analysis Servqual GAP
Mean Std. Dev. Mean Std. Dev.
S 1 3,06 1,11 4,30 1,17 -1,24 -0,9475 -1,04955 S 2 3,24 1,12 4,22 1,05 -0,98 S 3 3,19 1,12 4,07 1,04 -0,88 S 4 3,46 1,06 4,15 1,02 -0,69 Total Tangibles 12,95 3,64 16,73 3,68 S5 2,91 1,26 4,40 1,00 -1,49 -1,284 S6 2,89 1,19 4,23 1,02 -1,34 S7 3,22 1,09 4,42 1,01 -1,2 S8 3,11 1,14 4,33 1,04 -1,22 S9 3,25 1,04 4,42 0,96 -1,17 Total Reliability 15,39 4,64 21,79 4,45 S10 3,38 1,10 4,26 0,98 -0,88 -0,9475 S11 3,19 1,12 4,16 0,98 -0,97 S12 3,18 1,15 4,21 1,02 -1,03 S13 3,21 1,11 4,12 1,06 -0,91 Total Responsiveness 12,97 3,71 16,75 3,45 S14 3,29 1,07 4,36 0,97 -1,07 -1,0325 S15 3,29 1,07 4,33 1,00 -1,04 S16 3,32 1,07 4,34 0,95 -1,02 S17 3,30 1,07 4,30 1,02 -1 Total Assurance 13,20 3,66 17,33 3,46 S18 3,11 1,13 4,16 1,03 -1,05 -0,992 S19 3,05 1,12 4,23 1,01 -1,18 S20 3,08 1,11 4,02 1,07 -0,94 S21 3,20 1,15 3,99 1,13 -0,79 S22 3,18 1,08 4,18 1,04 -1 Total Empathy 15,62 4,62 20,58 4,50
The Overall Total 70,13 17,66 93,18 17,74
Notes: S 1= School has modern materials and technology; S 2= The physical environment of the school is visually attractive;
S 3= School’s workers are well groomed; S 4= School’s physical appearance is suitable for the service it provides; S5= School keeps its word when it promises to provide a service in a certain period of time; S6= When students come across a problem, school solves this problem; S7= School is reliable, S8= School provides every kind of service in time; S9= School keeps records correctly; S10= School informs students about the time they will provide service; S11= School workers provide service immediately; S12= School workers are always ready to help students; S13= School workers are not too busy to hamper student requests; S14= School workers give assurance to students; S15= When students receive service from a school, they feel secure; S16= School’s workers are kind; S17= School’s workers have adequate level of knowledge; S18= School directors show individual care for students; S19= School workers show individual care for students; S20= School workers know student needs; S21= School workers take sincere care for customers; S22= School provides service to all students at appropriate hours.
When the Table 4 is analyzed, the satisfaction of the students about the quality of the university service is seen relatively high. Although the perception of the students is relatively high, it can be said that the university does not meet all of the students’ expectations. The evaluation by using SERVQUAL method the results of Item-Item Analysis, Factor-Factor Analysis and Servqual GAP is seen negative. As a result, it can be said that the university does not meet students’ expectations.
CFA
CFA which is used to correct factors or dimensions defined in EFA and to test scale’s reliability and validity calculates some values indicating statistical significance of the model proposed. In the study, all values calculated by CFA are calculated after modifications proposed by AMOS 6.0 program are shown in Table 5.
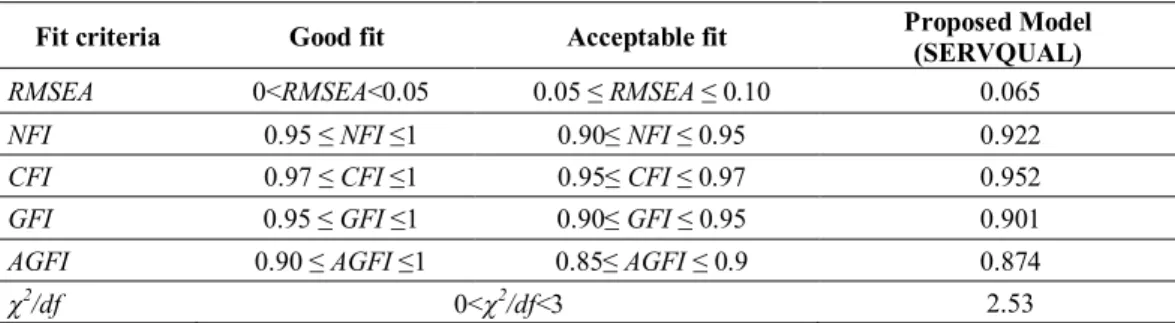
Table 5. Goodness of Fit Indexes of the Proposed Model
Fit criteria Good fit Acceptable fit Proposed Model
(SERVQUAL)
RMSEA 0<RMSEA<0.05 0.05 ≤ RMSEA ≤ 0.10 0.065
NFI 0.95 ≤ NFI ≤1 0.90≤ NFI ≤ 0.95 0.922
CFI 0.97 ≤ CFI ≤1 0.95≤ CFI ≤ 0.97 0.952
GFI 0.95 ≤ GFI ≤1 0.90≤ GFI ≤ 0.95 0.901
AGFI 0.90 ≤ AGFI ≤1 0.85≤ AGFI ≤ 0.9 0.874
2/df 0<2/df<3 2.53
Source: Schermelleh et al. 2003.
The value which tests the statistical appropriateness of the model proposed in CFA and analysis data is 2 (Jiang et al., 2002: 148). 2 value tests whether covariance matrix of population equals to covariance matrix applied to the model. If absence hypothesis is correct, solution is found with minimum 2value. It is convenient that 2 value be low and significant (p) should be bigger than 0.05. However, as this value is sensitive to sample size and as it will reach to high 2 value with larger samples, it seems to be more appropriate to use freedom degree (df) and corrected 2/df value
(Mantel,1963: 691). As2 value found for the sample used in this study (N=592) is high for the model (SERVQUAL 503.47), df corrected 2 value was taken into consideration. 2/df value which is to be
between 0-3 (Mantel,1963: 691) was found to be 503.47/199=2.53 for SERVQUAL measurement model and the model is statistically significant.
On the other hand, only one statistical significance test is not enough to correctly identify a model obtained from CFA and structural equation modeling data. There are many criteria to be considered (Schermelleh et al., 2003: 31). Therefore, other statistical significance tests and (goodness of fit indexes) and acceptable limits are given in Table 5. Goodness of fit measures the conformity of input matrix predicted from the proposed model (covariance or correlation) or the consistency of the model with empirical data (Hair et al., 1998; Schermelleh et al., 2003: 31). The goodness of fit indexes
RMSEA, NFI, CFI, GFI, AGFI of the model are within acceptable limits. (Table 5). Following from
here, it is understood that it is consistent with the empirical data used in the analysis of the model. In other words, it is seen that the model is statistical valid. In this case, the hypothesis (H1) which
proposes that SERVQUAL is five-dimension scale and the hypothesis (H2) that the scale is statistically
reliable and valid are confirmed.
Construct Reliability and Explained Variance
After the model developed for SERVQUAL is tested for statistical validity, just as in EFA, the reliability values and explained variances for CFA are to be calculated separately for sub-dimensions which make up the perceived service quality.
The sub-dimensions which make up the construction of perceived service quality are given in Table 5. Opposite each dimension (construct) reliability values and the variances they explain are given in parenthesis.
The dimensions in EFA were also determined for CFA. Construct reliability (ρη) and explained
variance (VE = ρVC(η)) were calculated. Construct reliability is to be ρη≥0.70 and explained variance is
to be VE>0.50 (Fornell ve Larcker, 1981: 45-46; Jiang et al., 2002: 153). When Table 5 is examined, it is seen that the construct reliability values of the sub-dimensions which make up measurement model are higher than 0.70 and explained variances are higher than 0.50. Accordingly, it is confirmed that the inner consistencies and structural explanation powers of perceived service quality structure of the model.
On the other hand, estimated standardize regression coefficients for sub-dimensions which make up SERVQUAL model and t values and p significance levels of these coefficients are given in Table 6. For all coefficients p significance levels were found to be 0.000. It is seen that standardize regression coefficients calculated for the model at 0.05 significance level are statistically significant and can be used to interpret construct and dimensions.
Table 6. CFA Results SERVQUAL
Dimensions Item No Std. Reg.
Weight. T p
Empathy
(ρη=0.887;
VE=0.613)
School workers take sincere care of the customers. 0.757 14.952 <0.001 School workers know students’ need. 0.825 15.661 <0.001 School workers show individual care to students. 0.843 16.027 <0.001 School directors show individual care to students. 0.846 15.935 <0.001 School provides service to all students at proper hours. 0.620 - -
Assurance
(ρη=0.878;
VE=0.643)
School workers are kind. 0.752 18.207 <0.001 Students feel secure when they receiving service from school. 0.865 20.010 <0.001 School workers give assurance to students. 0.837 19.470 <0.001 School workers have adequate level of information. 0.747 - -
Reliability
(ρη=0.869;
VE=0.577)
School provides every kind of service in time. 0.789 13.321 <0.001
School is reliable. 0.711 12.543 <0.001
When students come across a problem, school solves their problems. 0.895 13.616 <0.001 When school promises to do a service at a certain time , it keeps it
word. 0.812 13.205 <0.001
School keeps records correctly. 0.543 - -
Tangibles
(ρη=0.844;
VE=0.576)
School workers are well-groomed 0.780 16.759 <0.001 School’s physical environment is visually attractive. 0.719 15.451 <0.001 School has modern materials and technology. 0.818 17.187 <0.001 School’s physical appearance is suitable for the service it provides. 0.713 - -
Responsiveness
(ρη=0.850;
VE=0.590)
School workers are always willing to help students. 0.789 16.614 <0.001 School workers provide service immediately when needed. 0.898 16.683 <0.001 School informs students about the time of the service it is going to
provide. 0.698 14.445 <0.001
School workers are not too busy to hamper students’ requests. 0.666 - -
Convergence and Divergence Validity
Finally, the convergence and divergence validities of the constructs are to be calculated in CFA. Convergence validity means that the variables or sub-dimensions which make up construct validity have high and uniform correlation among themselves and divergence validity means that these dimensions have to a certain extend high correlation and low uniformity (Mantel, 1963: 691). In other words, sub-dimensions which measure a construct are to have a certain level of correlation among themselves to be a part of this construct and on the other hand they are to be different from each other so that each dimension exists itself.
In Convergence validity, the variance explained by basic condition structures is to be larger than 0.50 (Jiang et al., 2002: 153). As VE>0.50 for the constructs related with SERVQUAL model, the convergence validity of the structures were achieved (Table 6).
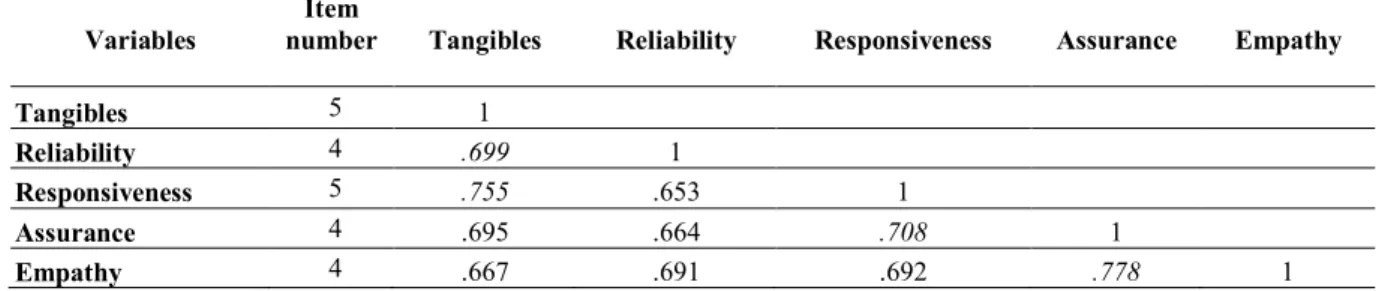
In Table 7, correlation between dimensions is given in Table 6 to show divergence validity of the sub-dimensions in SERVQUAL model. To achieve divergence validity, it is neccessary that variance explained for a dimension is to be bigger than the largest correlation coefficient’s square VE>
Highest . Cor.² (
VC
2) (Fornell ve Larcker, 1981: 46).Table 7. Correlation Coefficients Between Dimensions Variables
Item
number Tangibles Reliability Responsiveness Assurance Empathy
Tangibles 5 1
Reliability 4 .699 1
Responsiveness 5 .755 .653 1
Assurance 4 .695 .664 .708 1
Empathy 4 .667 .691 .692 .778 1
The italic coefficients in Table 7 express the highest correlation between constructs. This case is clearly seen in Table 8.
Table 8. Divergence Validity of Dimensions SERVQUAL
Dimensions VE (Highest Cor.)² (Highest Cor.)²
Tangibles 0.576 (0.755)² 0.570
Reliability 0.577 (0.699)² 0.489
Responsiveness 0.590 (0.755)² 0.570
Assurance 0.643 (0.708)² 0.501
Empathy 0.613 (0.778)² 0.605
In Table 8, it is seen that the variances the constructs explain are bigger than the square of the highest correlations between themselves. According to these results, the constructs of both models are diverge from one another, in other words divergence validity is achieved.
CONCLUSION
One of the main purpose of this study was to determine the perception of the students’ satistaction about the quality of the service provided by the university by using SERVQUAL method. As a result, it can be said that although the level of the perception of the students seems relatively high, the university does not meet all of the students’ expectations (Table 4).
Another purpose of this study was to discuss if it is possible to apply SERVQUAL method which include five levels on education field. According to the results of EFA and CFA, the validity and reliability of SERVQUAL measurement model was confirmed once more in another culture. According to the results, SERVQUAL is a five-dimension model which can be used to measure service quality in further studies and the results also supports previous studies on this issue.
In this study, we showed special care to avoid any mistake in the research and measurement so that the results can be robust and reliable. Therefore, researchers interested in this subject can carry out studies with larger samples and in different sectors. In this way, they can contribute to the literature about this subject and to the results of this study.
REFERENCES
Aydın K (2005). Hizmet İşletmelerinde SERVQUAL Yöntemi İle Hizmet Kalitesinin Ölçümü ve Kocaeli’ndeki Seyahat İşletmelerinden Efe Tur Uygulaması. Sosyal Siyaset Konferansları Dergisi. Sayı: 50.
Byrne BM (2001). Structural Equation Modeling with AMOS: Basic Concepts, Applications, and Programming. Lawrence Erlbaum Associates Publishers. New Jersey.
Chong VK and Rundus MJ (2004). Total Quality Management, Market Competition and Organizational Performance. The British Accounting Review. 36(2). 155-172.
Cronbach LJ (1951). Coefficient alpha and the internal structure of tests. Psychometrika. 16. 297-334.
Cronin JJ Jr. and Taylor SA (1992). Measuring Services Quality: A Reexamination and Extension. J. of Marketing, 56(3), 55-68.
Cui CC, Lewis BR and Park W (2003). Service Quality Measurement in The Banking Sector in South Korea, Int.J. of Bank Marketing, 21(4), 191-201.
Fornell C and Larcker DF (1981). Evaluating Structural Equation Models with Unobservable Variables and Measurement Error. J. of Marketing Research. 18(1). 39-50.
Gliem JA and Gliem RR (2003). Calculating, Interpreting, and Reporting Cronbach’s Alpha Reliability Coefficient for Likert-Type Scales. Midwest Research to Practice Conference in Adult, Continuing, and Community Education. 82-86.
Grönroos C (1984). A Services Quality Model and Its Marketing Implications, European J.l of Marketing, 18(4), 36-44.
Hair JF Jr., Andreson RE, Tahtam RL and Black WC (1998). Multivariate Data Analysis.Fifth Edition Prentice-Hall International Inc, New Jersey.
Hoyle RH (1995). Structural Equation Modeling: Concepts, Issues and Applications. Sage Publication Inc. London.
Jiang JJ, Klein G and Carr C (2002). Measuring Information System Service Quality: SERVQUAL from the Other Side. MIS Quarterly., Vol. 2. No. 2.145-166.
Jöreskog KG and Sörbom D (1993). LISREL 8: Structural Equation Modeling with the SIMPLIS Command Language. Scientific Software International. Lincolnwood.
Mantel N (1963). Chi-Square Tests with One Degree of Freedom; Extensions of the Mantel- Haenszel Procedure. J. of the American Statistical Association. Vol.58(303). 690-700.
Nakip M (2003). Marketing Research Techniques and Applications (SPSS Support). Seçkin Yayıncılık. Ankara. Nunnally JC (1978). Psychometric Theory. McGraw-Hill. New York.
Parasuraman A, Zeithaml VA and Berry LL (1988). SERVQUAL: A Multiple-Item Scale for Measuring Consumer Perceptions of Services Quality, J. of Retailing, 64(1), 12-40.
Parasuraman A, Zeithaml VA and Berry LL (1991). Refinement and Reassessment of the SERVQUAL Scale. J. of Retailing. 67(4). 420-450.
Parasuraman A, Zeithaml VA and Berry LL (1993). Research Note: More on Improving Service Quality Measurement. J. of Retailing, 69(1). 140-147.
Reynaldo J and Santos A (1999). Cronbach's Alpha: A Tool for Assessing the Reliability of Scales. J. of Extension. Vol. 37(2).
Sakakibara S, Flynn BB and Schroeder RG (1993). A Framework and Measurement Instrument for Just-in-Time Manufacturing. Prod. and Oper. Manag. 2(3). 177-194.
Schermelleh EK., Moosbrugger H and Müler H (2003). Evaluating the Fit of Structural Equation Models: Tests of Significance and Descriptive Goodness-of-Fit Measures. Methods of Psychological Research Online. 8(2). 23-74.
Zhou L (2004). A Dimension-Specific Analysis of Performance only Measurement of Service Quality and Satisfaction in China’s Retail Banking. J.of Services Marketing. 18(7).534-546.