Automated Construction of Fuzzy Event Sets and
Its Application to Active Databases
Yücel Saygin and Özgür Ulusoy
Abstract—Fuzzy sets and fuzzy logic research aims to bridge
the gap between the crisp world of math and the real world. Fuzzy set theory was applied to many different areas, from control to databases. Sometimes the number of events in an event-driven system may become very high and unmanageable. Therefore, it is very useful to organize the events into fuzzy event sets also introducing the benefits of the fuzzy set theory. All the events that have occurred in a system can be stored in event histories which contain precious hidden information. In this paper, we propose a method for automated construction of fuzzy event sets out of event histories via data mining techniques. The useful information hidden in the event history is extracted into a matrix called sequential proximity matrix. This matrix shows the proximities of events and it is used for fuzzy rule execution via similarity based event detection and construction of fuzzy event sets. Our application platform is active databases. We describe how fuzzy event sets can be exploited for similarity based event detection and fuzzy rule execution in active database systems.
Index Terms—Active databases, fuzzy event sets, fuzzy rule
exe-cution, fuzzy triggers, similarity based event detection.
I. INTRODUCTION
T
HE fuzzy set theory introduced by Zadeh [1] has been utilized in many areas of research, from control to databases and expert systems [2]–[4]. Fuzzy rules in expert systems and control that make use of the concepts in fuzzy sets were proven to increase the flexibility and effectiveness of the systems. Special inferencing mechanisms have been developed for fuzzy control to be used to infer a fuzzy conclusion from a set of fuzzy rules [2].Modularization of rules is an important research issue in ac-tive database management systems (ADMSs). In systems where thousands of events may occur and thousands of rules may be fired by these events, it is really very difficult to keep track of the rules. Therefore, partitioning the whole event space into smaller groups would be helpful in controlling the rules fired by those events. Partitioning the event space enables the users of the system to concentrate on a smaller group of related events, increasing the efficiency and effectiveness of the system.
Consider the demand side management of an electricity pro-ducing and selling company where the power consumption in-formation of individual companies is stored in a history. Con-sider also that there are hundreds of companies, which is usually the case and each company has more than two power
consump-Manuscript received October 20, 2000; revised December 4, 2000. This work was supported by the Research Council of Turkey (TÜB˙ITAK) under Grant EEEAG-246.
The authors are with the Department of Computer Engineering, Bilkent University, Ankara, 06533 Turkey (e-mail: [email protected]; [email protected]).
Publisher Item Identifier S 1063-6706(01)02818-1.
tion events, like low, medium, high power consumption. The number of events in the system can easily become unmanage-able. If there were a way to divide the whole event space into subsets and deal with each subset individually, the job of the power dealers would be much easier.
Classification of rules by using semantic constraints in an ac-tive database system is considered before by Baralis et al. in [5]. This process is called stratification. Event-based stratifica-tion techniques aim to modularize the rules by classifying the event space that is done by human interaction and cannot be used when semantic knowledge of events is not available. The rule modularization approach of Baralis et al. is based on semantic techniques and it is not automated. However, it is always desir-able to automate this process whenever possible. In this paper, we deal with the problem of automated rule modularization by partitioning the events that trigger the rules. Our model for mod-ularizing rules is based on the analysis of past occurrences of events which are stored in a time based event history. We pro-pose an incremental method for event history analysis based on a sliding window approach. With the sliding window approach, the whole event history is traced and only the events in the cur-rent window are considered for determining the proximity of events. The window advances one event at each iteration. This is where the name “sliding window” comes from. The informa-tion in an event history is extracted into a matrix, called a
se-quential proximity matrix, which is an matrix, where is the number of events in the system.
We use graph partitioning techniques for dividing the event space using sequential proximity matrix into subsets. These sub-sets are modeled as fuzzy sub-sets, therefore, we call them fuzzy event sets. Each event has a degree of membership to a fuzzy event set. Similarity based event detection was proposed as a useful method in an event-based system [6]. Fuzzy event sets are considered to be the basis of similarity based event detec-tion and fuzzy rule execudetec-tion in active databases which is our application platform. Similarity based event detection method of [6] assumes that similarities of the events are available by do-main knowledge of experts. In this paper, we propose a method for extracting the similarities from event histories. This is a new idea for enabling similarity based event detection. By utilizing fuzzy event sets, we introduce the benefits of fuzzy set theory to active database rule modularization and rule execution. We also describe a new rule execution model based on fuzzy event sets that gives more flexibility to rule execution.
Main contributions of our work can be summarized as: 1) automated construction of relationships among events via
a sliding window algorithm for mining event histories; 2) partitioning the event space into fuzzy event sets for rule
modularization, using graph partitioning techniques;
3) enabling a new event detection and rule execution model utilizing the fuzzy event sets. The new model allows us to perform:
a) similarity based event detection;
b) fuzzy rule execution and rule prioritization. The rest of the paper is organized as follows. In Section II, we provide the necessary background and related work on ac-tive databases and data mining. We explain the concept of event histories and introduce an algorithm for mining event histories in Section III. In Section IV, we describe the construction of fuzzy event sets using a graph partitioning algorithm for di-viding the event space into fuzzy event sets. In Section V, we describe similarity based event detection using sequential prox-imity matrix. We also describe scenario-based rule execution in active databases. We present how fuzzy event sets can be used for fuzzy rule execution via rule scenarios. Finally, in Section VI we summarize the results and discuss the future work.
II. BACKGROUND ANDRELATEDWORK
Before getting into the problem of fuzzy event set construc-tion and its applicaconstruc-tion to active databases, we should describe active databases and explain how they differ from conventional databases. Active databases, as our application platform, are dis-cussed in Section II-A. As we use data mining techniques for extracting fuzzy event sets, we also provide the necessary back-ground on data mining in Section II-B.
A. Active Databases
ADBMSs can be considered as an extension of conventional database management systems, in such a way that the data-base system can respond to the state changes in datadata-base by automatically executing some actions. The production rule con-cept in artificial intelligence was modified for the active data-base context so that rules can respond to state changes caused by database operations [7]. Expert systems and ADBMSs are very much related in that they are both based on the concept of rules although their rule structures are different. Fuzzy con-cepts were integrated into expert systems and database systems [3], [8]–[11], and it was previously shown that incorporation of fuzzy concepts into databases is desirable and does solve the problems of uncertainty and inherent fuzziness of acquired data [12], [13]. The use of fuzziness in active database context which extends the standard databases by rules was also shown to be useful [14], [15], [6]. In a typical ADBMS, system responses are declaratively expressed using event-condition-action (ECA) rules [16]. An ECA rule is composed of an event that triggers the rule, a condition describing a given situation, and an action to be performed if the condition is satisfied. Primitive events can be combined to form composite events. Composition of prim-itive events can be done with various event constructors, like conjunction, disjunction, or closure. Coupling modes between event and condition, and between condition and action deter-mine when the condition should be evaluated relative to the oc-currence of the event, and when the action should be executed relative to the satisfaction of the condition, respectively. Rules can be executed sequentially or concurrently depending on the
underlying application [17]. An abstract ECA rule for electricity producing and selling company is given below:
Event: Power consumption of company is high;
Condition: If the temperature and humidity is high and
is a major customer;
Action: Increase the production and the price of electricity.
In this example, we can see that the event itself is fuzzy. Wolski and Bouaziz [14] adopted the fuzzy rules and fuzzy inferencing techniques in fuzzy control theory to the rules in ADBMSs and formalized the fuzzy events and fuzzy rule exe-cution. In [18] and [6], we extended the formal description of the fuzzy events provided by Wolski and Bouaziz, to composite fuzzy events. We also studied fuzzy coupling modes and intro-duced the concepts of similarity based event detection and fuzzy rule execution via scenarios.
B. Data Mining
Mining of large volumes of data for useful information is cur-rently a hot research topic. Data mining problems can be cate-gorized as:
1) classifications where we try to partition the data into dis-joint groups [19];
2) associations where some correlations among data items are sought [20];
3) sequences where we try to find sequences among data items [21].
Discovery of event patterns from event histories (sequences) is very similar to finding association rules among a set of items. Informally, we have a set of items and a database consisting of transactions where each transaction contains some items bought by a customer at a time. The problem is to find rules like “if somebody buys diapers then he/she buys a bottle of beer as well,” using the database of customer transactions.
Discovery of event patterns from event sequences is presented by Bettini et al. in [22] and Mannila et al.in [23]. Mannila et
al. propose efficient algorithms for finding event patterns (they
call it frequent episodes) by analyzing event sequences. The ap-plication area used in their work is telecommunication alarm management. They use a sliding window approach, where the window size is specified by the user. Bettini et al.give algo-rithms based on Mannila et al.’s sliding window approach for discovering event patters. They tackle a more complex problem of finding event patterns where events have multiple granulari-ties.
Bettini et al. use a sliding window approach for the discovery of event patterns from event histories [22]. In the sliding window approach of Bettini et al., each window can be viewed as a customer transaction where transaction identifiers are just the window numbers in the event history. The set of events recorded in the history can be mapped to a set of items. The problem of finding frequent episodes is the same as finding large item sets with a given support (i.e., frequency) in the problem of finding associations. The problem of finding large item sets is a sub-problem of finding associations where an item set is large if its support (i.e., the number of transactions that contain that item set) is greater than or equal to minimum support value provided by the user. However, the problem of finding frequent episodes
Fig. 1. The process of event generation.
Fig. 2. Sample values for power consumption of residential and industrial customers in kilo watts.
becomes more complex when the user is allowed to specify complex episode structures.
There are various algorithms for finding large item sets in a given database of customer transactions. Two well-known algo-rithms are a priori and a prioriTID proposed in [24]. A priori al-gorithm starts with large item sets of size 1, generates candidate item sets, and then tests whether they are large or not. In each of the subsequent iterations, candidate item sets are generated using the large item sets found in the previous step, recursively.
A prioriTID is similar to a priori with some optimizations. The
algorithms proposed in [22] for finding frequent episodes also use the approach of a priori; i.e., generate candidate episodes starting with episodes of size 1. In latter iterations, the frequent episodes found in the previous step are used for generating the candidates.
III. A SLIDINGWINDOWALGORITHM FORMININGEVENT
HISTORIES
In this section, we explain the concepts of events and event histories, and propose a method for obtaining the relationships among events.
A. Events and Event Histories
Events are state changes in a system. In a control system, events can be defined using the measurements coming form the sensors. In a database environment, events can be tuple inser-tions, deletions and transactions operations. In an ADBMS, the sequence of events fired over a long period of time is called the
event history of the system. The events in the history are stored
in chronological order of event signaling.
Values that are coming from the sensors are stored in a database together with their time of occurrence, and the sensor values are then converted to events to be stored in the event history. This process is shown in Fig. 1. The examples regarding this process are given below.
Example III.1: Consider a power consumption history kept
by some power selling company. For simplicity, assume that there exist only three customers , , and , where and corre-spond to small scale industrial customers and correcorre-sponds to a typical residential customer. Sample power consumption values for these three customers are provided in Fig. 2.
The crisp sensor values are converted to fuzzy events by using the membership functions of the fuzzy events in the system. Analyzing the event history is more effective than analyzing the actual sensor values since events are at a more abstract level and give us more compact information which is easier to interpret.
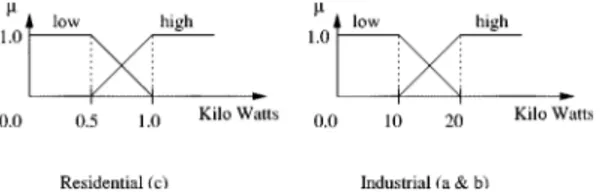
Fig. 3. Membership Functions for fuzzy sets low and high of residential and industrial power consumption.
Example III.2: Assume that the power consumption
events for the power consumption of the customers given
in Example III.1 are , , , , , where low power
consumption is indicated by subscript , and high power consumption is indicated by subscript . For example, event denotes high power consumption event of company , and denotes low power consumption event for company . The fuzzy events corresponding to crisp sensor values are obtained by choosing the event which gives the highest membership value. Sample membership functions for the fuzzy sets high and low are given in Fig. 3. A sample event history obtained from the crisp values in Fig. 2 is shown in Fig. 4.
Assume that we have a set of events ,
and a set of time stamps .
Definition III.1: The event occurrence binds an event to a
timestamp. Event occurrence is denoted by a pair where and denoting the time of the occurrence of .
Definition III.2: Two event occurrences, and in an event history are said to be concurrent event occurrences if ; i.e., they occur at the same time unit.
In Fig. 4, is an event occurrence, and
, and are concurrent event
oc-currences at time . The occurrences of events in a system are recorded in an event history as defined below.
Definition III.3: Let be a set of events. An event history, , is the set of past event occurrences. It is formally defined as:
where , , is a timestamp and ,
. is called the size of the event history.
In Fig. 4, and , , , ,
, , , , , . If in an event history, there is at least one event at each time unit, we call these types of histories complete
event histories. An event history constructed by using the sensor
values that are sent periodically to the database is an example of a complete event history since there is a measurement value at each point of time.
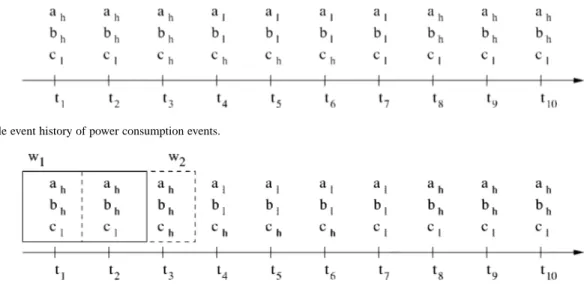
Fig. 4. A sample event history of power consumption events.
Fig. 5. Sliding windows, illustrated on the history of power consumption events.
B. Mining the History
Assume that we have a set of events ,
and an event history where the events are stored in the form: where , is the event parameter (i.e., the value returned by the crisp event such as the power consumption), and is the time-stamp of the event occurrence. Our problem is to find similarities among the events in using event history . There might be different approaches for obtaining the similari-ties among events. Our approach uses the proximity of event oc-currences in the event history. If two events are frequently being fired together in a short period of time, then it is likely that these events belong to the same context, therefore they are similar in that sense. We use a sliding window approach to analyze the event history and obtain the similarities among the events. In what follows, we explain our approaches in more detail.
1) Preliminary Definitions: In this section we define the
terms used for event histories and the sliding window algorithm.
Definition III.4: A window, , of size is a collection of consecutive time stamps and the events belonging to these time stamps. denotes the events in the th timestamp of
, where .
Definition III.5: Pivot events are the events that belong to the
first time stamp of the current window, i.e., pivot events [1].
Example III.3: In Fig. 5, is a window that covers
times-tamps, and . Pivot events of are and .
Definition III.6: Inverse distance between two event
occur-rences, and mimics the distance of occurrence
of and . Inverse distance is a value in the range (0, 1] and it
is calculated by the formula .
Example III.4: In Fig. 5, the inverse distance between
and is . The inverse
distance between two concurrent event occurrences
and is .
The inverse distance of concurrent event occurrences is 1, which is the maximum possible value and the inverse distance
value between and goes to 0 as goes to
infinity.
Definition III.7: Sequential proximity matrix is an
matrix where is the number of possible events that may occur
in the system. Each element of the matrix is the cumula-tive inverse distance of the occurrence of event after the oc-currence of event observed in the history.
We also take into account the order of event occurrences; i.e., the proximity of event occurrences in the order (i.e.,
) may be different from that of the same events in the order (i.e., ). In that sense our notion of distance has a direction.
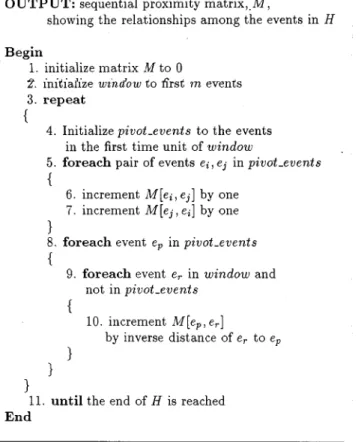
2) Sliding Window Algorithm: In order to construct the
se-quential proximity matrix, we use a sliding window approach similar to the one described by Mannila et al., in [23]. The dif-ference of our approach from that of Mannila et al.is that, we do not find event patterns, but try to find pairwise correlations among events in terms of proximity of event occurrences. We store the results of pairwise correlations in a matrix and use this intermediate structure to construct fuzzy event sets.
Our sliding window algorithm for mining event histories is presented in Fig. 6. The algorithm traces the whole event history in sequence and considers the events in a window of size . In Fig. 5, we have set the window size to 2. The first window is shown with a rectangle drawn using straight lines. It covers the events at the first two time stamps and . The window slides one time unit at each iteration. The second window, , is shown in Fig. 5 with a rectangle drawn with dashed lines. The second window covers the events with time stamps and . At each iteration, proximity of the pivot events to the rest of the elements in the window is updated one by one in the matrix. After this process, window slides one event to the right and pivot events are updated again. This process continues until the end of the history is reached, i.e., time stamp of the pivot events is the last time stamp in the event history. The output of the algorithm is the sequential proximity matrix obtained by tracing all the event history.
The sequential proximity matrix keeps the proximity of events incrementally. Its elements are initially set to zero.1 We
would like to give an example to facilitate understanding of the sliding window algorithm. Assume that we have an event
set . The sequential proximity
1In case of incremental runs of the algorithm, the contents of the previous
Fig. 6. Sliding window algorithm.
matrix, say , would be a square matrix. A sample event history for the given event set is provided in Fig. 5 with the first and second event windows, and , each of size 2 shown. Initially, all the entries in the sequential proximity matrix are 0. During the first iteration, the pivot events are , and . As the first step, proximity values of the pivot events are updated in the matrix. As a second step, proximity values of the pivot events to the rest of the events in the current window are incremented in matrix . After the first pass, the matrix is updated as shown in Fig. 7.
In the second pass, the window is moved one position right, as shown in Fig. 5, and the new pivot events are set to and . The same process is repeated for the new pivot events. After the second pass, entries of the matrix are as shown in Fig. 8. The final proximity values of the events are given in Fig. 9.
Giving more weight (increased proximity) to the events oc-curring very close to the pivot event in the window improves the accuracy of the sliding window algorithm.
A nice property of the sliding window algorithm is that, it is incremental. Assume that the time-stamp of the last event pro-cessed by the previous run of the algorithm is . As the event history grows with time, the algorithm can be reapplied to the event history starting from and the matrix values are updated according to the new event patterns. For some applications, like stock exchange, very old portions of the event history may be obsolete and misleading. Therefore, after a reasonable time it
Fig. 7. Sample sequential proximity matrix after processing the first window.
Fig. 8. Sample sequential proximity matrix after processing the second window.
Fig. 9. Sample sequential proximity matrix after processing the whole event history.
may be necessary to discard the old proximity values and pro-duce them from scratch starting from some point in the history. The similarity matrix that is constructed by mining the event history is used for fuzzy rule execution in ADBMSs. Fuzzy rule execution is performed by similarity based event detection and construction of rule scenarios, which are explained in Section V.
3) Time Complexity of the Algorithm: Time complexity of
the algorithm is determined by the size of the event history, size of the window and the maximum possible number of concurrent events.
Lemma III.1: Time complexity of the sliding window
algo-rithm is , where is the event history size, is
the window size and is the maximum number of concurrently occurring events in the event history.
Proof: This result is due to the fact that the whole event
history is traced for once and at each slide of the window com-parisons are made. The window is initialized to first times-tamps, and then the window slides times. Therefore, the total number of iterations at the repeat-until loop is . At each iteration of the loop, first the pivot events are initialized and for each pair of events in the pivot events, the matrix entries are up-dated. Updating an entry in the matrix takes constant time, and the number of pairs in the pivot events is
where is the maximum number of concurrent events at a time. After that, for each event in the pivot events, we update the prox-imity of that event with the rest of the events in the window.
Since there are time points in the rest of the window (ex-cluding the time point of pivot events), this operation is done at
most times. Therefore, the maximum possible
number of operations is
which equals to
Since we have calculated the maximum possible number of op-erations with respect to the maximum number of concurrent events, the time complexity of the sliding window algorithm is
.
The only parameter that we can control in the time complexity formula is the window size. As the window size increases the precision of the result of the mining increases, however the time complexity also increases. There is a tradeoff between the time complexity and precision. The selection of window size should consider this tradeoff.
IV. CONSTRUCTION OFFUZZYEVENTSETS
The theory of fuzzy sets was introduced by Zadeh [1]. A fuzzy set is characterized by its membership function which gives us the degree of membership of each element in the universal set to the fuzzy set. Membership function of a fuzzy set on the universal set is generally denoted by and maps each el-ement to a real number in the range [0, 1]; i.e., :
.
Fuzzy event sets are fuzzy sets where the elements are events, and each event has a degree of membership to the fuzzy event set fuzzy event set, , over a universal event set is a tuple
of the form where and is the membership
function that describes the degree of membership of the events in to . In Section IV-A, we explain how the sequential proximity matrix is used for constructing fuzzy event sets and their membership function.
A. Partitioning the Event Space Using Sequential Proximity Matrix
The fuzzy event set construction is done by partitioning the event space using the sequential proximity matrix. The events in each partition have a degree of membership greater than 0, and the rest of the events have 0 as their degree of membership to the fuzzy event set. The exact membership degree functions are provided later on. The problem here is to partition the set of events into subsets such that the resulting subsets are balanced, the total proximities of the events in all subsets are maximized, and the total similarities among the events belonging to different subsets are minimized. This problem is similar to the graph
par-titioning problem which was introduced by Kernighan and Lin
in [25]: Given a graph with costs on its edges, partition the nodes of into subsets no larger than a given maximum size, so as to minimize the total cost of the edges cut. Following is the formal definition of the graph partitioning problem [25].
Definition IV.1: Let be a graph of nodes, of size
(weights) , . Let be a positive number,
such that for all . Let , be
a weighted connectivity matrix describing the edges of . Let be a positive integer. A -way partition of is a set of nonempty, pairwise disjoint subsets of , such that . A partition is admissible if for all , where stands for the size of the set and equals to the sum of the sizes of all the elements of .
It has been shown in [25] that it is not feasible to find an exact solution to this problem. Therefore Kernighan and Lin proposed heuristics for solving the graph partitioning problem.
We simplify the graph partitioning problem defined above so that the weights of the nodes are all equal to 1. We also set to the constant value for a balanced partition. Balanced partitioning is important to avoid trivial partitions. If we do not assume a balanced partitioning then the partition that minimizes the sum of the weights of the edges among the partitions will produce a single partition that has no outgoing edges which has no use. The number of partitions, i.e., the number of fuzzy event sets is application dependent. The weighted connectivity matrix is the sequential proximity matrix described in Section III.
The algorithms provided by Kernighan and Lin assume undi-rected graphs. In our case the proximity of event to event may be different from the proximity of to . We may consider our sequential proximity matrix as a directed complete graph where the events correspond to nodes and weights of di-rected edges of the form correspond to the matrix entry . In order to map our problem to the graph partitioning problem of Kernighan and Lin, we convert our directed graph to a single undirected graph by replacing the directed edges
and with an undirected edge . Weight
of the edge is the sum of the weights of and
. Collapsing the directed edges connecting the same nodes to an undirected edge does not affect the outcome of the partition since either both of the edges or none of them are in the cutset.
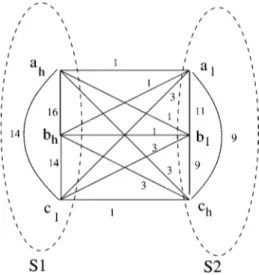
METIS Software package can be used for graph partitioning [26]. The event graph that resulted from the sequential prox-imity matrix given in Fig. 9 is provided in Fig. 10. The nodes of the graph represent the events and the edges between the nodes represent the similarities between the corresponding events. The undirected edges of the graph are obtained by summing the weights of the edges with the same end points. Two event sets re-sulting from the partitioning step are shown in Fig. 10 by ellipses with dashed lines. The first set, consists of the events , and while the second set, consists of . Similar to Example III.1, and here correspond to the power consump-tion of industry and corresponds to a residential customer. This grouping may show us that in the snapshot of the power con-sumption event history, high power concon-sumption of a residential customer corresponds to low consumption of industry. This situ-ation may occur in summer where lots of ACs are operated in the houses and the electricity price goes up forcing the large scale companies to lower their production resulting in lower power consumption in the industry.
B. Computation of Membership Functions
One method of obtaining the membership functions for fuzzy event sets is to rely on the experts of the particular application
Fig. 10. A sample event graph.
which is usually the case in fuzzy control. Since we have the se-quential proximity matrix ready at hand, we can utilize it to con-struct fuzzy event sets. As we have explained in Section IV-A, fuzzy event sets are constructed using a graph partitioning al-gorithm. Graph partitioning is used to cluster strongly related events. We can deduce the average coherence among the events in a fuzzy event set by taking the average proximity of all event pairs. The proximity between the event pair is denoted by proximity and it is the value stored in the th row and th column in the sequential proximity matrix. The average co-herence is further used for determining the membership function of a fuzzy event set.
Definition IV.2: Coherence of an event in a fuzzy event set is denoted by , and defined as the average proximity of event to the rest of events in . Coherence is calculated as follows:
proximity
where is the cardinality of the fuzzy event set and proximity is the proximity of to . We exclude the coherence of an event to itself in coherence calculation.
Coherence of an event , in a fuzzy event set specifies how closely is related to .
Definition IV.3: Average coherence for a fuzzy event set is denoted by and calculated as follows:
Definition IV.4: Coherence deviation of an event , in a fuzzy event set is denoted by and calculated as:
Maximum absolute coherence deviation for a fuzzy event
set , denoted by , is the maximum of
abso-lute coherence deviations in that fuzzy event set, i.e., .
Coherence deviation is a measure of how far is the coherence of an event from the average coherence.
Definition IV.5: Mean absolute deviation of a fuzzy event set
is denoted by MAD and calculated as:
MAD
MAD is an approximate measure of how close are the dif-ferent pairwise similarity values in a fuzzy event set.
Lemma IV.1: The formula
MAD
produces a number in the range when .
Proof: For any event , is in the range
, while and MAD are both in the range
. By definition, , and also
MAD . Therefore, we have
and MAD
Since , both of the fractions are defined.
and MAD
together imply that
MAD
This leads to
MAD
When we add 0.5 to the inequality, we get MAD
Thus,
MAD
is in the range [0, 1].
The membership function of a fuzzy event set is denoted by and calculated as follows:
if MAD
if
if
(1) An example for the membership calculation for the graph in Fig. 10 is given below:
Example IV.1: There are two fuzzy event sets, and , in Fig. 10. We calculate the membership function for as follows:
1) First we need to calculate the coherence for each event and find the average coherence.
• The coherence of event is
similarity similarity which equals to • similarity similarity which is • similarity similarity which is
2) Average coherence for is calculated as:
3) Coherence deviation for each event is calculated to find the maximum coherence deviation.
• • •
• Maximum absolute coherence deviation is, 4) MAD is calculated as:
MAD
After obtaining all the intermediate values needed, we can calculate the membership values of the individual events as:
• MAD which is
• which is also 0.35.
• Finally the membership value of is
V. APPLICATION OFSEQUENTIALPROXIMITYMATRIX AND
FUZZYEVENTSETS TOACTIVEDATABASES
Fuzzy rules have been involved in many areas from control to expert systems. The application of fuzzy concepts into ADBMSs has attracted the attention of some researchers; however, we cannot say that a considerable amount of research has been conducted addressing this issue. This section is devoted to the description of fuzzy rule execution in ADBMSs. In the following subsections we describe how fuzzy event sets are used for fuzzy rule execution and how sequential proximity matrix is used for similarity based event detection in ADBMSs.
A. Fuzzy Rules in ADMSs
Although incorporation of fuzziness to active databases in-troduces much flexibility, not much attention has been paid so far to this issue. To the best of our knowledge, only a research group in VTT (Finland) has worked on fuzzy triggers [27], [15], [28], [14]. In [28], a condition-action (CA) fuzzy trigger was proposed which means that fuzziness was introduced to the CA part of an event-condition-action (ECA) rule. In a later work [15], the concept of CA trigger was extended to a fuzzy ECA rule by introducing the notion of fuzzy events. A CA fuzzy trigger consists of a fuzzy predicate (i.e., a predicate that has linguistic terms) on the database as its condition, and a fuzzy action which is an overall conclusion obtained after evaluating fuzzy conditions. Wolski and Bouaziz compiled their previous work on fuzzy ECA rules and based their contributions on a sound theoretical background in [14]. A rule with a fuzzy con-dition and a crisp action is called a C-fuzzy trigger. The C-fuzzy trigger model is based on linguistic terms. The max–min infer-ence method is applied to the rule set to determine the truth value of the fuzzy predicates. In fuzzy ECA rules, an event may fire a set of rules. Fuzzy events are defined as fuzzy sets and use lin-guistic terms like high, low, and strong [15]. Formally a prim-itive fuzzy event is represented as a tuple where is a crisp event, and is a fuzzy event predicate. When a crisp event is signaled (such as a database update), the current value produced upon the operation causing the crisp event is fed into the membership function of . The output of the membership function is called the event match factor, and the fuzzy event is signaled only if the event match factor is greater than zero [15]. Upon the occurrence of the fuzzy event, the corresponding rules are fired and their conditions (which are fuzzy predicates on the database) are checked. The action of a rule may be started to execute depending on the result of condition evaluation. In a nuclear power plant control system, we may define rules such as
Event: On a significant temperature change;
Condition: Check whether the water level of the river is
low;
Action: Decrease the capacity to medium and issue a
warning signal;
where the linguistic terms like significant, low, and medium in-crease the understandability of the rule. It is very difficult to give exact numbers for the temperature change and water level. In-stead, predefined linguistic terms, which are in fact fuzzy sets,
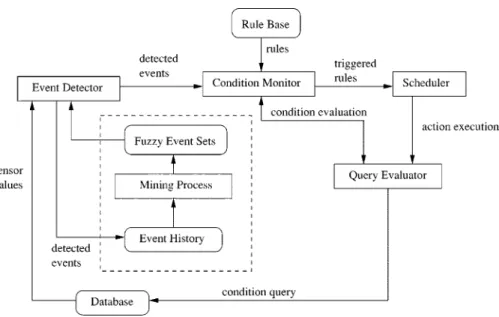
Fig. 11. Event detection and rule execution model.
can be used without difficulty by the people who define the rules.
In the above rule, the event “significant temperature change” is actually a fuzzy event. When a temperature change event is signaled, which is a crisp event, its current value, say 2000 C, is fed into the membership function of the corresponding fuzzy event (i.e., “significant temperature change”). Assuming that the membership function of the fuzzy event is , then the value
is called the event match factor.
Another possible application area is the stock exchange market. Price changes of certain stocks can mimic the price changes of some other related stocks, and dealers can take actions accordingly. A rule for a stock exchange market control system can be defined as
Event: On a considerable price reduction in stock A; Condition: TRUE;
Action: Sell a considerable amount of stock A and stock
B.
In the above rule, the event, considerable price reduction in stock A, is a fuzzy event. When a price reduction event is sig-naled, its value, say 12% is fed into the membership function of the corresponding fuzzy event and the result is used in fuzzy rule execution. Such a rule is very useful since it automatically issues an action upon the occurrence of an event, therefore re-ducing the time required to take an action.
The rule execution model provided in [29] is modified and depicted in Fig. 11. Events are detected by the event detector using the sensor values that are continuously stored in the data-base. Rules corresponding to the detected events are obtained from the rule base and their conditions are evaluated. Those rules whose conditions are satisfied are scheduled for execu-tion by the scheduler. As an extension to this model, we add the component in the rectangle with dashed lines. In this modified model, detected events are stored in the event history and they are fed to the mining process periodically. The mining process together with the partitioning, produces the fuzzy event sets which are further used by the event detector. Utilization of the
fuzzy event sets and sequential proximity matrix is explained in the following subsections.
B. Fuzzy Rule Execution and Fuzzy Event Sets
In the previous sections, we have shown how we can partition the whole event space into fuzzy event sets. Scenarios in the active database context are the aggregation of fuzzy event sets and rules. The idea of scenarios comes from the need to group rules into sets corresponding to different situations such as a “high power consumption scenario” in the summer. Dividing the rule space into scenarios has many advantages. First of all, dealing with a group of related rules is much easier than dealing with all the rules. Also, the number of rules triggered can be tuned by pruning the triggered rules using the membership func-tion of the scenario as will be explained later on. This combined effect of decreased number of events and rules in consideration will improve the efficiency and effectiveness of the system.
Assume that we have a set of fuzzy event sets , ,
, where . Assume also that the set of
rules in the system is where each rule is a triple of the form , being the event, being the condition, and being
the action. Let be the
events of the rule set . We partition the set of rules , into
subsets, such that for
some fuzzy event set and
and for , . The
scenario corresponding to , and , , is a triple
.
Example V.1: Assume that we have the set of rules
and the two fuzzy event sets and We first partition into
and
The corresponding scenarios are and
Event signaling is done by considering the membership de-gree of the event parameter in the fuzzy event. We use the fuzzy event structure described in [15] where a primitive event is a tuple, , consisting of a crisp part which is the crisp parameter coming from the system and a fuzzy part which denotes the fuzzy event.
Definition V.1: The strength of an event for the
rule in scenario is defined as:
strength value
where value is the value of the crisp event detected, and is the membership function of the fuzzy event . The value of an event can be itself in case is coming from a sensor. Or the value can be a parameter to the crisp event such as a database update event and the updated value.
Each rule has a firing threshold which is used to decide if a rule will be fired or not. In order to decide whether a rule will be fired in response to the signaling of a fuzzy event , the strength of event for rule is calculated and the result is compared to the threshold value for rule . If the result is greater than or equal to the threshold value, then the rule is fired. Threshold values of rules can be changed dynamically to tune to particular scenarios.
Prioritization of rules in an ADBMS is very important. Some rules may be more urgent than the others. The priority of rules can be set by the people who defined the rules. Another method is to use the events of the rules to set the priorities. Consider two rules whose events are “significant temperature change” and “significant pressure change.” If the membership value of the significant temperature change is much higher than the mem-bership value for the pressure change, the rule with event “sig-nificant temperature change” should be given higher priority of execution since late execution of that rule may be hazardous. Strength of the rules is a good indicator of rule priorities and they can be used to order the rules during rule execution. Pri-oritization based on the strength of the rules will give higher priority of execution to the rules with higher strength values.
C. Similarity Based Event Detection
Detection of similar events upon an event occurrence is some-thing very useful when the cost of missing events is very high in supported applications, like a nuclear reactor control system. Assume that an event such as “update in temperature level” is detected. Events with a high similarity degree, like “update in pressure level” should also be signaled automatically. This way, the system can predict that an event which escaped the event de-tection process has occurred. In a power producing and selling company, occurrence of some events can imply the occurrence of some other events. Advantage of similarity based event de-tection in such a system is that, the dealers may assume that the events similar to the signaled events will occur and can take the necessary actions in advance.
In similarity based event detection, when an event is signaled, other events which are similar to it should also be fired. Simi-larity based event detection considers only primitive events. In order to facilitate similarity based event detection, the sequen-tial proximity matrix explained in Section III is utilized. We also need similarity thresholds in order to avoid the system to con-tinuously detect irrelevant events via similarity based event de-tection.
Definition V.2: Similarity threshold for an event in a sce-nario is the minimum similarity requirement for the events in to be detected automatically by via similarity based event detection.
Similarity threshold for an event in a scenario can be set to be the coherence of in which is explained in Sec-tion IV-B. Upon the detecSec-tion of an event, , all the events in the same scenarios as whose similarity to is grater than the similarity threshold will be detected automatically. Similarities of the events in a scenario are the proximity values in the se-quential proximity matrix. An example would be helpful in ex-plaining similarity based event detection.
Example V.2: Consider the events and the sequential
prox-imity matrix in Fig. 9 and the fuzzy event sets in Fig. 10. As-sume that the current scenario is and is detected. Co-herence of in was calculated in Example IV.1 as . Among the rest of the events in which are and , only will be detected by similarity based event detection since
proximity , but will not be detected
since proximity .
Conventional event detection in active databases is a special case of similarity based event detection where the similarity re-lation among the events is an identity rere-lation and similarity thresholds are equal to infinity.
VI. CONCLUSION
In this paper, we have proposed some methods for automated construction of fuzzy event sets which are sets of events where each event has a degree of membership to a set. Fuzzy event sets are constructed by analyzing event histories. We have shown how an event history can be mined to produce the sequential proximity matrix which stores similarities among events in terms of the proximity of event occurrence. We have proposed a sliding window algorithm for mining event histories and proposed an automated rule modularization method that does not rely on semantic knowledge. As an application platform, we have chosen active databases. The sequential proximity matrix produced by the sliding window algorithm is used for similarity based event detection in active databases. Fuzzy event sets are also constructed by the sequential proximity matrix. Construction of fuzzy event sets is mapped to the well known graph partitioning problem, and fuzzy event sets are constructed using graph partitioning algorithms.
Incorporation of fuzziness to rule execution in ADMSs is still an open and important research area. Fuzzy ECA rules are ob-viously more flexible compared to standard ECA rules. With fuzzy events, we can involve a priority assignment mechanism based on membership functions of fuzzy events. Organization of
rules into scenarios, which are mapped to fuzzy event sets, in-creases the efficiency and modularity of rule execution. In sum-mary, the main contribution of our work is to propose the idea of fuzzy rule execution via scenarios and to describe how it could be realized using fuzzy event sets. As a future work, we are plan-ning to define new similarity metrics other than the proximity of event occurrences and construct the similarity matrix according to these new metrics.
ACKNOWLEDGMENT
The authors wish to thank Dr. A. Yazici for his help in estab-lishing the fuzzy concept background and Dr. E. Bas¸çi for his comments in the mathematical formulations of this work.
REFERENCES
[1] L. A. Zadeh, “Fuzzy sets,” Inform. Contr., vol. 8, pp. 338–353, 1965. [2] W. Pedrycz, Fuzzy Control and Fuzzy Systems: Research Studies, 1993. [3] B. Buckles and F. Petry, “A fuzzy model for relational databases,” Int.
J. Fuzzy Sets Syst., vol. 7, pp. 213–226, 1982.
[4] K. S. Leung and W. Lam, “Fuzzy concepts in expert systems,” IEEE
Computer, Sept. 1998.
[5] E. Baralis, S. Ceri, and S. Paraboschi, “Modularization techniques for active rules design,” ACM Trans. Database Syst., vol. 21, no. 1, 1996. [6] Y. Saygin, O. Ulusoy, and A. Yazici, “Dealing with fuzziness in active
mobile databases,” Inform. Sci., vol. 120, no. 1–4, 1999.
[7] E. N. Hanson and J. Widom, “An overview of production rules in data-base systems,” Tech. Rep., Univ. Florida, Dept. Computer and Inform. Sci., Oct. 1992.
[8] R. George, R. Srikanth, F. E. Petry, and B. P. Buckles, “Uncertainty man-agement issues in object-oriented database systems,” IEEE Trans. Fuzzy
Syst., vol. 4, pp. 179–192, May 1996.
[9] B. P. Buckles and F. E. Petry, “Information-theoretic characterization of fuzzy relational databases,” IEEE Trans. Syst., Man, Cybern., vol. SMC-13, pp. 74–77, Feb. 1983.
[10] A. Yazici, B. P. Buckles, and F. E. Petry, “Handling complex and un-certain information in the ExIFO andNF data models,” IEEE Trans.
Fuzzy Syst., vol. 7, pp. 659–676, 1999.
[11] A. Yazici, A. Soysal, B. P. Buckles, and F. E. Petry, “Uncertainty in a nested relational database model,” Data Knowledge Eng., vol. 30, no. 3, pp. 275–301, 1999.
[12] A. Yazici and R. George, Fuzzy Database Modeling. Heidelberg, Ger-many: Springer-Verlag, 1999.
[13] F. E. Petry, Fuzzy Databases: Principles and Applications. Norwell, MA: Kluwer, 1996.
[14] A. Wolski and T. Bouaziz, “Fuzzy triggers: Incorporating imprecise reasoning into active databases,” in Proc. 14th Int. Conf. Data Eng.
(ICDE’98), Orlando, FL, Feb. 1998.
[15] T. Bouaziz and A. Wolski, “Applying fuzzy events to approximate rea-soning in active databases,” in Proc. 6th IEEE Int. Conf. Fuzzy Syst.
(FUZZ-IEEE’97), Barcelona, Spain, July 1997.
[16] U. Dayal, “Active database management systems,” in Proc. 3rd
Int. Conf. Data Knowledge Bases, Jerusalem, Isreal, June 1988, pp.
150–169.
[17] Y. Saygin, O. Ulusoy, and S. Chakravarthy, “Concurrent rule execution in active databases,” Inform. Syst., vol. 23, no. 1, 1998.
[18] Y. Saygin and O. Ulusoy, “Involving fuzzy concepts in active mobile databases,” in Proc. 9th Int. Conf. Workshop on Database and Expert
Systems Applications (DEXA’98), 1998. Lecture Notes in Computer
Sci-ence.
[19] R. Agrawal, S. Ghosh, T. Imielinski, B. Iyer, and A. Swami, “An interval classifier for database mining applications,” in Proc. 18th Int. Conf. Very
Large Databases, Vancouver, Canada, Aug. 1992, pp. 560–573.
[20] R. Agrawal and R. Srikant, “Mining generalized association rules,” in
Proc. 21st Int. Conf. Very Large Databases, Zurich, Switzerland, Sept.
1995.
[21] , “Mining sequential patterns,” in Proc. 11th Int. Conf. Data Eng.
(ICDE’95), Taipei, Taiwan, Mar. 1995.
[22] C. Bettini, X. S. Wang, S. Jajodia, and J. Lin, “Discovering frequent event patterns with multiple granularities in time sequences,” IEEE
Trans. Knowledge Data Eng., vol. 10, no. 2, 1998.
[23] H. Mannila, H. Toivonen, and A. I. Verkamo, “Discovery of frequent episodes in event sequences,” in Proc. 1st Int. Conf. Knowledge
Dis-covery and Datamining, Montreal, Canada, Aug. 1995.
[24] R. Agrawal and R. Srikant, “Fast algorithms for mining association rules,” in Proc. 20th Int. Conf. Very Large Databases, Santiago, Chile, Sept. 1994.
[25] B. W. Kerninghan and S. Lin, “An efficient heuristic procedure for par-titioning graphs,” Bell Syst. Tech. J., vol. 49, no. 2, 1970.
[26] G. Karypis and V. Kumar, “METIS software package for partitioning unstructured graphs, partitioning meshes, and computing fill-reducing orderings of sparse matrices, version 4.0,” Univ. Minnesota, Dept. Comput. Sci./Army HPC Research Center, Minneapolis, MN. [27] T. Bouaziz and A. Wolski, “Incorporating fuzzy inference into database
triggers,” Tech. Rep., VTT Inform. Technol., Nov. 1996.
[28] T. Bouaziz, J. Karvonen, A. Pesonen, and A. Wolski, “Design and imple-mentation of tempo fuzzy triggers,” in Lecture Notes in Computer
Sci-ence. Toulouse, France: Springer, Sept. 1997, vol. 1308, pp. 91–100. [29] N. W. Paton and O. Diaz, “Active database systems,” ACM Computing