RESEARCH ARTICLE
Adult mouse dorsal root ganglia neurons
form aberrant glutamatergic connections in
dissociated cultures
F. Kemal Bayat1,2, Betul Polat Budak3,4, Esra Nur YiğitID3,5, Gu¨ rkan O¨ ztu¨rk3, Halil
O¨ zcan Gu¨lc¸u¨rID1,4*, Albert Gu¨ veniş1
1 Institute of Biomedical Engineering, Bogazici University,İstanbul, Turkey, 2 Department of Electrical and Electronics Engineering, Faculty of Engineering, Marmara University,İstanbul, Turkey, 3 Regenerative and Restorative Medicine Research Center (REMER), Research Institute for Health Sciences and Technologies (SABITA), Istanbul Medipol University,İstanbul, Turkey, 4 Faculty of Engineering and Natural Sciences, Biruni University,İstanbul, Turkey, 5 Institute of Biotechnology, Gebze Technical University,İzmit, Turkey *[email protected]
Abstract
Cultured sensory neurons can exhibit complex activity patterns following stimulation in terms of increased excitability and interconnected responses of multiple neurons. Although these complex activity patterns suggest a network-like configuration, research so far had lit-tle interest in synaptic network formation ability of the sensory neurons. To identify interac-tion profiles of Dorsal Root Ganglia (DRG) neurons and explore their putative connectivity, we developed an in vitro experimental approach. A double transgenic mouse model, expressing genetically encoded calcium indicator (GECI) in their glutamatergic neurons, was produced. Dissociated DRG cultures from adult mice were prepared with a serum-free protocol and no additional growth factors or cytokines were utilized for neuronal sensitiza-tion. DRG neurons were grown on microelectrode arrays (MEA) to induce stimulus-evoked activity with a modality-free stimulation strategy. With an almost single-cell level electrical stimulation, spontaneous and evoked activity of GCaMP6s expressing neurons were detected under confocal microscope. Typical responses were analyzed, and correlated cal-cium events were detected across individual DRG neurons. Next, correlated responses were successfully blocked by glutamatergic receptor antagonists, which indicated functional synaptic coupling. Immunostaining confirmed the presence of synapses mainly in the axonal terminals, axon-soma junctions and axon-axon intersection sites. Concisely, the results pre-sented here illustrate a new type of neuron-to-neuron interaction in cultured DRG neurons conducted through synapses. The developed assay can be a valuable tool to analyze indi-vidual and collective responses of the cultured sensory neurons.
Introduction
Sensory neurons innervate internal and external organs and transmit noxious and non-nox-ious information to the Central Nervous System (CNS). They are pseudo-unipolar cells with a1111111111 a1111111111 a1111111111 a1111111111 a1111111111 OPEN ACCESS
Citation: Bayat FK, Polat Budak B, Yiğit EN, O¨ ztu¨rk G, Gu¨lc¸u¨r HO¨ , Gu¨veniş A (2021) Adult mouse dorsal root ganglia neurons form aberrant glutamatergic connections in dissociated cultures. PLoS ONE 16(3): e0246924.https://doi.org/ 10.1371/journal.pone.0246924
Editor: Robert Blum, University Hospital Wurzburg,
GERMANY
Received: September 28, 2020 Accepted: January 29, 2021 Published: March 3, 2021
Peer Review History: PLOS recognizes the
benefits of transparency in the peer review process; therefore, we enable the publication of all of the content of peer review and author responses alongside final, published articles. The editorial history of this article is available here: https://doi.org/10.1371/journal.pone.0246924
Copyright:© 2021 Bayat et al. This is an open access article distributed under the terms of the Creative Commons Attribution License, which permits unrestricted use, distribution, and reproduction in any medium, provided the original author and source are credited.
Data Availability Statement: All relevant data are
within the paper and itsSupporting Information files.
axons bifurcating into two distinct branches, one extending to peripheral receptors and the other to the spinal cord [1]. Action potentials generated in sensory receptors travel from the peripheral to central processes of Dorsal Root Ganglia (DRG) neurons, without passing through any synaptic connections [2–4]. Sensory neuron bodies located in the DRG are thought to behave like rarely depolarizing passive units [5], where afferent signals bypass the neuron bodies and continue to the CNS [6]. In contrast, DRG neurons typically exhibit com-plex neuron-to-neuron interactions and ectopic discharges emerge from their somata in cases of injury, inflammation, or strong excitation [3]. Despite being studied extensively in many platforms within varying contexts, the reason for these neuron-to-neuron interferences inside a ganglion is not clearly understood. To our knowledge, very little research so far had been car-ried out concerning synaptic formation and network development potentials of sensory neu-rons. In this work, we wanted to examine whether DRG neurons can develop functional connections through synapses and form circuits with each other in vitro. For this purpose, we studied response profiles and communication among DRG neurons in vitro using a multi-modal approach. We used local extracellular electrical stimulation through MEA electrodes and GECI-based calcium monitoring, simultaneously.
Since most DRG neurons are excitatory and glutamate is a major excitatory transmitter in peripheral and central nervous systems [7], we examined neuronal communication through glutamatergic synaptic function. Consequently, we used adult DRG neurons of a custom dou-ble transgenic mouse model, expressing GCaMP6s at its glutamatergic neuron bodies. We employed modality-free electrical stimulation and visualized spontaneous and stimulus-evoked calcium (Ca2+) activity at cell bodies of GCaMP6s expressing DRG neurons via confo-cal microscopy. An almost single-cell level stimulation was achieved by adjusting the con-fluency of cultures grown on MEAs.
In vitro models, allowing visualization and manipulation of both neuronal and glial cells, are potent tools for providing information at various scales. The use of MEAs allows network level investigations of neuronal populations [8–10]. However, in DRG culture assays incorpo-rating MEA platforms, certain limitations arise. The DRG neurons exhibit spontaneous activ-ity in sub-threshold voltage levels which is hard to decipher with standard extracellular measurements. Cytokines and growth factors have been used conventionally to sensitize neu-ral populations [11,12] to obtain spontaneously active DRG neurons, however our multi-modal approach does not require additional factors or cytokines. In addition, calcium imaging enables observation of sub- and supra-threshold calcium transients with high spatial resolu-tion. Genetically encoded calcium indicators (GECIs) enable monitoring calcium dynamics of neuronal populations for a theoretically unlimited amount of time, in a non-invasive fashion with high SNR [13,14]. The GECI constructs can be targeted to specific cell types [15].
In this study we present an experimental approach for identifying interaction profiles of DRG neurons in anin vitro setting. We describe, for the first time, a synaptic network
forma-tion in cultured DRG neurons and demonstrate that synaptic formaforma-tion has an important role in the emergent correlated activity. Our results indicate that the correlated activity is totally suppressed by post-synaptic glutamatergic antagonists. When immunocytochemistry (ICC) is applied, synapse formation is further demonstrated by the presence of presynaptic protein marker, synaptophysin. Synapses are observed mainly in axonal terminals, axon-soma junc-tions, and axon-axon intersection sites. Understanding the neuron-to-neuron interaction mechanisms as described here will improve our perception on sensory neuron functioning and may lead to new, effective clinical and pharmacological studies on sensory neuron disorders.
Funding: This work is funded by Boğazic¸i University Research Fund to author AG under the Project Code 8080D. During the experiments some facilities of REMER (Istanbul Medipol University, Regenerative and Restorative Medicine Center) were used. The funders had no role in study design, data collection and analysis, decision to publish, or preparation of the manuscript.
Competing interests: The authors have declared
Methods
Ethics statement and animal handling
Transgenic mice strains were kept and bred inThe Experimental Animal Center of Istanbul Medipol University. All animals were handled in strict accordance with guidelines for animal
care and use issued by the EU directive code; 86/609/CEE.The Committee on Ethics of Animal Experimentation of Istanbul Medipol University (IMUHADYEK) approved all procedures.
Two transgenic mice strains purchased from Jackson Laboratories were used. The first one was a knock-in strain Vglut2-ires-cre (C57BL/6J), having Cre-recombinase enzyme expression in excit-atory glutamatergic neuronal cell bodies. The second was Ai96 (RCL-GCaMP6s), a Cre-dependent calcium indicator strain (C57BL/6J), which emits EGFP fluorescence after calcium binding. These two original strains were crossbred and the offspring successfully expressed GCaMP6s in their glu-tamatergic neurons. In total, six transgenic animals were used in the present work.
Dissociated DRG culture protocol
The dissociated adult DRG culture protocol was adapted from a previously published work [16]. Prior to the dissection, mice were euthanized with CO2asphyxiation and rapid decapitation. In a
sterile hood, ganglia were collected in theDissection Medium. Collected ganglia were transferred
into theEnzyme Solution 1, and incubated in 37˚C, 5% CO2for 40 minutes. Then, the ganglia were
washed with Hank’s Balanced Salt Solution, (HBSS, Sigma) and transferred intoEnzyme Solution 2
for 15 minutes at 37˚C, 5% CO2incubation. Following the incubation inEnzyme Solution 2, the
ganglia were gently triturated with pipettes of decreasing diameters (1.32mm, 1.0mm, 0.83mm, 0.45mm). After the trituration step, the cell suspension was diluted within theEnzyme Inhibition Medium to remove enzyme activity. To maximize the neuron yield from the mixed cell population
and the debris, a cell purification step was incorporated using a three-layer PercollGradient. Cell
suspension was layered on PercollGradient gently and spun at 1700 RPM at 4˚C. Cells collected
from the middle layer were plated with an average density of 100 cells/mm2using 4.7mm diameter cloning cylinders (Sigma). Half of the maintenance medium was reloaded every three or four days to maintain the viability of the cells up to two months. The details of the preparations and the con-tents of all the solutions and the media used in our experiments are given inS1 File
Immunocytochemistry
An MEA plate was fixed on the day of experiment (Table 1, Plate 8) with 4% paraformaldehyde (PFA, pH~6.9) and washed gently with phosphate buffer saline (PBS, Sigma). Blocking and permeabilization of the cells were performed using theBlocking Solution. Afterwards, a second
wash was performed, and preparation was incubated with primary antibodies in theDilution Solution, overnight at 4˚C. Utilized primary antibodies were chicken Anti β-III Tubulin
(Abcam) and rabbit Anti-Synaptophysin (Santa Cruz) with 1:200 and 1:50 dilutions, respec-tively. After that, the primary antibodies were washed out with PBS and secondary antibodies were added and incubated for three hours at room temperature. Secondary antibodies were Alexa Fluor 633 goat chicken Immuno-globulin-G (IgG) and Alexa Fluor 488 goat anti-mouse IgG (Invitrogen) with 1:100 and 1:400 dilutions, respectively. DAPI (Invitrogen) was added to the sample at 1μg/ml concentration. A final wash with 2:1000 PBS-Tween20 solution was performed in dimmed light and preparation was kept in PBS-Azide with 1:1000 dilution.
Preparation of MEAs
MEAs with 64 planar microelectrodes etched to 5cmx5cm glass substrates were purchased fromThe Center for Network Neuroscience of the University of North Texas. We removed the
glass bottoms of standard 35mm Petri dishes and adhered the remaining polystyrene frames to the MEAs using a medical adhesive (Hollister- 7730). The new MEA dishes were sterilized with 3% bleach and 70% ethanol and placed under UV light for two hours in a laminar flow hood. Afterwards, they were coated with 0.1% polyethyleneimine (PEI, Sigma) solution pre-pared in 0.1M borate buffer for two hours and rinsed off thoroughly with sterile de-ionized water. The dishes were then coated with 40ng/mm2Laminin (Sigma) diluted in double-dis-tilled water (ddH2O) and kept at 37˚C incubation overnight.
Local electrical stimulation
The electrical stimulation hardware consisted of an MEA interfacing headstage, a digital to analog conversion board, a router circuitry, and a controlling PC (Lenovo). Plexon MHP64 headstage was used for interfacing MEAs which was designed for the 64 channel MEA layouts. A custom designed router circuitry was employed for directing analog stimulation signals to selected channel or channels from 64 alternatives. Digital stimulation signals were converted to analog voltages using National Instruments (NI) 6001 board, at a sampling rate of 5 kHz. Digital to analog conversion and router circuitry were controlled with a custom software writ-ten in MATLAB (Mathworks Inc.) incorporating Data Acquisition Toolbox (Mathworks Inc.) and utilizing the NI drivers and libraries. All stimulation signals were voltage controlled biphasic pulses and the stimulation parameters were adapted from previous studies [17–19]. The pulse durations and the amplitudes that elicit stable and reproducible responses were empirically adjusted in the ranges of 100–500μs and 1–3 V, respectively.
Experimental procedure
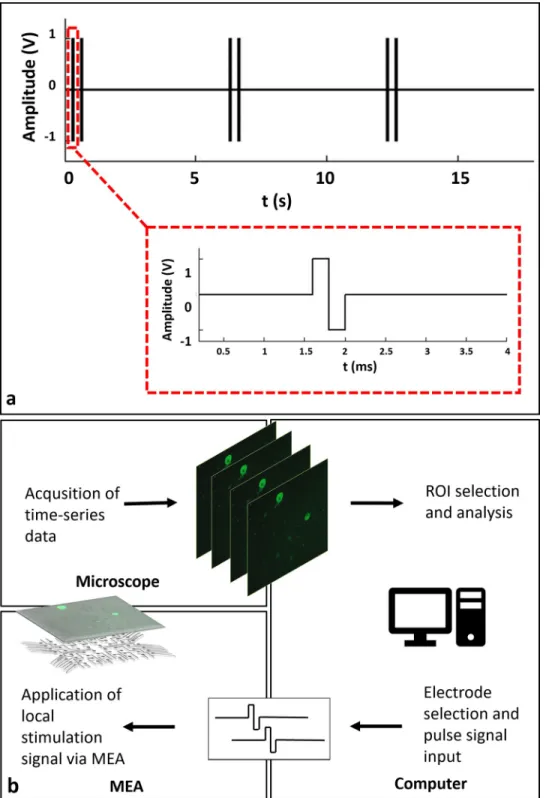
To observe individual calcium responses clearly, the stimulation period was selected as six sec-onds, similar to previous studies [19,20]. Within six second periods, stimulation was applied as dual-pulses in 2 Hz. After the candidate electrodes were determined, the scanning stimula-tion pulses were applied to each candidate electrode in sequence. In this way, the regions that respond to stimulation were selected. A typical stimulation strategy that was used in the exper-iments is shown inFig 1A. The MEA headstage was placed on a custom-made heating unit, similar to a previously reported interface on an inverted confocal microscope stage (Carl Zeiss, Cell Observer) [21]. Time lapse images were acquired simultaneously while applying local elec-trical stimulation through selected electrodes. For imaging, a 10X Plan Apochromat objective and a 488nm excitation wavelength laser were used along with a 500–550 nm emission filter.
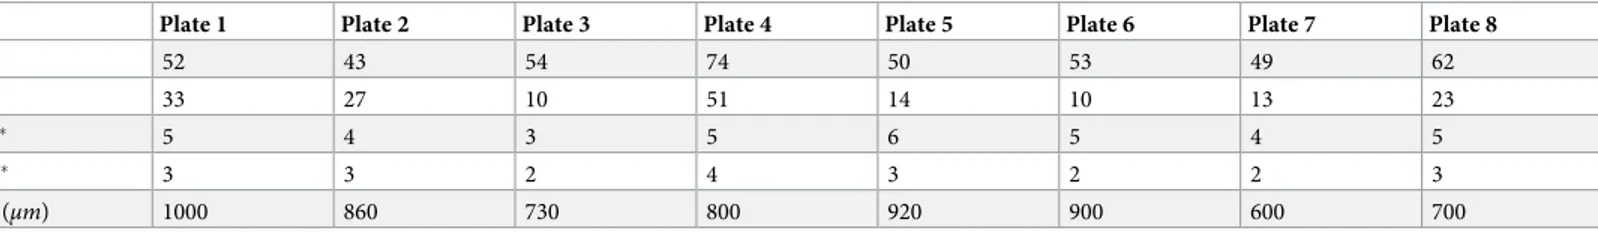
Table 1. Basic interaction profiles.
Plate 1 Plate 2 Plate 3 Plate 4 Plate 5 Plate 6 Plate 7 Plate 8
A 52 43 54 74 50 53 49 62
B 33 27 10 51 14 10 13 23
C� 5 4 3 5 6 5 4 5
D� 3 3 2 4 3 2 2 3
E (μm) 1000 860 730 800 920 900 600 700
A: Total number of neuron bodies on active electrode area (1mm2). B: Total number of candidate neuron bodies inε-neighborhood. C: Number of primary neurons (directly stimulated neurons). D: Number of primary neurons that excite secondary neurons. E: Maximal distance between primary and secondary neurons.
�Only significant values (p<0.05) included, determined using Eqs1to4.
Fig 1. a: A typical stimulation strategy. A stimulation consists of two biphasic pulses of 400μs duration, repeated in 0.5
s. Stimulation is repeated within six second periods. b: Schematic representation of the experimental procedure. Time-lapse imaging and electrical stimulation of GCaMP6s expressing neurons using a MEA headstage placed on an inverted fluorescent microscope. Acquisition of calcium responses and live monitoring. Offline event detection, analysis and rendering of analog voltage signals.
Image acquisition was performed at an average rate of three frames per second which suffi-ciently captured GCaMP6s dynamics [19]. A schematic diagram of the experiment loop can be seen inFig 1B. All experiments were carried out with identical stimulation set up in “default (non-blocked)” and “blocked” conditions where NMDA, AMPA and Kainate receptor block-ers were applied to the cultures.
Image analysis and statistics
Neuronal cell bodies were selected as regions of interests (ROIs) manually using Fiji software [22]. A selected set of ROIs and the corresponding stimulation electrode was assigned as an indi-vidual experiment. Each pixel that a region encloses, was assumed to have a uniformly distributed variation in light-intensity and calcium activity of each neuronal unit was calculated by averaging. Then the relative change of light intensities,ΔF/F(t), were computed for each ROI after subtract-ing the background [23]. In order to eliminate imaging noises and to remove the out-of-range frequency components, a moving-average filter was applied to each time-series [24].
To evaluate the similarity between the responses of the selected ROIs, cross-correlation analysis was applied to each pair of time-series. To obtain a consequent output, a cross-correla-tion measure for any two time-series, the cross-covariance was computed using (1) and (2),
sxyðTÞ ¼ 1 N 1 XN t¼1 ðxt T mxÞðyt myÞ ð1Þ rxyðTÞ ¼ sxyðTÞ ffiffiffiffiffiffiffiffiffiffiffiffiffiffiffiffiffiffiffiffiffiffiffiffiffiffi sxxðOÞsyyðOÞ q ; ð2Þ
where,N is the length and, μxandμyare mean values of time seriesx and y, respectively.
The maximum values of the cross-correlation signals were determined, allowing a maximal lag of a stimulation period. Then using lag-compensated cross-correlation results were further processed to find Pearson correlation coefficients with Eq (3),
cxy¼ Nð P xyÞ ðPxÞðPyÞ ffiffiffiffiffiffiffiffiffiffiffiffiffiffiffiffiffiffiffiffiffiffiffiffiffiffiffiffiffiffiffiffiffiffiffiffiffiffiffiffiffiffiffiffiffiffiffiffiffiffiffiffiffiffiffiffiffiffiffiffiffiffiffiffiffiffiffiffiffiffiffiffiffi ½NPx2 ðPxÞ2�½NPy2 ðPyÞ2� q ð3Þ
The correlation coefficients above a selected threshold was used in connectivity analyses, and their significance was determined usingp-value statistics calculated using (4).
pxy¼cxy ffiffiffiffiffiffiffiffiffiffiffiffiffiffiffi N 2 1 cxy2 s ð4Þ
To group the calcium responses hierarchically, city-block distance and complete link clus-tering algorithms were employed. In addition, a phase synchronization index,Mean Phase Coherence (MPC), was employed for determining phase coupling strength of the correlated
calcium responses [25]. To compute the MPC values, instantaneous phase differences of the time-series were utilized as follows,
MPCxy¼ j 1 N XN 1 j¼0 eiφx;yðjDtÞj ð5Þ
Results
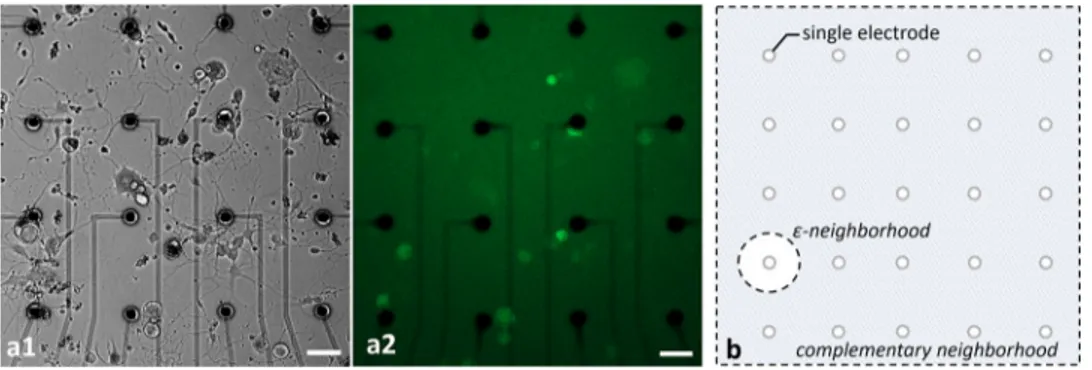
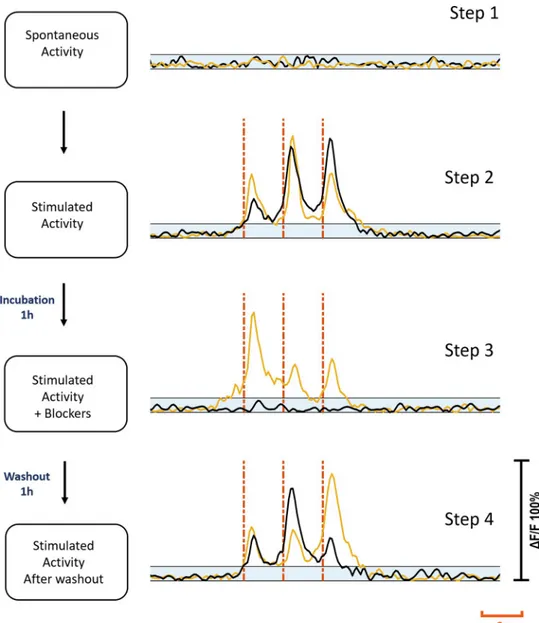
Healthy populations of adult DRG cells were obtained with a high viability ratio of 90–95%. The cells firmly attached on the MEA surfaces due to the optimized coating protocol. Neurite elongation was observed in the first hour of plating. Plated cell populations included 60–65% neurons, the remaining were glial cells.Fig 2shows phase contrast (a1) and fluorescent images (a2) of a typical DRG culture grown on an MEA dish. A high-throughput expression of GCaMP6s can be seen on glutamatergic neurons at three days in vitro (DIV3). All the experi-ments were conducted between DIV2-11. Glutamate receptor antagonists were used for exam-ining postsynaptic connections between the DRG neurons [26]. In the presence of NMDA, AMPA and Kainate receptor blockers, synaptic communication ceased completely. Induced calcium activity patterns changed dramatically when the glutamatergic synapses were blocked. The results were verified with post-control data, obtained after the wash out of the chemical antagonists with fresh media. Experimental steps are outlined inFig 3.
Active MEA areas, approximately a total of 1mm2
region, were monitored with a 10X objec-tive and the total number of neuronal bodies were counted (Table 1, row A).Primary Neurons
were defined as the neuron bodies which were directly stimulated by an electrode. A circle of radiusε around each selected electrode, called a ε-neighborhood, was determined to be the area where primary neurons reside.Secondary Neurons were defined as the neurons which
were excited by the primary neurons. They were observed throughout the active MEA area outside theε-neighborhood, called the complementary neighborhood. An illustrative diagram for neighborhood definitions can be found inFig 2B. In the reported experiments, we selected the neighborhood parameter as,ε = 50 μm.Table 1summarizes the basic interaction profiles of each MEA plate. Out of a total of 437 neurons in the active areas of these eight MEA plates (Table 1, row A), 181 were in theε-neighborhood (Table 1, row B). These neurons in the ε-neighborhood were defined ascandidates for primary neurons. To determine the primary
neu-rons, we stimulated the candidates via selected electrodes in theε-neighborhood. A total of 37 candidate neurons responded to the stimulation (p<0.05) and they were labeled as the primary neurons (Table 1, row C). Out of these 37 primary neurons, 22 were found to excite at least one other neuron (60%± 15.7 with a confidence interval of 95%, p<0.05) (Table 1, row D). The neurons that were excited by the primary neurons were the secondary neurons. The last row ofTable 1shows the maximal distances between primary and secondary neurons.
Two distinct response profiles were observed depending on the presence and the absence of a contact between the stimulation electrode and the primary neuron. If a direct contact was
Fig 2. Phase contrast (a1) and fluorescent (a2) images of typical cultures of DRG neurons. The cultures were grown
on MEA plates with an average density of 100 cells/mm2. Fluorescent image shows the GCaMP6s expression of
transgenic glutamatergic neurons at DIV3. Scale bar: 50μm at 10x magnification. The illustration of ε- and
complementary neighborhood definitions (b). https://doi.org/10.1371/journal.pone.0246924.g002
present, it was defined as thec+primary neuron and if there were no direct contact it was
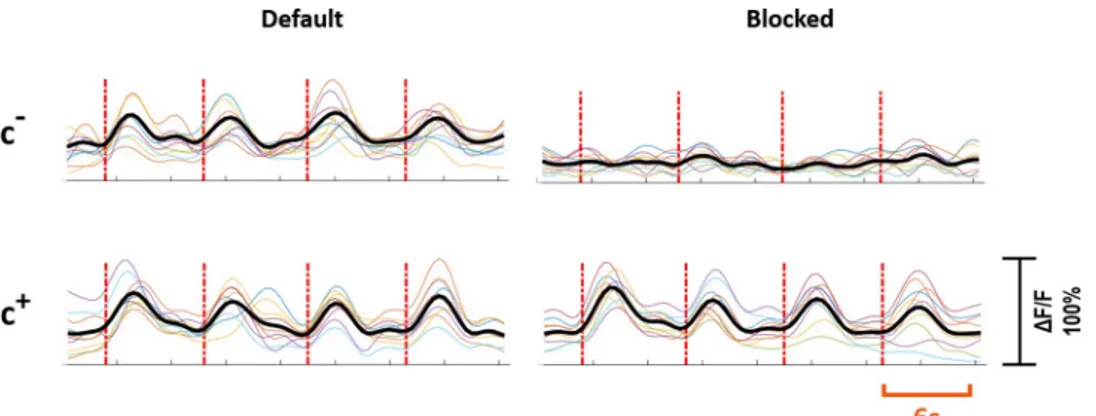
defined as thec-primary neuron. Out of 37 primary neurons, 21 (57%) were of c+type, and 16 (43%) were of c-type. For the c+primary neurons, synaptic blockers did not impede the evoked responses, however for the c-primary neurons, the evoked responses were suppressed with blocker application.Fig 3shows the characteristic response profiles obtained from c+and c-type primary neurons at each experimental step. The responses of each c+and c-primary neuron (n = 13 for c+,n = 10 for c-) recorded in default and blocked conditions can be seen in
Fig 4.
Fig 3. Experimental steps. Step one: Spontaneous activity recording prior to stimulation. Step two: electrical
stimulation applied. Step three: Stimulation repeated after cultures were treated with blockers for 1h. Step four: Stimulation repeated after washout and 1h incubation. Yellow and black traces show the same c+and c-primary
neuron’s activities at each step respectively. Blue shaded areas show subthreshold. Red dashes show stimulation instants. Each stimulation trace corresponds to a 2 Hz dual-biphasic pulses repeated in 6s periods. Vertical axis shows normalizedΔF/F.
Stimulated neuronal responses activate other neurons via glutamatergic
connections
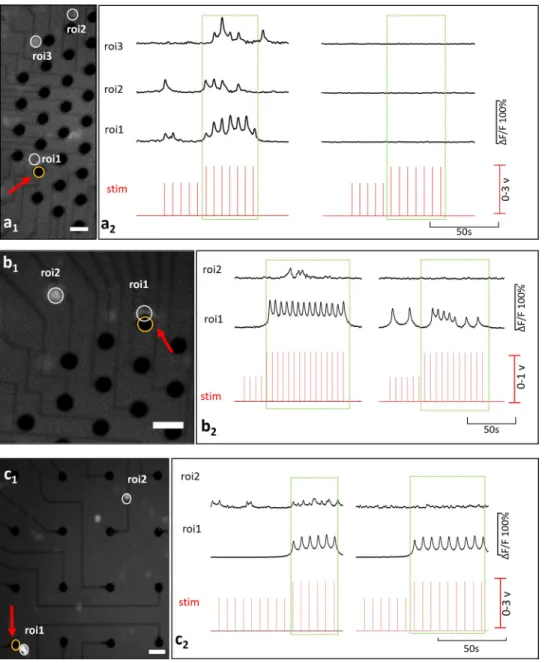
Interaction profiles between primary and secondary neurons are illustrated inFig 5, for both c-(a) and c+type primary neurons (b and c). In (Fig 5A), the c-primary neuron (ROI 1) excites two secondary neurons (ROIs 2 and 3). Locations of these neurons and the stimulation elec-trode can be seen from the fluorescent image presented inFig 5A1. Recorded Ca2+responses of these primary and secondary neurons are shown inFig 5A2. Correlation analysis confirmed that the secondary neurons were excited by the c-primary neuron (p<0.05). In the blocked condition, no Ca2+activity was observed.
Although the induced Ca2+activity persisted under the glutamatergic inhibition for c+ pri-mary neurons, excitability of the secondary neurons discontinued. Secondary neurons exhib-ited two common excitation profiles depending on whether they were silent or spontaneously active before stimulation. These two profiles were encountered in equal frequencies 30% (both 7 out of 22) all throughout the experiments. InFig 5B, the c+primary neuron was observed to excite a previously silent secondary neuron. In the blocked case this excitation was not observed as shown via correlation analysis (p<0.05). A video of this experiment is provided in
S1A and S1BVideo.Fig 5Cshows an example for a secondary neuron which was spontane-ously active before stimulation. Spontaneous activity of the secondary neuron was modulated with the induced Ca2+activity of the primary neuron. Excitation of the secondary neuron con-tinued through the stimulation and the in-phase modulation vanished in the blocked case (p<0.05).
Higher order synaptic interactions
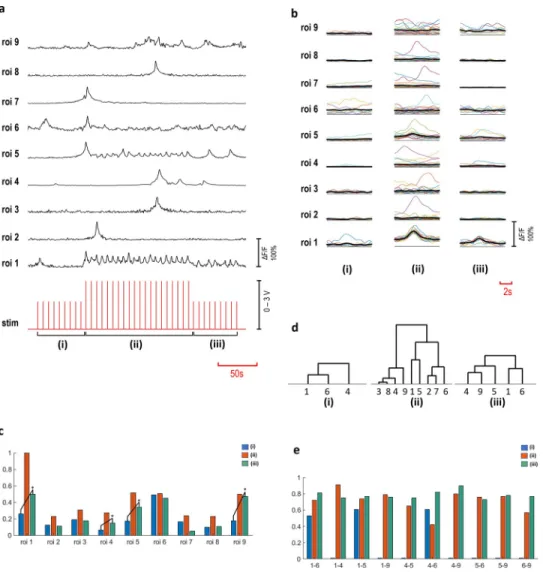
Increasing the confluency of the cultures produced rather complex interaction patterns. A complex interaction scheme is presented inFig 6, where a c-primary neuron excites eight sec-ondary neurons. In the blocked repetition of the experiment, interaction between the primary and the secondary neurons disappeared (p<0.05). Recorded Ca2+activities of these neurons are shown inFig 6A, asΔF/F(t) time series. A stimulation strategy involving three amplitude steps (2V-3V-2V) was employed to investigate the effect of the successive stimulation on the excitability.Fig 6Bshows the acquired responses to each stimulus for three voltage steps, indi-cated as (i, ii and iii). A summary of the averaged and normalized responses is presented inFig
Fig 4. Response profiles of c+and c-neurons. Individual experiments are shown in color and the averaged response is
shown in black. The first row shows the responses of c-neurons and the second row shows the responses of c+
neurons. The left and right column shows responses to stimulation in default and blocked cases, respectively. Red dashed lines show stimulation instants. Stimulation period is six seconds. Vertical axis shows normalizedΔF/F. https://doi.org/10.1371/journal.pone.0246924.g004
6C. Significant increase in the excitability of ROIs 1, 4, 5 and 9 was observed (p<0.05) and shown with asterisks. Furthermore, we investigated connectivity, using cross correlation and MPC analyses, separately for the three stimulation periods (i, ii, iii). Significant connections are illustrated as hierarchical trees, shown inFig 6D(p<0.05). In these three stimulation peri-ods, network structures varied through lower orders of hierarchical connections. Connected pairs that were common in these stimulation periods were then investigated in terms of the connectivity strengths. Significant alterations in the functional connections are summarized in
Table 2andFig 6E(p<0.05).
Fig 5. Basic interactions. (a) is an example for a c-primary neuron and (b) and (c) are for c+primary neurons.
Secondary neurons in (b) and (c) represent previously silent and previously spontaneously active types respectively. Fluorescent images show the locations of the stimulation electrode and the neuron bodies in a1, b1, and c1 (Scale bar: 50μm, magnification: 10X). Stimulation instants and the corresponding time-series of calcium activity recorded in absence (left) and presence (right) of glutamatergic antagonists, a2, b2, c2.
Structural verification of synapses
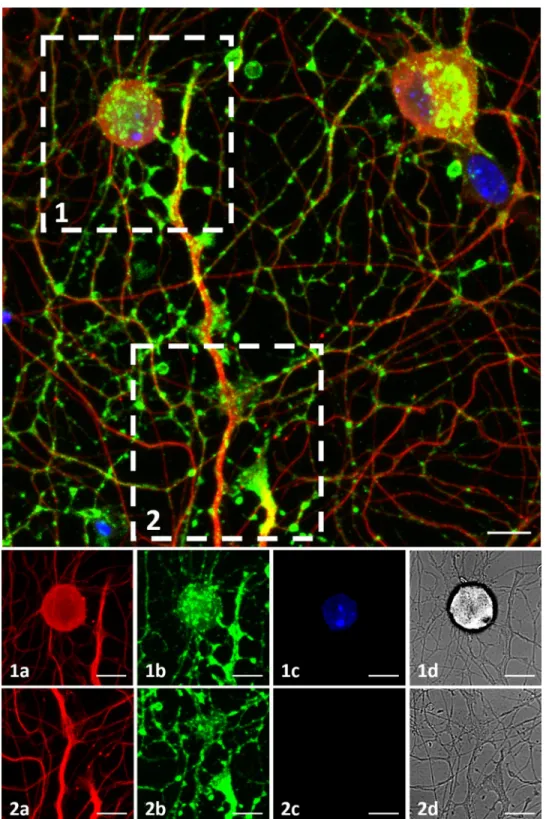
To examine synaptic formations on MEA plates, immunostaining was performed (Table 1, Plate 8). Synaptophysin staining was observed among almost all the tubulin positive neurons, prominently concentrated in three distinct regions. These three regions were axon terminals, soma-axon contact sites and axon-axon intersection points. These regions may correspond to synapse types commonly described as, extracellular, synaptic, somatic and axo-axonic (Fig 7).Fig 7.1 and 7.2show a soma-axon connection and an axon terminal, respec-tively. The axon-axon intersection sites were observed to be widespread. The a, b, c and d labels show tubulin in red, synaptophysin in green, DAPI and brightfield channels respectively. A 3D rendering of ICC image can be seen inS2 Video.
Fig 6. Multi-layered interactions. Time-series of ROIs 1–9, ROI 1 is a c-primary neuron and ROIs 2–9 are secondary
neurons (a). The stimulation voltage applied in three steps (2V-3V-2V) indicated as (i, ii, iii). (b) shows the averaged responses to individual stimuli detected in three voltage steps (n = 10 for (i) and (iii) steps, n = 20 for (ii) part). Response amplitude alterations are shown in normalized averaged values (c). Response amplitudes of ROIs 1, 4, 5 and 9 increased significantly from step (i) to (iii) (p<0.05). Hierarchical groups are shown, based on significant
correlations (p<0.05) (d) and the connectivity strength values calculated with significant MPC scores (p<0.05), (e) obtained from connectivity analyses.
Discussion
In this study, we investigated cultured DRG neurons in terms of their spontaneous and induced electrical activity patterns and asked whether they develop networks with each other. For this purpose, we developed an experimental platform combining fluorescent imaging and local electrical stimulation of GCaMP6s expressing sensory neurons from adult mice. We have shown that correlated activity in cultured DRG neurons originate from network formation. Network events were successfully addressed to glutamatergic synapses which were detected in the axonal terminals, axon-soma junctions and axon-axon intersection sites in almost all neu-rons. Studies using a multi-modal experimental approach to understand interaction profiles of DRG neurons in-vitro are rare and to our knowledge, no study on DRG networks has not been reported previously.
The culture protocol for dissociated DRGs from adult mice with a serum-free protocol pro-vided high viability rates and adequate conditions for growth and development of neurons. Also, the gradient-based cell sorting process resulted in seeding of a low percentage of glial cells with a high neuronal population compared to previous studies. Avoiding the need for anti-mitotic agents by using an optimized culture medium for neurons [27], we reduced the stress and improved the life span of the cultures. To evoke spontaneous electrical and calcium activity in DRG cultures, use of growth factors and cytokines such as NGF, BDNF or GDNF is a common practice [11,12]. However, synthetic sensitization of the neurons may bring unex-pected interactions [28,29]. Cheng et al. found out that elevation in NGF levels builds up syn-apse-like structures between sprouted neurites, resulting in mechanical hypersensitivity of healthy neurons [30]. Accordingly, to preserve physiological activity profiles as much as possi-ble, we did not resort to inflammation models for sensitization.
Electrical and optical techniques together were used by Wainger et al. for tracking the activ-ity of nociceptor neurons re-programmed from fibroblasts in order to develop a model for pain research [31]. Following that, Enright applied simultaneous Fluo-8 imaging with MEA-recording for investigating primary human DRG neurons exposed to chemical stimulants [32]. Fluo-8 has a better temporal resolution compared to the GECIs, however they are non-selective, run for limited durations of time and require strict dye-loading protocols [33]. In our approach, we used a targeted GECI to track only the glutamatergic DRG neurons, since glutamate is the presumed neurotransmitter between the DRG and the spinal cord [34]. Vesic-ular glutamate transporters vGLUTs, found in glutamatergic neurons, can be employed for targeting and identification of DRG neurons, particularly the vGLUT-2 subtype which is
Table 2. Multi-layered interaction profiles.
i ii iii ROIs 1− 6 0.61 0.74 0.77 ROIs 1− 4 0.53 0.72 0.81 ROIs 1− 5 - 0.91 0.75 ROIs 1− 9 - 0.79 0.76 ROIs 4− 5 - 0.65 0.75 ROIs 4− 6 0.61 0.42 0.82 ROIs 4− 9 - 0.80 0.90 ROIs 5− 6 - 0.76 0.73 ROIs 5− 9 - 0.77 0.78 ROIs 6− 9 - 0.57 0.77
�Only significant MPC scores (p<0.05) included, determined using Eqs4and5.
Fig 7. Immunocytochemistry. DRG culture on a MEA plate fixed on DIV3. Top: Figure shows maximum intensity
projection of 14 z-stack images acquired in various depths, merging 3 channels.β-III Tubulin is shown in red, Synaptophysin is shown in green and DAPI is shown in blue. Bottom: (1) and (2) show a soma-axon connection and an axon terminal in detail. The axon-axon intersection sites are observed widespread. The a, b, c and d labels show tubulin, synaptophysin, DAPI and brightfield channels. Objective: 40X, scale bar:10μm.
found broadly and expressed more in medium to small, nociceptive neurons [26,35]. The ani-mal model we used ensures correct identification of GCaMP6s expressing vGLUT-2 positive DRG neurons.
The stimulation, protocols used in previous works were usually limited to chemical applica-tions [12,31,32] and modality-specific stimuli like heat and cold [11] or mechanical stress [20]. In our protocol, we employed local electrical stimulation with an almost single-cell preci-sion and bypassed the unselective applications of modality-specific assays. As a result, by selec-tive application of stimulus trains, we intended to imitate the encoded sensory signals which may originate from any modality.
In a previous related study, Newberry et al. developed spontaneously active DRG cultures grown on MEA plates in order to study sensory neurons within a network context [12]. After-wards, Black et al. conducted experiments with DRG neurons on multi-well MEA platforms and observed synchronous and correlated activity, which was discussed to be originating from gap junctions but not synaptic connections [11]. By using glutamatergic receptor antagonists, we successfully blocked the interconnected activity and showed the existence of glutamatergic post-synapses in cultured DRG neurons functionally. Subsequently, we investigated the pres-ence of synapse formations structurally using ICC technique. Synapses were effectively stained with the pre-synapse marker synaptophysin. These successive findings, for the first time, con-firmed the materialization of complete synapses and formation of synaptic networks in the DRG cultures.
The first part of our extracellular electrophysiology experiments defines the primary neuro-nal responses to stimulation and, the second part shows the basic interaction profiles between the primary and the secondary neurons. The third part investigates the network properties involving interactions of multiple neurons. Analyses summarized inFig 6shows the excitabil-ity alterations and thus the decreased thresholds of excitation. In addition, it is found that the number of connected pairs are also increased after repetitive stimulation. The significant changes occur due to repetitive stimulation and these findings suggest an underlying synaptic facilitation mechanism [26].
Causal transitions of the neuronal activity are not covered in this study and exact axonal tracing is left for future studies. Since the connections are essentially axonal, instead of only monitoring the neuron bodies, use of an axonal-GCaMP indicator could provide more infor-mation by allowing imaging of axonal calcium transitions [36]. Since dissociated cell culture models lack organizational structure and deviate from in vivo conditions, we recommend additional experiments involving explant or slice cultures which would be more confluent with denser interactions.
We developed a versatile setup to study the network behavior of adult DRG neurons in vitro. This setup combines MEAs for stimulation and genetically encoded calcium indicator (GECI) based monitoring. The sensitivity achieved by Ca2+imaging allows recording from adult DRG neurons in vitro without resorting to any inflammation model. Evoked responses from cultured DRG neurons through almost single-cell stimulations showed similarities between individual responses and correlation analyses verified statistical relationships between neurons. We demonstrated that this correlation originates from functional synaptic connec-tions using glutamatergic post-synaptic blockers. Applying pre-synaptic marker synaptophy-sin, we verified the presence of synapses also structurally. Multi-layer network experiments revealed that continuous stimulation increases coupling strength of neurons. Our results sug-gest a new type of neuron-to-neuron interaction conducted through synaptic connections in cultured DRG neurons in which a stimulated neuron either modulates spontaneous activity of other neurons or activates previously quiet neurons.
Somata of sensory neurons do not form any synapses with each other inside the DRG in-vivo [2,37–39]. However, we have shown synapse formation between DRG neurons in vitro. In dissociated culture model, DRG neurons are released from ganglion structure and, connec-tive and glial tissue layers are removed. This alteration can be a cue for synapse formation. In addition, the dissociation procedure itself may act as an injury model which is known to repro-gram DRG neurons and temporarily alter cell identity [40,41]. Functional and structural syn-apse formation and network development potential of sensory neurons may explain neuron-to-neuron interactions in a new scope [3]. These findings may shed new light on various disor-ders such as neuropathies, fibromyalgia, small fiber neuropathy, immune-mediated hyperalge-sia, and other pain syndromes of peripheral nervous system [42,43].
Supporting information
S1 File. Solutions and media.
(DOCX)
S1 Video. Basic interactions.
(ZIP)
S2 Video. Immunocytochemistry.
(MP4)
Author Contributions
Conceptualization: F. Kemal Bayat, Halil O¨ zcan Gu¨lc¸u¨r, Albert Gu¨veniş.
Data curation: F. Kemal Bayat, Betul Polat Budak, Esra Nur Yiğit.
Formal analysis: F. Kemal Bayat, Betul Polat Budak, Esra Nur Yiğit.
Funding acquisition: Albert Gu¨veniş.
Investigation: F. Kemal Bayat, Betul Polat Budak.
Methodology: F. Kemal Bayat, Betul Polat Budak, Esra Nur Yiğit.
Project administration: F. Kemal Bayat, Albert Gu¨veniş.
Resources: F. Kemal Bayat, Esra Nur Yiğit, Halil O¨ zcan Gu¨lc¸u¨r, Albert Gu¨veniş.
Software: Halil O¨ zcan Gu¨lc¸u¨r.
Supervision: Gu¨rkan O¨ ztu¨rk, Halil O¨ zcan Gu¨lc¸u¨r, Albert Gu¨veniş.
Visualization: F. Kemal Bayat, Betul Polat Budak.
Writing – original draft: F. Kemal Bayat, Betul Polat Budak.
Writing – review & editing: F. Kemal Bayat, Betul Polat Budak, Esra Nur Yiğit, Gu¨rkan
O¨ ztu¨rk, Halil O¨ zcan Gu¨lc¸u¨r, Albert Gu¨veniş.
References
1. Krames ES. The dorsal root ganglion in chronic pain and as a target for neuromodulation: a review. Neuromodulation. 2015; 18(1):24–32; discussion Epub 2014/10/30.https://doi.org/10.1111/ner.12247
PMID:25354206.
2. Amir R, Devor M. Electrical excitability of the soma of sensory neurons is required for spike invasion of the soma, but not for through-conduction. Biophys J. 2003; 84(4):2181–91. Epub 2003/04/02.https:// doi.org/10.1016/S0006-3495(03)75024-3PMID:12668427; PubMed Central PMCID: PMC1302785.
3. Devor M. Unexplained peculiarities of the dorsal root ganglion. Pain. 1999;Suppl 6:S27–S35. Epub 1999/09/24.https://doi.org/10.1016/S0304-3959(99)00135-9PMID:10491970.
4. Monkhouse S. Cranial nerves: functional anatomy. Cambridge, UK; New York: Cambridge University Press; 2006.
5. Ma C, LaMotte RH. Multiple sites for generation of ectopic spontaneous activity in neurons of the chroni-cally compressed dorsal root ganglion. J Neurosci. 2007; 27(51):14059–68. Epub 2007/12/21.https:// doi.org/10.1523/JNEUROSCI.3699-07.2007PMID:18094245; PubMed Central PMCID:
PMC3035427.
6. Devor M. Unexplained peculiarities of the dorsal root ganglion. Pain. 1999;Suppl 6:S27–35. Epub 1999/ 09/24.https://doi.org/10.1016/S0304-3959(99)00135-9PMID:10491970.
7. Miller KE, Hoffman EM, Sutharshan M, Schechter R. Glutamate pharmacology and metabolism in peripheral primary afferents: physiological and pathophysiological mechanisms. Pharmacol Ther. 2011; 130(3):283–309. Epub 2011/02/01.https://doi.org/10.1016/j.pharmthera.2011.01.005PMID:
21276816; PubMed Central PMCID: PMC5937940.
8. Killian NJ, Vernekar VN, Potter SM, Vukasinovic J. A Device for Long-Term Perfusion, Imaging, and Electrical Interfacing of Brain Tissue In vitro. Front Neurosci. 2016; 10:135. Epub 2016/04/12.https:// doi.org/10.3389/fnins.2016.00135PMID:27065793; PubMed Central PMCID: PMC4815559.
9. Obien ME, Deligkaris K, Bullmann T, Bakkum DJ, Frey U. Revealing neuronal function through micro-electrode array recordings. Front Neurosci. 2014; 8:423. Epub 2015/01/23.https://doi.org/10.3389/ fnins.2014.00423PMID:25610364; PubMed Central PMCID: PMC4285113.
10. Vassallo A, Chiappalone M, De Camargos Lopes R, Scelfo B, Novellino A, Defranchi E, et al. A multi-laboratory evaluation of microelectrode array-based measurements of neural network activity for acute neurotoxicity testing. Neurotoxicology. 2017; 60:280–92. Epub 2016/04/03.https://doi.org/10.1016/j. neuro.2016.03.019PMID:27036093.
11. Black BJ, Atmaramani R, Kumaraju R, Plagens S, Romero-Ortega M, Dussor G, et al. Adult mouse sen-sory neurons on microelectrode arrays exhibit increased spontaneous and stimulus-evoked activity in the presence of interleukin-6. J Neurophysiol. 2018; 120(3):1374–85. Epub 2018/06/28.https://doi.org/ 10.1152/jn.00158.2018PMID:29947589; PubMed Central PMCID: PMC6171072.
12. Newberry K, Wang S, Hoque N, Kiss L, Ahlijanian MK, Herrington J, et al. Development of a spontane-ously active dorsal root ganglia assay using multiwell multielectrode arrays. J Neurophysiol. 2016; 115 (6):3217–28. Epub 2016/04/08.https://doi.org/10.1152/jn.01122.2015PMID:27052585; PubMed Cen-tral PMCID: PMC4946598.
13. Akerboom J, Chen TW, Wardill TJ, Tian L, Marvin JS, Mutlu S, et al. Optimization of a GCaMP calcium indicator for neural activity imaging. J Neurosci. 2012; 32(40):13819–40. Epub 2012/10/05.https://doi. org/10.1523/JNEUROSCI.2601-12.2012PMID:23035093; PubMed Central PMCID: PMC3482105.
14. Zhao Y, Araki S, Wu J, Teramoto T, Chang YF, Nakano M, et al. An expanded palette of genetically encoded Ca(2)(+) indicators. Science. 2011; 333(6051):1888–91. Epub 2011/09/10.https://doi.org/10. 1126/science.1208592PMID:21903779; PubMed Central PMCID: PMC3560286.
15. Zariwala HA, Borghuis BG, Hoogland TM, Madisen L, Tian L, De Zeeuw CI, et al. A Cre-dependent GCaMP3 reporter mouse for neuronal imaging in vivo. J Neurosci. 2012; 32(9):3131–41. Epub 2012/ 03/02.https://doi.org/10.1523/JNEUROSCI.4469-11.2012PMID:22378886; PubMed Central PMCID: PMC3315707.
16. Cengiz N, Ozturk G, Erdogan E, Him A, Oguz EK. Consequences of neurite transection in vitro. J Neu-rotrauma. 2012; 29(15):2465–74.https://doi.org/10.1089/neu.2009.0947PMID:20121423; PubMed Central PMCID: PMC3471124.
17. Gross GW, Rhoades BK, Reust DL, Schwalm FU. Stimulation of monolayer networks in culture through thin-film indium-tin oxide recording electrodes. Journal of neuroscience methods. 1993; 50(2):131–43.
https://doi.org/10.1016/0165-0270(93)90001-8PMID:8107494.
18. Wagenaar DA, Pine J, Potter SM. Effective parameters for stimulation of dissociated cultures using multi-electrode arrays. Journal of neuroscience methods. 2004; 138(1–2):27–37.https://doi.org/10. 1016/j.jneumeth.2004.03.005PMID:15325108.
19. Chisholm KI, Khovanov N, Lopes DM, La Russa F, McMahon SB. Large Scale In Vivo Recording of Sensory Neuron Activity with GCaMP6. eNeuro. 2018; 5(1). Epub 2018/04/18.https://doi.org/10.1523/ ENEURO.0417-17.2018PMID:29662940; PubMed Central PMCID: PMC5898788.
20. Emery EC, Luiz AP, Sikandar S, Magnusdottir R, Dong X, Wood JN. In vivo characterization of distinct modality-specific subsets of somatosensory neurons using GCaMP. Science advances. 2016; 2(11): e1600990.https://doi.org/10.1126/sciadv.1600990PMID:27847865; PubMed Central PMCID: PMC5106201.
21. Johnstone AF, Gross GW, Weiss DG, Schroeder OH, Gramowski A, Shafer TJ. Microelectrode arrays: a physiologically based neurotoxicity testing platform for the 21st century. Neurotoxicology. 2010; 31 (4):331–50. Epub 2010/04/20.https://doi.org/10.1016/j.neuro.2010.04.001PMID:20399226.
22. Schindelin J, Arganda-Carreras I, Frise E, Kaynig V, Longair M, Pietzsch T, et al. Fiji: an open-source platform for biological-image analysis. Nat Methods. 2012; 9(7):676–82.https://doi.org/10.1038/nmeth. 2019PMID:22743772; PubMed Central PMCID: PMC3855844.
23. Harris KD, Quiroga RQ, Freeman J, Smith SL. Improving data quality in neuronal population recordings. Nat Neurosci. 2016; 19(9):1165–74. Epub 2016/08/30.https://doi.org/10.1038/nn.4365PMID:
27571195; PubMed Central PMCID: PMC5244825.
24. Jang MJ, Nam Y. NeuroCa: integrated framework for systematic analysis of spatiotemporal neuronal activity patterns from large-scale optical recording data. Neurophotonics. 2015; 2(3):035003. Epub 2015/08/01.https://doi.org/10.1117/1.NPh.2.3.035003PMID:26229973; PubMed Central PMCID: PMC4516777.
25. Mormann F, Lehnertz K, David P, Elger C. Mean phase coherence as a measure for phase synchroni-zation and its application to the EEG of epilepsy patients2000. 358–69 p.
26. Fernandez-Montoya J, Avendano C, Negredo P. The Glutamatergic System in Primary Somatosensory Neurons and Its Involvement in Sensory Input-Dependent Plasticity. Int J Mol Sci. 2017; 19(1). Epub 2017/12/28.https://doi.org/10.3390/ijms19010069PMID:29280965; PubMed Central PMCID: PMC5796019.
27. Brewer GJ, Torricelli JR, Evege EK, Price PJ. Optimized survival of hippocampal neurons in B27-sup-plemented Neurobasal, a new serum-free medium combination. J Neurosci Res. 1993; 35(5):567–76. Epub 1993/08/01.https://doi.org/10.1002/jnr.490350513PMID:8377226.
28. Gavazzi I, Kumar RD, McMahon SB, Cohen J. Growth responses of different subpopulations of adult sensory neurons to neurotrophic factors in vitro. Eur J Neurosci. 1999; 11(10):3405–14. Epub 1999/11/ 17.https://doi.org/10.1046/j.1460-9568.1999.00756.xPMID:10564348.
29. Tanaka K, Tsukahara T, Hashimoto N, Ogata N, Yonekawa Y, Kimura T, et al. Effect of nerve growth factor on delayed neuronal death after cerebral ischaemia. Acta Neurochir (Wien). 1994; 129(1–2):64– 71. Epub 1994/01/01.https://doi.org/10.1007/BF01400875PMID:7998499.
30. Cheng CF, Cheng JK, Chen CY, Rau RH, Chang YC, Tsaur ML. Nerve growth factor-induced synapse-like structures in contralateral sensory ganglia contribute to chronic mirror-image pain. Pain. 2015; 156 (11):2295–309. Epub 2015/06/30.https://doi.org/10.1097/j.pain.0000000000000280PMID:26121254.
31. Wainger BJ, Buttermore ED, Oliveira JT, Mellin C, Lee S, Saber WA, et al. Modeling pain in vitro using nociceptor neurons reprogrammed from fibroblasts. Nat Neurosci. 2015; 18(1):17–24. Epub 2014/11/ 25.https://doi.org/10.1038/nn.3886PMID:25420066; PubMed Central PMCID: PMC4429606.
32. Enright HA, Felix SH, Fischer NO, Mukerjee EV, Soscia D, McNerney M, et al. Long-term non-invasive interrogation of human dorsal root ganglion neuronal cultures on an integrated microfluidic multielec-trode array platform. Analyst. 2016; 141(18):5346–57. Epub 2016/06/29.https://doi.org/10.1039/ c5an01728aPMID:27351032.
33. Lock JT, Parker I, Smith IF. A comparison of fluorescent Ca(2)(+) indicators for imaging local Ca(2)(+) signals in cultured cells. Cell Calcium. 2015; 58(6):638–48. Epub 2015/11/18.https://doi.org/10.1016/j. ceca.2015.10.003PMID:26572560; PubMed Central PMCID: PMC4658286.
34. Li P, Calejesan AA, Zhuo M. ATP P2x receptors and sensory synaptic transmission between primary afferent fibers and spinal dorsal horn neurons in rats. J Neurophysiol. 1998; 80(6):3356–60. Epub 1998/ 12/24.https://doi.org/10.1152/jn.1998.80.6.3356PMID:9862932.
35. Malet M, Vieytes CA, Lundgren KH, Seal RP, Tomasella E, Seroogy KB, et al. Transcript expression of vesicular glutamate transporters in lumbar dorsal root ganglia and the spinal cord of mice—effects of peripheral axotomy or hindpaw inflammation. Neuroscience. 2013; 248:95–111. Epub 2013/06/04.
https://doi.org/10.1016/j.neuroscience.2013.05.044PMID:23727452; PubMed Central PMCID: PMC3800240.
36. Broussard GJ, Liang Y, Fridman M, Unger EK, Meng G, Xiao X, et al. In vivo measurement of afferent activity with axon-specific calcium imaging. Nat Neurosci. 2018; 21(9):1272–80. Epub 2018/08/22.
https://doi.org/10.1038/s41593-018-0211-4PMID:30127424.
37. Gu Y, Chen Y, Zhang X, Li GW, Wang C, Huang LY. Neuronal soma-satellite glial cell interactions in sensory ganglia and the participation of purinergic receptors. Neuron Glia Biol. 2010; 6(1):53–62. Epub 2010/07/08.https://doi.org/10.1017/S1740925X10000116PMID:20604979; PubMed Central PMCID: PMC3120217.
38. Huang LY, Gu Y, Chen Y. Communication between neuronal somata and satellite glial cells in sensory ganglia. Glia. 2013; 61(10):1571–81. Epub 2013/08/07.https://doi.org/10.1002/glia.22541PMID:
39. Pannese E. The satellite cells of the sensory ganglia. Adv Anat Embryol Cell Biol. 1981; 65:1–111. Epub 1981/01/01.https://doi.org/10.1007/978-3-642-67750-2PMID:7013430.
40. Garriga J, Laumet G, Chen SR, Zhang Y, Madzo J, Issa JJ, et al. Nerve Injury-Induced Chronic Pain Is Associated with Persistent DNA Methylation Reprogramming in Dorsal Root Ganglion. J Neurosci. 2018; 38(27):6090–101. Epub 2018/06/08.https://doi.org/10.1523/JNEUROSCI.2616-17.2018PMID:
29875269; PubMed Central PMCID: PMC6031579.
41. Renthal W, Tochitsky I, Yang L, Cheng YC, Li E, Kawaguchi R, et al. Transcriptional Reprogramming of Distinct Peripheral Sensory Neuron Subtypes after Axonal Injury. Neuron. 2020; 108(1):128–44 e9. Epub 2020/08/19.https://doi.org/10.1016/j.neuron.2020.07.026PMID:32810432; PubMed Central PMCID: PMC7590250.
42. Martinez-Lavin M. Dorsal root ganglia: fibromyalgia pain factory? Clin Rheumatol. 2021. Epub 2021/01/ 08.https://doi.org/10.1007/s10067-020-05528-zPMID:33409721; PubMed Central PMCID:
PMC7787228.
43. Esposito MF, Malayil R, Hanes M, Deer T. Unique Characteristics of the Dorsal Root Ganglion as a Tar-get for Neuromodulation. Pain Med. 2019; 20(Suppl 1):S23–S30. Epub 2019/06/04.https://doi.org/10. 1093/pm/pnz012PMID:31152179; PubMed Central PMCID: PMC6544557.