m Æ c m o N
'! 990-1992
/і. * ; Ь ¡V·"· /-!j .-:73U 7; Г*·-_i-S
isI
jC^Stt.@dt to 'ікяш îF s η.·8Γ?%·!^;!€^7·
ІІГЙstifcte o t Ш х ш II
Jf' îT^
hC-Ş· Я
** '''** '■іХ>
¡·’ Чî 2
S'* •^\· ■^.*'''·'··. ■^**^ ' t b· ^¿4^ І.ІЛІѴ6іТ5
Ш
P â i tial FuIifiMmenit o f T-bs
fa r îb e
w .fff .Q-ri ñ I Л r?ibf'П πΫ cí ·«» '"i# '•«^ '»V·'' '·««·'·Λι4ί··«^ ^ CvínW М Ш й і Ж O F . i S f İ M £ С О Ш М Ю а S 7 0 6 . S•Z88
I3 S S f c - ı - İ O . Ä'* ÍÍ' ί, Κ , ί ϊ , ί Η , . ' 'wO .·. ^ -j- ч;. O ■.«*APPLICATION OF MARKOWITZ PORTFOLIO SELECTION MODEL TO ISTANBUL STOCK EXCHANGE
1990-1992
A Thesis
Submitted to the Department of Economics and the Institute of Economics and Social Sciences of
Bilkent University
In Partial Fullfillment of the Requirements for the Degree of
MASTER OF ARTS IN ECONOMICS
by
Hande ALKAZAN October 1995
И б г Б Т - 0 ^ ^ 5
. 1 . 8>.s A m 5
Page ABSTRACT...iii SUMMARY... iv ACKNOWLEDGEMENTS... v LIST OF TABLES...vi LIST OF FIGURES...vii CHAPTER 1. INTRODUCTION... 1
CHAPTER 2. THEORY OF THE MODEL...2
2.1. Foundations of the Model... 2
2.1.1. Behaviour of Stock Prices... 2
2.1.2. Behaviour of Investors Participating in the Market .3 2.2. Portfolio Theory of Markowitz... 4
2.2.1. Mean - Variance Criterion for Choosing Optimal Portfolio... 4
2.2.2. Constructing the Efficient Frontier... 5
2.2.3. Graphical Representation of Efficient Frontier... 10
2.3. Literature Survey... 11
CHAPTER 3. MUTUAL FUNDS IN GENERAL... 15
3.1. Unit Investment Trusts...15
3.2. Closed - End Investment Trusts... 16
3.3. Open - End Investment Trusts... 17
3.4. Mutual Funds in Turkey...17
CHAPTER 4. APPLICATION AND EMPIRICAL RESULTS... 19
CHAPTER 5. CONCLUSION...27
REFERENCES...28
I certify that I have read this thesis and in my opinion it is fully adequate, in scope and in quality, as a thesis for the degree of Master of Arts in Economics.
Assoc. Prof. Dr, Ümit Erol
I certify that I have read this thesis and in my opinion it is fully adequate, in scope and in quality, as a thesis for the degree of Master of Arts in Economics.
Ass. Prof. Dr. Faruk Selçuk
I certify that I have read this thesis and in my opinion it is fully adequate, in scope and in quality, as a thesis for the degree of Master of Arts in Economics.
s A
Ass. Prof. Dr. Kıvılcım Metin
APPLICATION OF MARKOWITZ PORTFOLIO SELECTION MODEL TO ISTANBUL STOCK EXCHANGE
1990-1992
Hande Alkazan MA in Economics
Supervisor: Assoc. Prof. Dr. Ümit Erol October 1995
In this study, Markowitz Efficient Frontier is constructed by using stock prices in Istanbul stock exchange for the period of 1990-92. This set of efficient portfolios is compared with mutual funds which are randomly chosen for the same period. Comparison is done on the basis of mean-variance criteria. According to the empirical results, chosen mutual funds for the period of
1990-92 are found to be inefficient.
ABSTRACT
Keywords; Mean, Variance, Portfolio, Markowitz Portfolio Selection Theory, Mutual Funds.
ÖZET
MARKOWITZ PORTFÖY SEÇME METODUNUN
İSTANBUL MENKUL KIYMETLER BORSASINA UYGULANMASI MASI 1990-1992
Hande Alkazan
Yüksek Lisans Tezi, İktisat Bölümü Tez Yöneticisi; Doç. Dr. Ümit Erol
October 1995
Bu çalışmada İstanbul Menkul Kıymetler Borsasında işlem gören hisse senetlerinin 1990 -1992 yılları arasındaki değerleri kullanılarak Markowitz Etkin Sınırı çizilmiştir. Bu etkin portföylerden oluşan grup aynı dönem için rastgele seçilmiş yatırım fonları ile kıyaslanmıştır.Bu kıyaslama ortalama değer ve varyans bazında olmuştur. Ampirik sonuçlara göre, seçilen yatırım fonları 1990-1992 dönemi için etkin bulunmamıştır.
Anahtar Kelimeler: Ortalama değer, varyans, portföy, Markowitz Portföy
Seçme Teorisi, yatırım fonları..
I am grateful to Assoc. Prof. Dr. Ümit Erol for his close supervision and guidance throughout the study. Without his generous contributions, this study would surely not see the light of the day.
I would like to extend my special thanks to Mustafa Özçam for his help in project formulation and also for collecting data.
I am particularly indebted to Behrooz Samin and his friend Ali.for their help in typing.
I also thank to my family and my all friends for their invaluable supports.
ACKNOWLEDGEMENTS
Last but not the least, I would like to extend my gratitude to Ass. Prof Dr. Faruk Selçuk and Ass. Prof. Dr. Kıvılcım Metin for their support and understanding during my presentation.
LIST OF TABLES
Table Page
1. Structure of Mutual Funds in Turkey ... 18
2. Share of Mutual Funds in Total Savings... 19
3. Regression Results of Chosen Stocks... 20
4. Average (i Values of the Portfolios... ... 22
5. Optimal Weights of 19 Stocks... 23
6. Standart Deviation and Mean Of Efficient Portfolios According to Different Riskless Rates... 25
7. Standart Deviation and Means of the Chosen Mutual Funds... 26
LIST OF FIGURES
Figure Page
1. Graphical Representation of Efficient Frontier...10 2. Graphical Representation of Empirical Results...26
Mutual funds are permitted to be established in Turkey by the Capital Market Law. However the first mutual fund is established by İŞ Bankası in 1987. In Turkey mutual fund managers who are bankers prefer riskless assets in majority while constructing fund portfolios.These comprise treasury bonds,treasury bills, private sector bonds so on.
The aim of this study is to make some observations on mutual fund structures in Turkey and test the efficiency of them for the period of 1990- 1992. Therefore a mean variance efficient portfolio is constructed by Markowitz Portfolio Selection Theory, which defines efficient portfolio as the one which has minimum varience among the others for the same expected return. The basic underlying assumption of the theory is the risk aversion of investors. Efficiency of mutual funds is tested by comparing mean and variances of them with Markowitz Efficient Frontier.
1. INTRODUCTION
In section II of this study, theoretical foundations of the model and a limited literature survey are given. In section 111, a general information about mutual funds and their position in Turkey are explained. In section IV, application of the model and empirical results are discussed. Section V is the conclusion.
2.1. Foundations of the Model
Before going through the model used in this.study, basic theories underlying the model should be stated briefly. These theories are about the behaviour of the stock prices, participants involved in the market.
Participants are assumed to be risk averse, utility maximizer consumers.
2.1.1. Behaviour of Stock Prices
According to Jensen^ due to his empirical investigations in stock market, stock prices follow a submartingale form. That is to say, that market is a weakly efficient market. A weakly efficient market is the one in which it takes time to evaluate a new price of information in regard to the determination of the concerning subject. In stock market, that subject is the value of the security. In such a weakly efficient market, the past price series of a security will not be effective on the value of the security. In mathematical terms ;
2. THEORY OF THE MODEL
E[x(t+x)|x(t),x(t-1 ),x(t-2),.. .]=E[x(t+x)lx(t)]=f(x)x(t) X = 1, ... , 00
x(t) = price of security at time t
E(x(t+x) = Expected value of future price
(
1
)
1 Jensen, Michael C. (1968). The Performance of Mutual Funds in the Period 1945- 1964, Journal of Finance. Vol.23, pp.392
The equation says that, price of the security follows a submartingale that is the expected value of the future prices is independent of the sequence of past prices x(t-T) (t = 1 ... o o ). However, this does not mean that present price is not the only one tool for forecasting the future price of the security.
2.1.2. Behaviour of Investors Participating in the Market
It is assumed in rational choice under uncertainty context that, a rational individual who faced with a choice under conditions of uncertainty tries to maximize his expected utility. He acts as if there are a number of choices corresponding to each possible outcome, chooses the one which has largest expected value of utility. So the general problem for the investor is that;
max U = U( c^, C2, ... CyW-p) U = utility of the investor Cj = consumption at time t T = time of death
w-r = bequest
(
2)
Then portfolio problem comes into the screen. Investor’s portfolio problem at any time t becomes the selection of a combination of investments which will enable him to achieve maximum expected utility. This consumption-investment problem is a multiperiod problem actually. However, because of the lack of a well-developed multiperiod theory of
choice under uncertainty, most researchers assume that portfolio decision can be treated as a single period decision. Hakanson [8] showed that if necessary and sufficient conditions are set by simplifying assumptions single-period solution, can lead to an optimal solution of the unrestricted multiperiod problem. The single-period problem can be written as ;
max E[u(c,,R,)]
Cj = Consumption at time t Rt = Return at time t
Xj = Portion of the asset in the portfolio
This last equation is the main point of the portfolio theory of Markowitz, which consists the basis of this study. Portfolio theory of Markowitz will be discussed thoroughly in the following part with its assumptions, implications so on.
2.2. Portfolio Theory of Markowitz
2.2.1. Mean-Variance Criterion for Choosing Optimal Portfolio
Markowitz bases his theory of investment choice under conditions of uncertainty on the mean and the variance of the distribution of returns. He has developed a mean-variance model for the selection of portfolios. According to this approach investors desire high returns but are averse to a high variance, which is taken as the indicator of a investment's risk. Both individual and institutional investors tend to diversify risk by building
portfolios which include a number of common stocks as well as cash and bonds. While choosing the portfolios among the other choices, the aim is to find the one with minimum variance for the same level of expected portfolio return.
In order to apply the Markowitz technique, the investor must form expectations about the future performance of all securities in his universe. These expectations include not only the expected return and variance of return for each security but also the covariances between all
possible pairs of returns.
Efficiency criteria are generally based on certain underlying assumptions regarding investors' taste. In addition to two basic assumptions about investors' taste which are;
1) investor always prefers more to less wealth (U'(R)>=0) 2) marginal utility of wealth declines (U"(R)<=0)
mean-variance criterion places further restrictions on the shape of investors' utility functions and the shape of the distribution of returns. These are i) the investors are assumed to be risk averters which means that their utility function is concave, ii) the returns are normally distributed.
2.2.2. Constructing the Efficient Frontier
In the light of the above definitions and assumptions portfolio selection problem can be stated again; Given n risky assets such as n
different stocks, investor tries to find a strategy which yields an efficient portfolio which means a portfolio of maximum return for the given risk or vice versa.
In order to demonstrate the problem of the investor some parameters should be given.
Pi= the expected (mean) return on the ith asset. aj2= the variance of the returns on the ith risky asset.
Ojj= the covariance of the returns on two different assets i and j (i;«tj) o = the risk-free interest rate available to all investors in the money
market.
The true parameters are unknown. For practical purposes ex-post estimates are obtained from statistical process of past observations. For each risky asset there are two parameters which are mean and the standard deviation. An investment strategy is to find proportions of each asset, in the n risky assets, while the remainder part of the portfolio will be invested in the riskless asset.
Sum of the proportions should be equal to one. So there are n+1 unknowns. Given the set of parameters of the n+1 assets the objective is to select an investment strategy that results in a .portfolio lying on the efficient frontier, which is minimizing the portfolio variance subject to a given level of portfolio return. This is done by using Lagrange Function.
Expected return of a portfolio of n-risky assets:
E(Rp) = XiE(Ri) + X2E(R2) + ...+ x„E(R,)
|ip= XiPi+X2P2+-+Xnfln
Pp= ^ XjPi... (3)
Variance of a portfolio of n-risky assets:
o2p= E[ZXiRj- ZXiPi]2 = E[Z(XiRi-XiPi)]2
= E[Z(XjRi-XiPi)2+2ZZ(XiRi-XiPi) (X| Rj-XjPj)] =E[ZXi2(Ri-pj)2+ 2ZZXiX/RrPi) (Rj-Hj)]
= ZXj2oj2+ 2ZZXjXjOij... (4)
^ \r ...
Substituting (5) into (4)
a2p= ZXj2aj2+ 2ZZXjXj6|jajaj... (6)
By using equations (6) and (3) minimization problem can be stated as follows:
min o2p= ZXj2oj2+ ZZXjXjSyajOj s.t. pp= ZXjPi
ZXj= 1
Related Lagrange function is:
The above Lagrange function does not contain riskless asset. If riskless asset is introduced in the problem, then;
Pp = I XiPi + (1-EXi)r
Then Lagrange will be:
L= SXi2a|2+ 2 EEXiXj5jjaiaj+ X[pp - EXjPj - (1 - ZXj)r] (8) To minimize the Lagrange function, it is differentiated with respect to unknowns x^, X2, ... , Xp, X.2, and set the derivatives equal to zero. Following equation system is;
dUdx^ = 0
2EXja| + 2EXjay + X,(-pj + r) = 0
IXiOj + IXjay = ^/2(pj - r)
XiOi2+ x^a^ 2 ■*· X3<^i3 + - + XnCfm = ^2 (p i - r) Xl02i + X2022 ^ X3023 + ... + Xp02n = X/2(p2 - r)
XlOpi + X20p2 + X30p3 + · · · + = ^/2(Pp - r)
Now there are n equations, but n +1 unkowhs; Therefore, we divide through by X/2 and define y; = (2/X)Xi
yiai2 + y20i2+··· +Уní71n = ^l1 - r yiG2i + y2CT2^ + ··· + yn<^2n = ^^2- ^
yi^^nl + y2<^n2 + ··· + = l^n - r A = r O i2 Oi2 *^21 *^2 '-’ In i^2n L ^n1 <^n2 B = r yi 1
I ya 1
L yn -1c =
r |ii - r ]I i^2->· I
L - r J
A: Variance - Covariance matrix of the system B: Vector of standardized unknown proportions C: Vector of expected return less riskless rate A®B = C
B = A-1<2)C
By matrix calculation optimum proportions can be found. Additionally by changing the riskless rate efficient frontier can be constructed. For each riskless rate a different optimum proportion set will appear. This can be shown graphically.
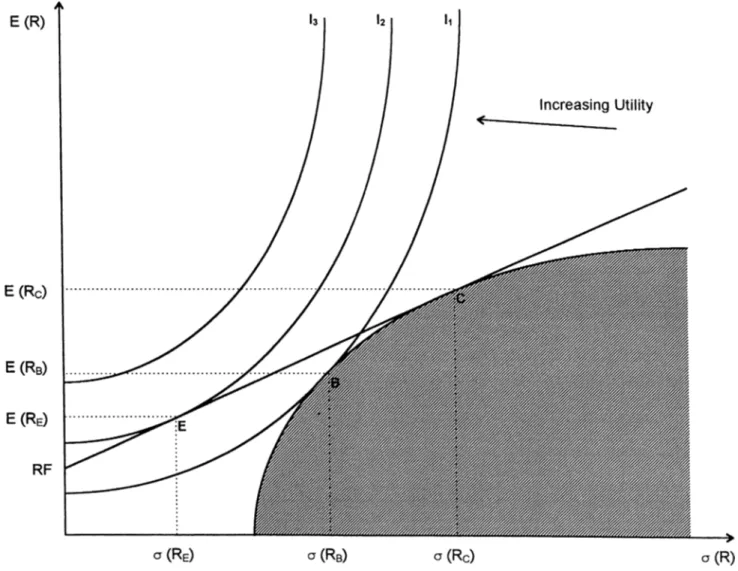
2.2.3. Graphical Representation of Efficient Frontier
Figure above represents all possible combinations of risk and return available from investments in risk-bearing securities. Portfolios lying on the boundary ABCD show the set of mean-variance efficient portfolios. They yield maximum expected return for given risk and minimum risk for given returns. Indifference curves are positively sloped and convex,
resulting from first two assumptions about the utility function of investors. Shaded area represents the opportunity set available to investor.
An investor limited to only risky assets will maximize his utility by choosing portfolio B according to the figure. When the riskless asset is introduced, optimal portfolio will be a point on the line RjC .
E (R ) = R f + ( E ( R , ) - R f / a ( R e ) ) a R a ( R ) < a ( R ,)
That point will be point E on the line. Clearly it can be seen that point E is better than point B because I2 > l^ This shows that if an investor can borrow or lend at the riskless rate, resulting optimum portfolio becomes profitable than the others.
2.3. Literature Survey
The effects of risk and uncertainty upon asset prices are important, so the problem related with selection of portfolio took the attention of economists for many years.
The method which is regarded by Kalman and Pogue2 in their article as the best analytical framework for selection of securities was first set by Markowitz^ who gives his name to the model in his 1959 book.
2 Kalman, J. Cohen, and Jerry A. Pogue. (1965). An Empirical Evaluation of
Alternative Portfolio Selection Models.The Journal of Business. Vol. 21, pp. 166--193 3 Markowitz,H.M.(1952).Portfolio Selection.Journal of Finance. Vol.7, pp.82
However, according to them Markowitz approach has not yet led to satisfactory solutions to the major problems of a real-world portfolio manager. One reason for that is; Markowitz model greatly simplifies real world at a number of points. Among these simplifications, he treats the portfolio selection as a one-time act rather than as a continous process. Secondly Markowitz model with its recognition of the interrelationships among the performances of he securities need computational demands on the computer; that is the need for calculation when faced with more than 2 or 3 assets. The second criticism of Kalman and Pogue^ can be stated also by numbers.
Number of Risky Asstes
(n)
2 510
50 100 300Number of Estimators needed (N) 6
21
66 1326 5151 45451Contrary to Kalman and Pogue's criticism, Markowitz^ has paid attention to useful rule of behaviours in his model. Some of them can be stated as;
- investor does consider expected return a desirable thing and variance of return an undesirable thing,
- investor does maximize the discounted value of future returns,
- investor does diversify his funds among all the securities which give maximum expected return. This assumption (law of large numbers) is
not wholly valid for portfolio selection, because diversification cannot eliminate all variances. Unsystematic part of the variance will stay.
Besides Markowitz, Tobin, Lintner, Sharpe can be stated as the founders of the portfolio selection theory.
Tobin^ searched the answer to the question of why people select their asset demands for cash balances although their return is less than the yield on alternative assets. He analysed the liquidity preference theory which states the inverse relationship between the demand for cash balances and the rate of interest, and dealt with its implications on portfolio selection problem. He paid attention to the proportion of portfolios.
Second assumption is about investors having risk averter behaviour and quadratic utility function in a competitive market.
Tobin has an important separation theorem about the proportions of securities. He first assumed that funds should be allocated only over "monetary assets" such as risk free cash, bonds of uncertain resale price and he allowed no short sales or borrowing. According to his separation theorem, the proportionate composition of the non-cash assets is
independent of their aggregate share of the investment balance.
Tobin,J.(1958). Liquidity Preference as Behaviour Towards Risk.Review of Economic Studies. Voi.25,pp.71
Additionally he has shown that determining the optimal portfolio and attaining the investor's highest indifference curve can be made independent of one another. If unlimited borrowing at the riskless rate r*, and reinvestment in a risky asset yields expected return, then it is assumed that the investor can move anywhere along the capital market line to achieve the highest indifference curve which maximizes the investor's utility.
Lintner^ focused on the types of risks (systematic and unsystematic) and their effects on the value of the stocks. According to him, total risk on a given security is the sum of the variance of its own return through the holding period and the combined covariance of its return with that of all other securities. He found out that the market price of risk involved in determining of the market values of individual securities within a portfolio of risky assets is not equal to the ratio of the expected return of the optimal portfolio to the standard deviation of this portfolio return.
Moreover, he dealt with Tobin's separation theorem, and developed an alternative proof of it.
Sharpe® also analysed the relationship between the extent of portfolio diversification and the reduction in the variation (risk) associated with portfolio returns. Sharpe stated the same point as Lintner about the systematic and unsystematic variation of the returns of stocks in the
^ Lintner, John. (1965). Security Prices, Risk, and Maximal Gains from Diversification.Journal of Finance. Vol. 20, pp. 595
® Sharpe, William F.(1964). Capital Asset Prices: A Theory of Market Equilibrium Under Conditions of Risk, Journal of Finance. Vol.19, pp. 427
market. He asked at which point the variation of returns is reduced as a function of the number of securities included in the portfolio. He found a predictable relationship between the number of securities and the size of the variance of portfolio. If the number of securities are increased in the market, one would expect the variation of the portfolio return to approach to the level of systematic variation which is the variation of market return.
3. MUTUAL FUNDS IN GENERAL
Mutual funds are established to pool the resources of many individuals and unexperienced investors to invest them in a diversified potfolio of securities. There are three types of investment funds.
3.1. Unit Investment Trusts
A unit investment trust is an investment company that owns a fixed set of securities for the life of the company. The composition of its portfolio is rarely altered. In order to establish a unit investment trust a sponsor (generally a brokerage firm) purchases a set of securities and deposits them with a trustee. Then a number of shares which are known as redeemable trust certificates are sold to the public. These certificates provide their owners a proportional interest. There is no active management of unit investment trust, so only under some exceptional circumstances its portfolio is changed.
Unit investment trusts generally hold fixed-income securities. After the last security in the portfolio has matured, the trust ends. Life spans of unit investment trusts range from six months to tv^enty years.
There exists secondary market for unit investment trusts. That is an investor can sell his share of unit investment trust whenever he wants so He does not have to hold the shares for the life of the trust. This secondary market is maintained by the sponsor of the trust.
3.2. Closed-End Investment Funds
Unlike unit investment trusts, closed-end funds do not stand ready to purchase their own shares whenever one of their owners decides to sell them. Instead of it, their shares can be traded on an organized exchange, just like any stock traded in stock exchange market.
Most closed-end funds have unlimited lives. Dividend and interest payments of the securities in the portfolio are generally reinvested by the shareholders. At that time the fund keeps the rnoney and sends the investor additional shares based on the net asset value per share.
Although it is seldom done, closed-end funds can repurchase their own shares in the open market. This is done if the market price of the share of the fund is below the net asset value per share. In such a circumstance, manager of the fund will sell the security in the portfolio if its net asset value is greater than the price in the open market and buy the fund's shares. The difference can be used to buy new securities for
the fund. By this way net asset value per share will increase depending on the value of new securities and the number of the shares.
3.3. Open-End Investment Funds
An investment fund which stands ready at any time to purchase its own shares is known as open-end investment fund. These funds continously offer new shares to the public for a price at or near the asset values.
There are two types of open-end investment funds. One is no-load funds, the other is load funds. No-load funds sell their shares at a price equel to net asset value. Load funds sell their shares by the help of brokers or other selling organizations. Therefore there is some amount of load change in addition to the net asset value.
When shareholders want to sell their shares, the amount paid to them is generally the net asset value times the number of shares. However, sometimes an amount of money can be cut from the payment under the name of redemption fee. Since fund can get back the shares whenever the shareholder wants, there is no need to maintain a secondary market for these funds.
3.4. Mutual Funds in Turkey
The law of mutual funds was first made in 1982 in Turkey. However, first mutual fund was established by İş Bankası in the last quarter of
1987. According to the 37*'’ article of Capital Market Law mutual fund is defined as the property which is established to manage the portfolio by using the financial tools such as foreign currency, stocks, gold. Management of the portfolio should be based on the principle of risk diversification. Management authority is given only to banks, insurance agencies on behalf of the individuals.
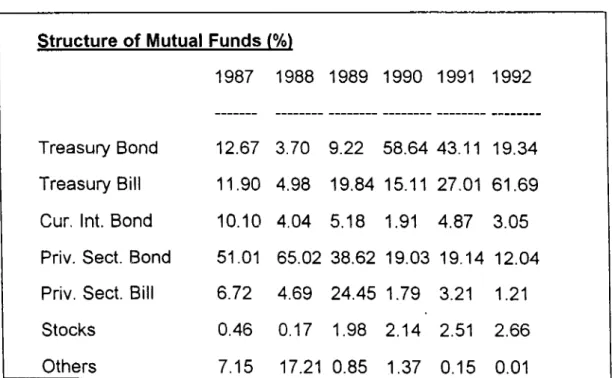
In the view of the fund structure, mutual funds in Turkey are similar to unit investment trusts. They consist of fixed income securities mostly, but do not end when the last security in the portfolio has matured.Following table shows the fund structures in Turkey for the period 1987-1992.
Table 1. Structure of Mutual Funds in Turkey
Structure of Mutual Funds 1
1987 1988 1989 1990 1991 1992
Treasury Bond 12.67 3.70 9.22 58.64 43.11 19.34
Treasury Bill 11.90 4.98 19.84 15.11 27.01 61.69
Cur. Int. Bond 10.10 4.04 5.18 1.91 4.87 3.05
Priv. Sect. Bond 51.01 65.02 38.62 19.03 19.14 12.04
Priv. Sect. Bill 6.72 4.69 24.45 1.79 3.21 1.21
Stocks 0.46 0.17 1.98 2.14 2.51 2.66
Others 7.15 17.21 0.85 1.37 0.15 0.01
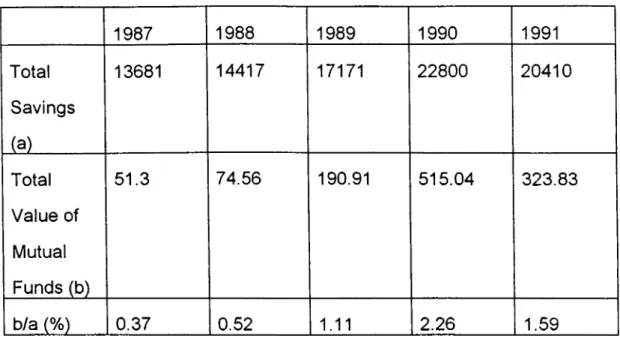
Table 2. Share of Mutual Funds in Total Savings (000,000$) 1987 1988 1989 1990 1991 Total Savings (a) 13681 14417 17171 22800 20410 Total Value of Mutual Funds (b) 51.3 74.56 190.91 515.04 323.83 b/a (%) 0.37 0.52 1.11 2.26 1.59
4. APPLICATION AND EMPIRICAL RESULTS
Data used in this study are the prices of the stocks listed in Istanbul Stock Exchange. The sample period is taken from January 1990 to December 1992 inclusive. Weekly return for each stock including the market index is found by using daily prices.^
In first part of the study, stock prices in 1990 are observed. For that year, weekly returns of all the stocks listed in the market, and weekly return of the m®arket index is found. Then OLS is applied to each of the stocks. That is:
Em = a + p E stock + Y
^ ^ week “ (^t+7 *Pt/ Pt )x 100 , here p j , pj+y are daily prices of the stock in the respective weeks.
Ем = Expected value of market return
-Stock = Expected value of stock return
a, p, Y sre OLS parameters
Among the 120 stocks, 19 stocks are chosen according to OLS results. The criteria in choosing the stocks are;
- p value found from regression should be about 1. So, that stock reflects the market.
-Stocks with highest R2- values, (since R2-values measures the proportion of the total sum of squares explained by the
regression).
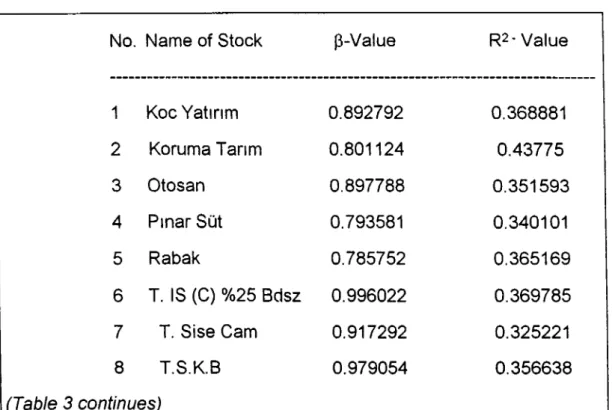
These stocks are represented in Table 3.
Table 3. Regression Results of Chosen Stocks
No. Name of Stock P-Value R2-Value
1 Кос Yatırım 0.892792 0.368881 2 Koruma Tarım 0.801124 0.43775 3 Otosan 0.897788 0.351593 4 Pınar Süt 0.793581 0.340101 5 Rabak 0.785752 0.365169 6 T. IS (C) %25 Bdsz 0.996022 0.369785 7 T. Sise Cam 0.917292 0.325221 8 T.S.K.B 0.979054 0.356638
(Table 3 continues)
20No. Name of Stock P-Value R2-Value
9 Brisa 0.965593 0.305983
10 Çimsa 0.890458 0.270781
11 Ege Gübre 0.854165 · 0.253081
12 Gübre Fabr. 0.911017 0.427843
13 İzmir Demir Çelik 0.878758 0.28931
14 Кос Holding 1.145173 0.286482 15 Maret 1.087182 0.345755 16 Nasaş 1.32253 0.361385 17 ŞİFA 1.105093 0.467197 18 T.Demir 1.044164 0.460013 19 Y. Kredi 1.202074 0.475542
Average of the p-values of the stocks is equal to 0.97198 which is nearly equal to 1.
After choosing the stocks which is used for constructing the efficient frontier, the second part of the study begins. In this part, observation period is taken from January 1991 to December 1992. This two years' period is divided into 8 subperiods. These periods are:
Period 1 Jan 91 -- March 91
Period 2 Jan 91 -- June 91
Period 3 Jan 91 - Sept 91
Period 4 Jan 91 -- Dec 91
Period 5 Period 6 Period 7 Period 8 Jan 91 -- Jan 91 -- Jan 91 - Jan 91 -· March 92 June 92 Sept 92 Dec 92
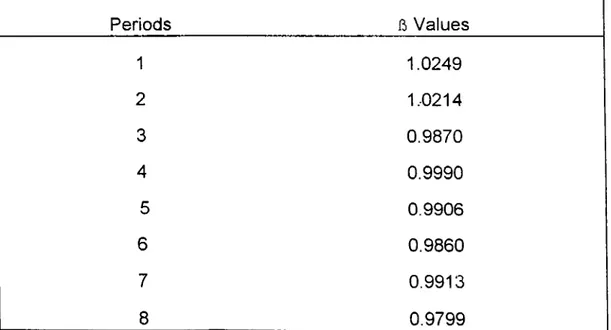
For each period OLS is applied to the chosen stocks. This is done to find out whether the p values of the stocks change or not. This is important since average p-value of the chosen portfolio should be about 1. At the end of first period Türkiye İş Bankası (C) is replaced with Bagfaş because p value of that stock is reduced to 0.7 which would effect portfolio average p negatively, p values of the portfolios in periods are in Table 4 .
Table 4. Average ii Values of the Portfolios
Periods fi) Values
1 1.0249 2 1.0214 3 0.9870 4 0.9990 5 0.9906 6 0.9860 7 0.9913 8 0.9799 22
Then, for each period by using Markowitz technique optimal weight of the stocks and the riskless asset are found. Here, one-year treasury bonds are used for the riskless asset. The annual interest rates of the bonds in 1991-1992 period are converted into weekly returns and the average of these bonds is taken to find return of riskless asset.s
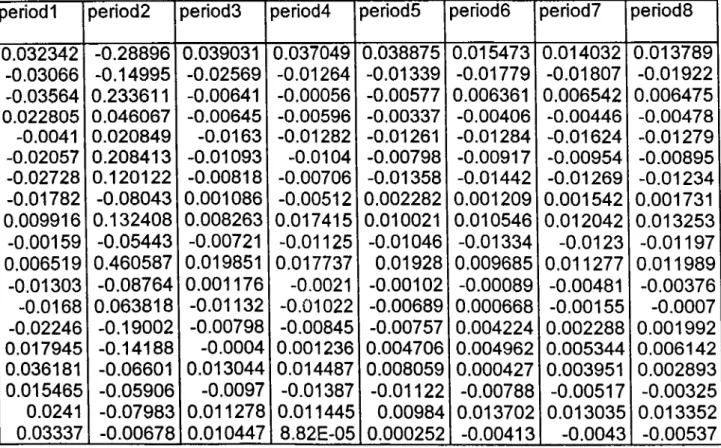
According to the results, more than 99% of the portfolio covers the riskless assets. The sum of the weights of 19 stocks is less than 1 for every portfolio. The optimal weights for 19 stocks are appeared in the Table 5.
Table 5. Optimal Weights of 19 Stocks
OPTIMAL WEIGHTS OF THE STOCKS
period 1 period2 period3 period4 period5 period6 period7 period8
0.032342 -0.28896 0.039031 0.037049 0.038875 0.015473 0.014032 0.013789 -0.03066 -0.14995 -0.02569 -0.01264 -0.01339 -0.01779 -0.01807 -0.01922 -0.03564 0.233611 -0.00641 -0.00056 -0.00577 0.006361 0.006542 0.006475 0.022805 0.046067 -0.00645 -0.00596 -0.00337 -0.00406 -0.00446 -0.00478 -0.0041 0.020849 -0.0163 -0.01282 -0.01261 -0.01284 -0.01624 -0.01279 -0.02057 0.208413 -0.01093 -0.0104 -0.00798 -0.00917 -0.00954 -0.00895 -0.02728 0.120122 -0.00818 -0.00706 -0.01358 -0.01442 -0.01269 -0.01234 -0.01782 -0.08043 0.001086 -0.00512 0.002282 0.001209 0.001542 0.001731 0.009916 0.132408 0.008263 0.017415 0.010021 0.010546 0.012042 0.013253 -0.00159 -0.05443 -0.00721 -0.01125 -0.01046 -0.01334 -0.0123 -0.01197 0.006519 0.460587 0.019851 0.017737 0.01928 0.009685 0.011277 0.011989 -0.01303 -0.08764 0.001176 -0.0021 -0.00102 -0.00089 -0.00481 -0.00376 -0.0168 0.063818 -0.01132 -0.01022 -0.00689 0.000668 -0.00155 -0.0007 -0.02246 -0.19002 -0.00798 -0.00845 -0.00757 0.004224 0.002288 0.001992 0.017945 -0.14188 -0.0004 0.001236 0.004706 0.004962 0.005344 0.006142 0.036181 -0.06601 0.013044 0.014487 0.008059 0.000427 0.003951 0.002893 0.015465 -0.05906 -0.0097 -0.01387 -0.01122 -0.00788 -0.00517 -0.00325 0.0241 -0.07983 0.011278 0.011445 0.00984 0.013702 0.013035 0.013352 0.03337 -0.00678 0.010447 8.82E-05 0.000252 -0.00413 -0.0043 -0.00537
9 Annual rate of return of the bond is converted into weekly return by the formula (1 +
^weekly)^^ “ (1 ^annual )
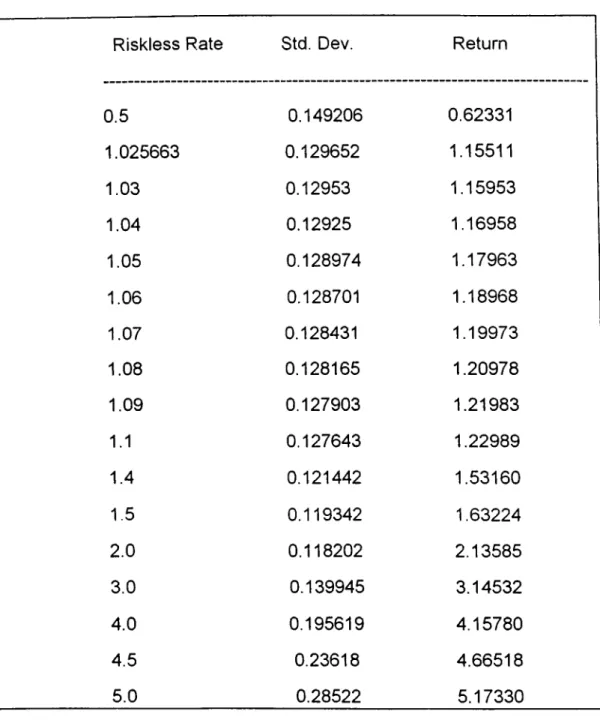
inefficient comparing to the optimum portfolio. Table 6 and Table 7 show the mean and standart deviation values for optimum portfolio and mutual funds respectively.
Table 6. Standart deviation and mean of efficient portfolios according to different riskless rates.
Riskless Rate Std. Dev. Return
0.5 0.149206 0.62331 1.025663 0.129652 1.15511 1.03 0.12953 1.15953 1.04 0.12925 1.16958 1.05 0.128974 1.17963 1.06 0.128701 1.18968 1.07 0.128431 1.19973 1.08 0.128165 1.20978 1.09 0.127903 1.21983 1.1 0.127643 1.22989 1.4 0.121442 1.53160 1.5 0.119342 1.63224 2.0 0.118202 2.13585 3.0 0.139945 3.14532 4.0 0.195619 4.15780 4.5 0.23618 4.66518 5.0 0.28522 5.17330 25
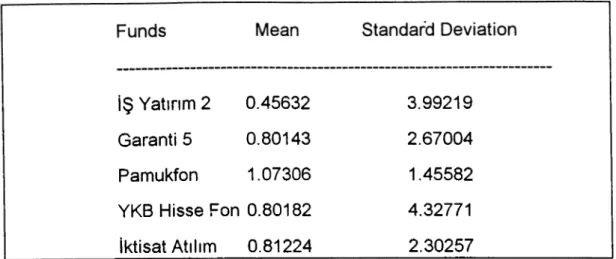
Table 7. Standart Deviation and Means of the Chosen Mutual Funds
İŞ Yatırım 2 0.45632 3.99219
Garanti 5 0.80143 2.67004
Pamukfon 1.07306 1.45582
YKB Hisse Fon 0.80182 4.32771
İktisat Atılım 0.81224 2.30257
These results can be shown graphically: Graphical Representation of Efficient Frontier
EFFICIENT FRONTIER
Standart Deviation (Log)
In this study the mean-variance efficient portfolio is constructed to introduce an alternative portfolio to the mutual fund managers in Turkey.
Markowitz mean-variance efficient portfolio is constructed by using prices of the stocks listed in Istanbul Stock Exchange for the period 1990- 1992 as data. Moreover six mutual funds are randomly chosen for the same period to compare the mean and variances by the efficient portfolio. At the end of the empirical study, they are found to be inside the efficient frontier which means that they are inefficient for the chosen period.
Another conclusion can also be pointed out by looking at Table 3 the which shows optimal weights of the stocks. In that table it is shown that sum of optimal weights of 19 stocks is not greater than 1% for all of the periods. This is an important result showing that; risk aversion assumption which is basic assumption of Markowitz Portfolio Theory holds on for the chosen period and chosen list of stocks.
5. CONCLUSION
REFERENCES
1) Markowitz, H.M. (1952). Portfolio Selection, Journal of Finance, Vol. 7, pp. 77-91.
2) Tobin, J.(1958). Liquidity Preference as Behavior Towards Risk, Review of Economic Studies. Vol.25, pp. 65—85.
3) Sharpe, W.F. Capital Asset Prices; A Theory of Market Equilibrium Under Conditions of Risk, Journal of Finance. Vol. 19,pp. 425-42.
4) Lintner, J.(1965). The Valuation of Risk Assets and The Selection of Risky Investments in Stock Portfolios and Capital Budgets, Review of Economics and Statistics. Vol.58, pp. 13-37.
5) Lintner, J.(1965). Security Prices, Risk, and Maximal Gains from Diversification, Journal of Finance. Vol.20, pp. 587-616.
6) Jensen, M.C.(1968). The Performance of Mutual Funds in the Period 1945-1964, Journal of Finance. Vol.23, pp.389-416.
7) Friend, I., V., Douglas.(1965). Portfolio Selection and Investment Performance, Journal of Finance. Vol.20, pp.391-415.
8) Kalman, J.C.,J.A. Pogue. (1965). An Empirical Evaluation of Alternative Portfolio Selection Models, The Journal of Business. Vol.21, pp. 166-193.